


Abstract
The thymidine analog 18F-3′-deoxy-3′ -fluorothymidine (FLT) is being used clinically for PET imaging of tumor proliferation. Appropriate use of this tracer requires validating the mechanisms by which it accumulates in dividing cells. We tested the accuracy with which FLT uptake predicted the activity of cytosolic thymidine kinase-1 (TK1), an enzyme that is upregulated before and during DNA synthesis. Methods: Cultured A549 human lung carcinoma cells were manipulated to a range of proliferation rates from actively dividing to growth arrested. Uptake of radiolabeled FLT was compared with cell cycle activity, which was expressed as the percentage of cells in S phase, and with activity of cytosolic TK1. We also compared uptake of FLT and deoxyglucose. We genetically manipulated A549 cells by transfecting them with human papillomavirus type 16 E6 (designated A549-E6) to abrogate function of the tumor suppressor gene, p53. Although radiation typically inhibits progression of mammalian cells through the cell cycle, abrogation of p53 function eliminates this inhibition. We then compared FLT uptake with the percentage of cells in S phase and TK1 activity in irradiated A549-E6 cells and in irradiated control cells having normal p53 function and the expected radiation-induced growth delay. Results: A549 cells with only 3%–5% cells in S phase took up little FLT and had low levels of TK1 activity. When cells were stimulated to grow by being placed into fresh medium, we observed a strong correlation between increased FLT uptake and increased TK1 activity. As expected, FLT uptake varied much more as a function of growth than did uptake of deoxyglucose. Nonproliferating A549 cells did not enter the cell cycle if they were irradiated before being placed into fresh medium, and they did not accumulate FLT or show elevated TK1 activity. In contrast, radiation did not inhibit the cell cycle progression of A549-E6 cells. When subcultured, they began to grow and showed increased uptake of FLT commensurate with greater TK1 activity. Conclusion: In cultured A549 cells FLT uptake is positively correlated with cell growth and TK1 activity. Inhibition of cell cycle progression prevents FLT uptake and increased TK1 activity. These results suggest that FLT images reflect TK1 activity and the percentage of cells in S phase.
Oncologists increasingly use PET to image tumor metabolism. PET is being developed to quantify cell proliferation, both to detect rapidly growing tumors and to measure the effect of treatment directed toward actively dividing cells. 11C-thymidine has been validated for imaging cell division in tumors (1–4). It is incorporated into DNA and has been used to infer DNA synthesis rates (5). However, the rapid production of radiolabeled metabolites of thymidine in the blood (6,7) and the short half-life of 11C (20 min) make the use of this tracer impractical for routine clinical measurements. Several research groups have searched for alternative tracers of cell proliferation, preferably tracers labeled with 18F or 124I because of their longer half-lives. This search has led to investigations with 18F-labeled 2′ -fluoro-5-14C-methyl-1-beta-d-arabinofuranosyluracil (FMAU) (8,9) and 124I-iododeoxyuridine (10) and to work with the thymidine analog 18F-3′-deoxy-3′ -fluorothymidine (FLT) (11–13).
FLT was evaluated as a chemotherapeutic agent for the treatment of leukemia (14), but researchers soon discovered that this new antimetabolite had exceptional anti-HIV activity, possibly superior to that of azidothymidine (15). However, toxicity observed during phase II clinical trials with FLT (16) deterred investigations with pharmacologic doses of drug. Nonetheless, the successful labeling of FLT with 18F (17) led to a novel proposal to use 18F-FLT as a radiopharmaceutical for monitoring HIV infection. Although this application was never pursued in animal models, the concept formed the basis for imaging cell proliferation in tumors.
Several aspects of FLT biochemistry suggested that it would be a useful PET tracer for imaging cell proliferation in vivo (11,18–20). FLT is resistant to catabolism by thymidine phosphorylase in vivo and is specifically phosphorylated in cells by cytosolic thymidine kinase-1 (TK1). TK1 is a principal enzyme in the DNA-salvage pathway in cells (18), one that is strongly regulated by the cell cycle and is selectively upregulated just before and during the S phase (18–21). In contrast, FLT is a poor substrate for mitochondrial thymidine kinase-2 (TK2).
These features motivated us to investigate FLT labeling with high-specific-activity 18F for imaging tumors with PET. The availability of an in vivo tracer of the DNA-salvage pathway that is convenient, sensitive, accurate, and catabolized less than thymidine could have an important impact on the way tumors are diagnosed and assessed as responsive in clinical situations (2,11). Currently, several groups are imaging tumors with 18F-FLT (22–25), but the mechanism of its retention in cells has not been validated. Some investigators have suggested a key role for TK1, but other than preliminary work reported by our research group, this has not yet been demonstrated.
To interpret 18F-FLT images as measures of cell proliferation, we need to understand the mechanisms that account for its accumulation and retention in tissues. Our first step was to determine how well TK1 activity accounted for FLT uptake in cultured human cells under a variety of growth conditions ranging from active growth to growth arrest caused by radiation or by nutrient deprivation. Radiation was a particularly useful tool for these studies because it causes a dose-dependent delay in progression through the cell cycle of all mammalian cells, provided they retain, as do A549 lung carcinoma cells, a functional p53 tumor suppressor gene and the associated normal cell cycle checkpoints (26). However, this delaying effect of radiation can be eliminated by selected genetic manipulations that abrogate function of the p53 tumor suppressor gene (27). These manipulations of p53 function mimic changes occurring in some cells as they progress to malignancy and were a convenient additional way to investigate the link between cell growth, FLT uptake, and TK1 activity.
In this article, we report a strong positive correlation between uptake of radiolabeled FLT and levels of TK1 in A549 lung carcinoma cells in vitro. We also demonstrate that converting cells from growth arrest to a high growth rate consistently leads to elevated TK1 levels, accompanied by increased FLT uptake. Taken together, these data validate 18F-FLT as a useful imaging agent for cell proliferation.
MATERIALS AND METHODS
Radiolabeled Drugs
3H-FLT (229.4 GBq/mmol) was purchased from Moravek Biochemicals Inc. (Brea, CA) in a 1:1 solution of ethanol:water and stored at −20°C. 3H-Thymidine (TdR, 2,590–3,330 GBq/mmol) was purchased from New England Nuclear (Boston, MA) in an aqueous solution and stored at −20°C. 14C-Deoxyglucose (DG, 1,850–2,220 GBq/mmol) was purchased from Amersham (Buckinghamshire, U.K.) in a 3% ethanol solution and stored at −20°C.
Cell Culture Systems
A549 human lung adenocarcinoma cells were used for these studies and also as the parental cell line to construct isogenic cell lines that differ in p53 gene expression. The parent A549 cell line has wild-type p53 gene function (28). A549 cells were transduced with the retrovirus vector LXSN, which contains a selectable gene for resistance to neomycin, to introduce the human papillomavirus (HPV) type 16 E6 gene, as described previously (27), and were designated A549-E6. Controls, designated A549-LXSN, received vector only. Cells expressing E6 (A549-E6) have a functionally inactive p53 gene product and lose the G1 checkpoint control necessary for radiation-induced cell cycle arrest (27). Cells containing the vector alone (A549-LXSN) retain their p53-dependent G1 cell cycle checkpoint response. The parental cell line (A549), as well as A549-E6 and A549-LXSN, was used to examine uptake and retention of 3H-FLT and to determine thymidine kinase (TK) activity.
Cells were grown in 1:1 Dulbecco’s modified Eagle’s medium:F-12 containing 10% heat-inactivated fetal bovine serum, 100 U/mL penicillin, and 0.1 mg/mL streptomycin and were incubated at 37°C in an atmosphere of 95% air and 5% CO2. Cells were seeded at 2 × 10⁵ cells in T25 flasks and grown for 6–8 d with no change of culture medium to reach an unfed plateau phase. Then, either the cells were released and reseeded into fresh medium at 2–3 × 10⁶ cells per flask to reach exponential growth at the times specified for treatment, or else the cells were treated in this plateau phase.
For determining uptake of labeled FLT or DG under various conditions, culture dishes were removed from the incubator, growth medium was aspirated, and 1 mL of medium, containing 37 kBq/mL 3H-FLT or 18.5 kBq/mL 14C-DG, was used to rinse the culture medium from the monolayer of cells. Cells were incubated with 3 mL of medium containing 3H-FLT or 14C-DG. Alcohol carryover from 3H-FLT stock solution was negligible (0.05%). Cells were labeled 6, 10, 12, 14, 16, and 24 h after subculturing into fresh medium and were compared with cells labeled without being subcultured (referred to as 0-h samples).
At each of these times in each experiment, 3 replicate samples were taken. Each point in Figures 1–4 is an average of these 3 samples. Radiolabeled drug was taken up by incubation for 1 h at 37°C in a humidified atmosphere containing 5% CO2.

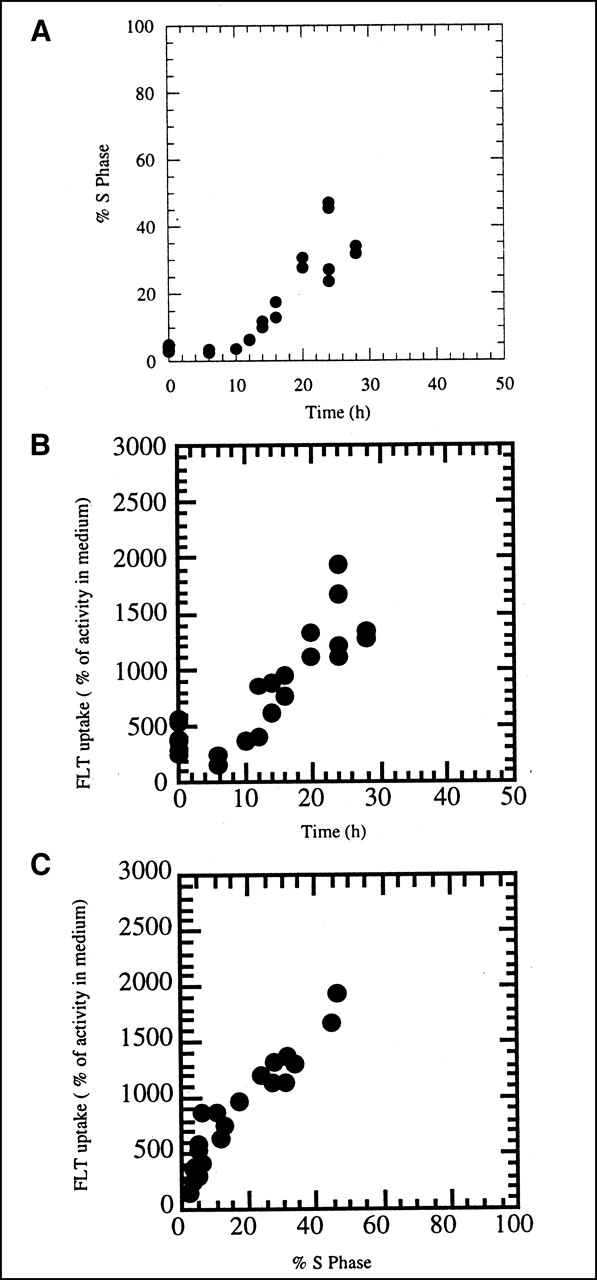
(A) Changes in S phase fraction as function of time after subculturing of growth-arrested A549 cells into fresh culture medium. (B) Uptake of 3H-FLT in A549 cells as function of time after 8-d-old growth-arrested cells were subcultured into fresh growth medium. FLT uptake is expressed relative to activity levels in culture medium. Uptake equal to 100% represents equilibration between cells and medium, whereas higher values mean that cells have concentrated tracer. (C) Uptake of 3H-FLT in A549 cells versus percentage in S phase.
Cells were harvested at the end of the 1-h incubation by trypsin treatment and were rinsed twice in fresh culture medium to remove unbound label. A proportion of the total sample was counted in a model 1900CA liquid scintillation spectrophotometer (Packard BioScience Co., Meriden, CT) in 10 mL of Ultima Gold (Packard BioScience). Uptake was calculated as disintegrations per minute for liquid scintillation data.
Cell Sizing and Calculation of Radiotracer Uptake
To determine cell size, dishes identical to the treated dishes, but without added radiotracer, were harvested by trypsin treatment at 1 and 8 d. This parallel procedure was necessary because radioactive cells could not be introduced into the cell counter or, later, into the flow cytometer used to determine S phase. Cells were suspended in Isotone (Coulter Corp., Luton, U.K.) at a concentration of between 2,000 and 5,000 cells per milliliter. Cell size was determined by methods adapted from the Coulter ZM reference manual, Fine Particle Calibration, using Coulter size standards as calibration standards. Volume for cells was determined using the formula 4/3π r3 = volume.
Cell sizing allowed us to calculate tracer uptake in cells relative to activity in culture medium. We first calculated the intracellular volume of 106 cells. We then determined dpm/ 106 cells and expressed the cellular uptake as a percentage of radioactivity in the same volume of medium. Uptake equal to 100% would represent simple equilibration with the medium, and values > 100% meant that the cells concentrated radioactivity to a level greater than that in the medium. This method of calculating uptake readily allows one to determine when uptake exceeds activity levels in the medium and thus represents concentration of the tracer. This method also corrects for the unavoidable variations in dpm/mL of medium that occur in pipetting very small aliquots of high-specific-activity stock solutions of 3H-FLT. Radioactivity in aliquots of high-specific-activity stock solution varied more than did cell size. Volumes of 1-d-old A549, A549-E6, and A549-LXSN cells differed from each other by ±8%. Volumes of 8-d-old A549, A549-E6, and A549-LXSN cells differed by ±14%. On average, 8-d-old cells had 65% of the volume of 1-d-old cells.
Irradiation Conditions
For determining the effects of radiation on TK activity and the uptake of FLT in A549 cells with and without normal p53 function, A549-E6 and A549-LXSN cells were allowed to reach an unfed plateau phase of growth, were removed from the incubator, and were irradiated (81-14 cesium irradiator; Shepard, Glendale, CA). A dose of 10 Gy was delivered using a source-to-dish distance of 46 cm and a dose rate of 1 Gy/min. Cells either were immediately harvested by trypsin treatment and seeded into fresh medium to reach exponential growth at the times specified for addition of radioactive tracers or else were labeled in this plateau phase.
Flow Cytometry Methods
For determining cell cycle distributions, dishes identical to the treated dishes, but without added radioactivity, were harvested by trypsin treatment and were suspended in 10 mg/mL 4′-6-diamidino-2-phenylindole (DAPI) with 10% dimethylsulfoxide and cryopreserved at −70°C. (As noted above, radioactive cells could not be introduced into the flow cytometer.) Samples were analyzed on an Epics Elite flow cytometer (Coulter Corp.) with ultraviolet excitation at 360 nm from an Innova-90-6 water-cooled argon-ion laser (Coherent Inc., Santa Clara, CA). DAPI fluorescence was collected with a 450-nm/35-nm band-pass emission filter. A minimum of 20,000 cells was analyzed per sample. The data were collected using Elite software (version 4.01; Coulter Corp.). The Multicycle-AV software package (Phoenix Flow Systems, San Diego, CA) was used for data analysis.
TK Assay
For determining TK1 activity, dishes of cells identical to the treated dishes, but without added radioactivity, were harvested by trypsin treatment. Cells were counted on a ZM analyzer (Coulter Corp.) and lysed by a method adapted from Sherley and Kelly (21). Protein content in the 100,000g supernate of the cell lysate was determined using a detergent-compatible protein assay (Bio-Rad Laboratories Inc., Hercules, CA). The high-speed supernate was prepared to eliminate mitochondria, the source of TK2. TK activity in the high-speed supernate was determined using a method adapted from Hruby and Ball (29). Briefly, high-specific-activity TdR (2,590–3,330 GBq/mmol) was provided in a reaction mixture consisting of Na2HPO4/ NaH2PO4 buffer, pH 6.0, supplemented with disodium adenosine triphosphate and magnesium acetate. TK, provided by the cell supernate, phosphorylated the TdR to thymidine monophosphate. This phosphorylated product was captured on cellulose paper disks. Nonphosphorylated TdR was rinsed from the filters, which were then dried and counted in a 1900CA liquid scintillation spectrophotometer in 5 mL of Ultima Gold. TK1 activity was expressed as picomoles of phosphorylated TdR/30 min/mg of protein in the supernate.
RESULTS
Parental A549 Cells
A549 human lung carcinoma cells were grown for 8 d with no change of culture medium, at which point they were crowded and slowly proliferating (identified as plateau phase). We then subcultured cells at low density into fresh growth medium to follow their semisynchronous movement into active cell growth. At various times after subculturing of cells into fresh medium, we determined the uptake of radiolabeled FLT after a 1-h pulse. We compared this to the percentage of cells synthesizing DNA (S phase fraction) and the activity of cytosolic TK1.
A549 cells became highly growth arrested after 8 d with no medium change. The percentage of cells in S phase typically ranged from 3% to 5%, whereas 91%–94% of the cells had a G1 DNA content. Cells began to move into S phase by 12 h and reached a maximum of 54% ± 11% by 24 h after subculturing (Fig. 1A). FLT uptake also increased steadily at times later than 6 h and by 24 h reached nearly 4-fold the levels in growth-arrested cells (Fig. 1B). FLT uptake correlated well (r2 = 0.91) with the increase in the percentage of cells in S phase (Fig. 1C). For these comparisons, FLT uptake per 106 cells was expressed relative to the activity in the culture medium containing 3H-FLT, as described in the Materials and Methods.
Levels of the cell cycle-regulated enzyme TK1 were hypothesized to determine FLT retention in cells, and so we also measured TK1 activity in A549 cells as a function of time after subculturing. TK1 activity averaged 124 pmol phosphorylated TdR/30 min/mg of protein in growth-arrested cells. The first obvious increase occurred after 10 h in fresh medium and reached a maximum by 24 h, averaging 1,875 ± 235 pmol phosphorylated TdR/30 min/mg of protein, a 15-fold increase compared with growth-arrested cells (Fig. 2A). Interestingly, the increase in enzyme activity at 10 h preceded any obvious upswing in S phase fraction, which did not occur until 12–14 h. FLT uptake and TK1 activity correlated well (r2 = 0.63; Fig. 2B).
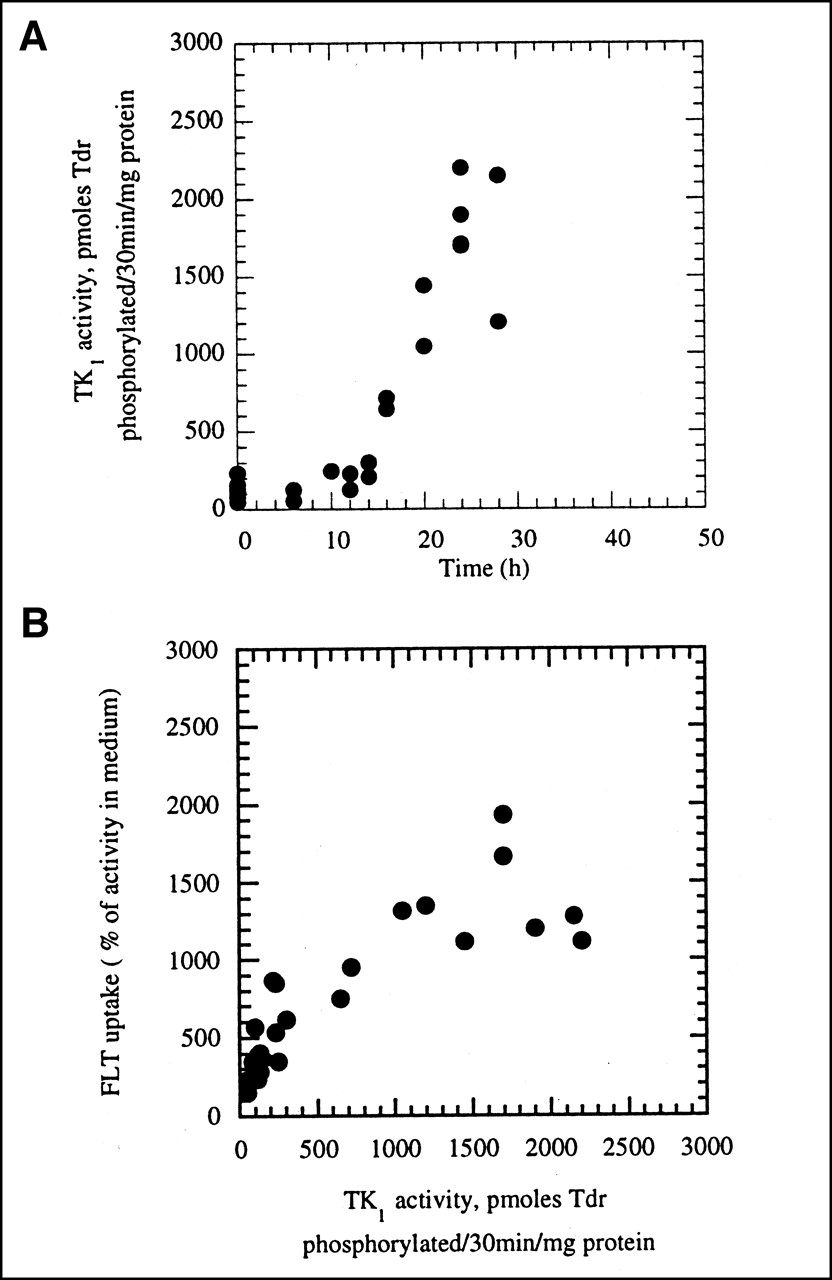
(A) TK1 activity in A549 cells as function of time. TK1 activity units are picomoles of phosphorylated TdR/30 min/mg of protein, as determined in cell-free enzymatic assay using A549 cell lysate as source of enzyme. (B) Uptake of 3H-FLT in A549 cells versus TK1 activity.
A549 Cells with Altered Expression of p53
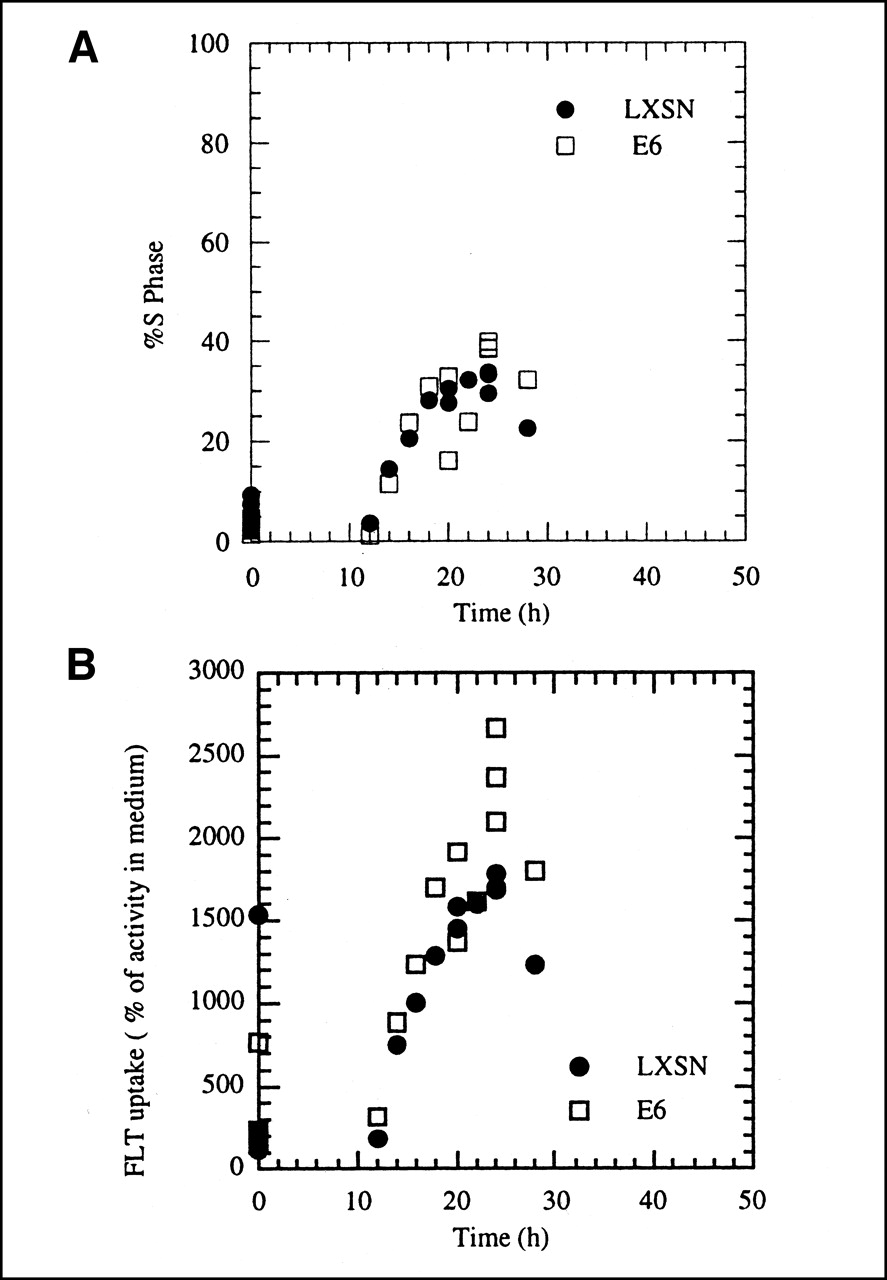
A549 cells, transfected with the gene for HPV type 16 E6 protein that abrogates p53 function (designated A549-E6), were compared with cells transfected with vector only (A549-LXSN). A549 cells contain wild-type p53, have a normal G1 checkpoint response, and are delayed in the cell cycle by radiation (27). Transfection with the gene for the E6 protein eliminates radiation-induced G1 delay because the cells lack normal p53 function. We first compared nonirradiated A549-LXSN and A549-E6 by subculturing 8-d-old plateau-phase culture into fresh medium and measuring changes in S phase fraction, FLT uptake, and TK1 enzyme activity over the next 28 h. We observed changes similar to those in parental A549 cells: an increase in S phase fraction by 12 h and maximum values at 24 h, followed by a decline as cells moved semisynchronously from S phase into G2/M (Fig. 3A). The uptake of FLT versus time was similar for nonirradiated A549-LXSN and A549-E6 (Fig. 3B), although the values tended to be higher in the E6-transfected cells, particularly at times between 16 and 24 h. When the vector-only and E6-transfected cells were compared with parental A549, FLT uptake tended to be slightly higher in both transfected cell lines, when uptake was expressed relative to activity in the culture medium (compare Figs. 1B and 3B). For nonirradiated A549-E6 and A549-LXSN, the correlation between FLT uptake and the percentage of cells in S phase (r2 = 0.77 for A549-LXSN; r2 = 0.94 for A549-E6) was better than the correlation between FLT uptake and TK1 activity (r2 = 0.45 for A549-LXSN; r2 = 0. 86 for A549-E6).

(A) Changes in S phase fraction versus time after subculturing of growth-arrested A549-LXSN and A549-E6 cells. (B) Uptake of 3H-FLT in A549-E6 and A549-LXSN cells as function of time after 8-d-old growth-arrested cells were subcultured into fresh growth medium. FLT uptake is expressed relative to activity levels in culture medium. Uptake equal to 100% represents equilibration between cells and medium, whereas higher values mean that cells have concentrated tracer.
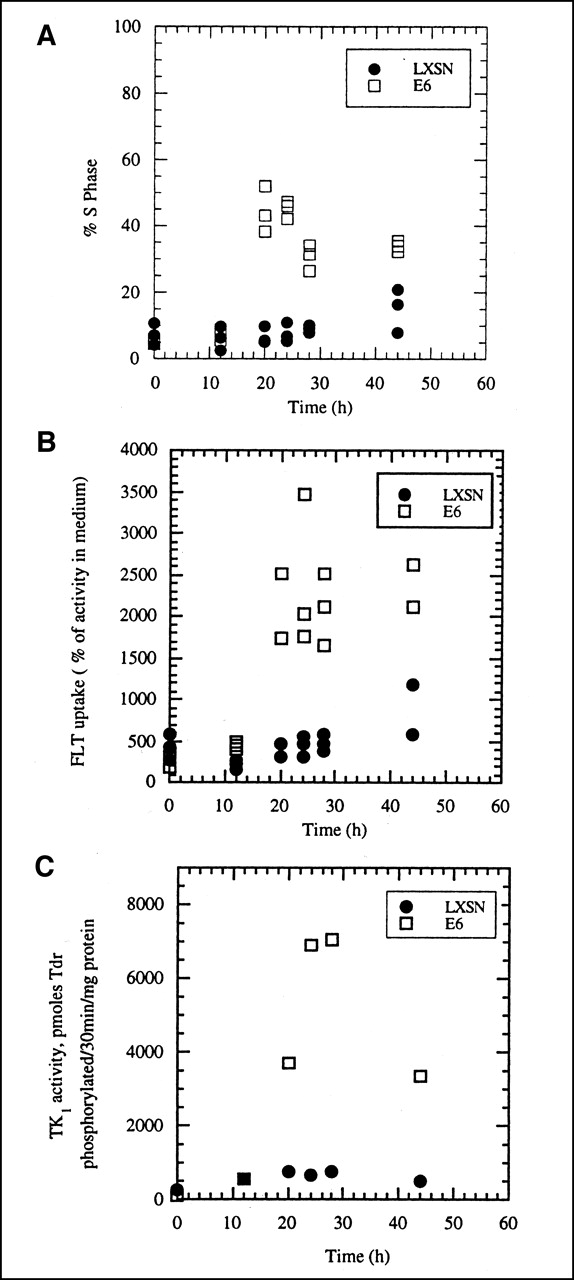
When 8-d-old, growth-arrested cultures of A549-E6 and A549-LXSN were irradiated with 10 Gy 137Cs γ-rays immediately before being subcultured into fresh medium, the expected delay of cells moving into S phase was seen in the vector-only (LXSN) transfected cells (Fig. 4A). However, the E6 transfectants were not delayed by radiation and entered the cell cycle, with S phase fractions increasing from 3% to 5% in the growth-arrested cells to 40%–50% within 20–24 h after subculturing (Fig. 4A). Only after 44 h did the S phase fraction began to increase in irradiated LXSN controls with normal p53 function.

(A) Effect of 10-Gy γ-radiation on movement of growth-arrested A549-E6 and A549-LXSN cells into S phase of cell cycle when subcultured into fresh growth medium. Irradiated LXSN cells do not enter cell cycle during first 24 h after being placed into fresh medium. E6-transfected cells, lacking functional p53, begin to enter S phase by 12 h. (B) Uptake of 3H-FLT into irradiated A549-E6 and A549-LXSN cells as function of time after 8-d-old growth-arrested cells were subcultured into fresh growth medium. Cells were irradiated with 10-Gy 137Cs γ-rays immediately before being placed into fresh medium. FLT uptake is expressed relative to activity levels in culture medium, with 100% uptake representing equilibration between cells and medium. Irradiated LXSN cells do not show increased uptake of FLT during first 24 h, consistent with their failure to move into cell cycle (A). (C) TK1 activity in irradiated A549-E6 and A549-LXSN cells as function of time after growth-arrested cells were subcultured into fresh growth medium. Cells were irradiated with 10-Gy 137Cs γ-rays immediately before being placed into fresh medium. TK1 activity does not increase in growth-arrested, irradiated LXSN cells.
The time course of increase in FLT uptake (Fig. 4B) paralleled that of increase in S phase fraction in irradiated A549-E6 cells. FLT uptake showed essentially no change between 0 and 28 h in A549-LXSN cells, which remained growth arrested because of the radiation treatment. The failure of irradiated A549-LXSN cells to begin cycling or take up more FLT after subculturing into fresh medium was, as expected, accompanied by unchanged TK1 activity, which remained at the low levels characteristic of growth-arrested cells (Fig. 4C). In the radiation-resistant A549-E6 cells, the highest TK1 activities were seen 28 h after irradiation and subculturing (Fig. 4C). The difference in TK1 activity between A549-E6 and A549-LXSN cells at 28 h (9.2-fold) was even greater than predicted by the greater FLT uptake in the E6 transfectants compared with vector-only LXSN controls (4.3-fold).
Comparison of 3H-FLT and 14C-DG
We also are interested in how FLT compares with 18F-FDG for monitoring changes in cell proliferation. Labeled FLT detects changes in proliferation that are underreported by the glucose metabolism tracer 14C-DG, a surrogate for 18F-FDG (Table 1). This experiment was similar to those described above for A549 cells, except that 6-d-old rather than 8-d-old growth-arrested cultures were used. Parallel series of cultures were labeled with 14C-DG for comparison with 3H-FLT. Placing growth-arrested A549 cells into fresh medium increased DG uptake no more than 1.8 times, far less than the increase seen in FLT uptake (6.4 times) when a large portion of cells move into S phase at 20 h.
Comparison of Uptake of 3H-FLT and 14C-DG in Growth-Arrested Cells and in Cells Subcultured in Fresh Medium for 6 or 20 Hours
DISCUSSION
Our efforts to characterize 18F-FLT for imaging tumor cell proliferation were preceded by efforts of many other investigators to quantify tumor growth with PET. For a review, see the article by Leskinen-Kallio (4). Several PET centers are imaging cell proliferation with the DNA precursor 11C-thymidine, but interpretation of images is challenging. Labeled metabolites of thymidine must be accounted for by rapid high-performance liquid chromatography of plasma, and investigators must apply mathematic models to interpret the images (5,7).
The imaging research group at the University of Washington has pioneered development of 18F-FLT for imaging cell proliferation. FLT, structurally similar to the anti-AIDS drug azidothymidine, is believed to be retained in virus-free cells because of specific phosphorylation by the cell cycle-regulated enzyme, cytosolic TK1 (15,18). This enzyme normally functions in the nucleoside salvage pathway to convert thymidine to thymidine monophosphate, a necessary first step before its incorporation into DNA. FLT is a poor substrate for mitochondrial TK2 (18), making it a specific marker for cells that express high levels of TK1, even though only a small amount of FLT is incorporated into DNA (15). Thus, the metabolic trapping of 18F-FLT by phosphorylation with little further processing has been hypothesized as analogous to the trapping of 18F-FDG that is due to phosphorylation by hexokinase.
The correlation of TK1 enzyme activity with cell proliferation and cell cycle stage is well established for both nonmalignant cells and tumor cells (21). TK enzyme activity is typically low in the G0/ G1 stage of the cell cycle, increases in S phase, and in some cells also remains high through mitosis. Activity drops sharply as cells reenter G1 phase after cell division (21). Serum levels of TK, presumably released by cell lysis accompanying tumor expansion, have been used as a marker of tumor burden, tumor aggressiveness, or prognosis in patients with leukemias and lymphomas and selected solid tumors including those of the breast and prostate (30–34). Correlations of prognosis with cytosolic TK1 measured in tumor samples also have been reported (35). These observations, coupled with data showing that FLT is a far better substrate for TK1 than for TK2, suggested that FLT might be a specific tracer of proliferation with a defined mechanism of trapping in cells.
The results reported in this article support the hypothesis that TK1 activity is an important determinant of FLT uptake and retention in cells. We studied A549 lung carcinoma cells because they become markedly growth arrested (only 3%–5% of cells in DNA synthesis) when they reach a high density in culture with no medium change. These growth-arrested cells move semisynchronously into the cell cycle when subcultured into fresh medium, with the maximum percentage of the cells in DNA synthesis (S phase) at 24 h (54% ± 11%). Comparing the changes in the percentage of cells in S phase and in 3H-FLT uptake as a function of time after subculturing (Fig. 1) confirmed a close association between these 2 measurements but also showed that FLT uptake increased by 10 h, before the increase in the proportion of cells in DNA synthesis. This relationship, in which FLT uptake precedes cell cycle progression, would be expected if FLT uptake depended on activation of TK1, as the activity of this enzyme begins to increase before S phase, in late G1 (21). The time course of changes in TK1 activity (Fig. 2A) also demonstrated increased activity just before cells began to move into S phase (Fig. 1A). Overall, FLT uptake correlated well with TK1 activity (r2 = 0.63), as shown in Figure 2B, and also with S phase (r2 = 0.91; Fig. 1C).
A more rigorous test of the relationship between cell cycle progression, FLT uptake, and expression of TK1 activity came from the experiments in which we prevented the normal movement of growth-arrested A549 cells into active growth by irradiating them just before subculturing. A549 cells have normal p53 function (28), a condition necessary for radiation-induced growth arrest in the G1 phase of the cell cycle. We also examined the effect of abrogating p53 function in A549 cells by stably transfecting them with HPV type 16 protein E6, a manipulation shown to eliminate postradiation G1 arrest in this lung carcinoma cell line (27). Nonirradiated, growth-arrested control (A549-LXSN) and E6-transfected (A549-E6) cells behaved similarly to parental A549 cells when subcultured into fresh medium; that is, they showed increases in S phase fraction, FLT uptake, and TK1 activity as a function of time (Fig. 3). Radiation produced the expected growth delay in vector-only control cells (A549-LXSN) having normal p53 function, that is, no increase in S phase fraction up to 24 h after subculturing (Fig. 4A). This failure to proliferate was accompanied by sustained low levels of FLT uptake and TK1 activity, characteristic of growth-arrested cells (Fig. 4). The expected increase in all 3 parameters was seen in the E6 transfectants when placed into fresh medium (Fig. 4); these cells escape the radiation-induced G1 block in the cell cycle because they lack normal p53 surveillance mechanisms.
Rapid growth is a hallmark of aggressive tumors, but high TK1 levels may be associated with other facets of tumor aggressiveness. The inherent high mutation rate in tumor cells and the complex control of TK1 activity (20,21) suggest that in more aggressive tumors, TK1 levels may not be tightly coupled with cell cycle stage. Thus TK1-dependent FLT uptake may report tumor aggressiveness as well as cell proliferation. For example, mutated tumor cells may express TK1 in the G0/ G1 stage of the cell cycle when enzyme activity normally is low (36) and overexpression of TK1 mRNA (37) eliminates cell cycle-specific regulation of TK1 activity. In addition, the postmitotic degradation of TK1 protein, implicated in the rapid decline of enzyme activity in G1 immediately after cell division, can be eliminated by mutations affecting the final 40 amino acids of the enzyme chain without eliminating enzyme function (38). Finally, TK1 activity may be up to 5 times higher in actively growing tumor cells than in exponentially growing nontransformed cells (39).
18F-FDG has been more widely used than any other PET tracer, and so it is logical that researchers would investigate how well it correlates with tumor growth or reports changes in cell proliferation. Work with animal tumors and cultured cells suggested that labeled thymidine is a better indicator of cell proliferation. Nonetheless, 18F-FDG uptake is strongly correlated with number of viable cells (40). Our comparisons of 14C-DG, a surrogate for 18F-FDG, with 3H-FLT support the hypothesis that specific tracers of the DNA synthetic pathway such as 11C-TdR, 18F-FMAU, and 3H- or 18F-FLT give a more accurate picture of the time course of changes in cell proliferation or response to cytotoxic agents than do glucose analogs.
CONCLUSION
Radiolabeled FLT is a tracer of cell proliferation with an identified mechanism of cell trapping and little catabolic metabolism to labeled metabolites of small molecular weight. Much of FLT concentration in cells can be explained by the activity of the proliferation-dependent enzyme TK. However, other factors, such as transporter mechanisms for thymidine analogs, need to be considered. Further studies with experimental tumors in vivo and consideration of the role of nucleoside transporters in sequestration of FLT are needed to validate 18F-FLT as a reliable tracer of tumor growth rate in humans.
Acknowledgments
This study was supported by research grant R01 CA34570-17 from the National Cancer Institute, National Institutes of Health.
Footnotes
Received Nov. 13, 2001; revision accepted May 21, 2002.
For correspondence or reprints contact: Janet S. Rasey, PhD, Radiation Oncology, University of Washington, Box 356043, Seattle, WA 98195.
E-mail: rasey{at}u.washington.edu
REFERENCES
In this issue


Jump to section
Related Articles
Cited By...
- Metabolic Phenotypes, Dependencies, and Adaptation in Lung Cancer
- Streptococcus pneumoniae Binds to Host Lactate Dehydrogenase via PspA and PspC To Enhance Virulence
- 17-Allylamino-17-demethoxygeldanamycin-induced Changes in [18F]Fluorothymidine Uptake
- Prognostic Value of 18F-FLT PET in Patients with Neuroendocrine Neoplasms: A Prospective Head-to-Head Comparison with 18F-FDG PET and Ki-67 in 100 Patients
- Single-Cell Characterization of 18F-FLT Uptake with Radioluminescence Microscopy
- The Use of Novel PET Tracers to Image Breast Cancer Biologic Processes Such as Proliferation, DNA Damage and Repair, and Angiogenesis
- Mapping Radiation Injury and Recovery in Bone Marrow Using 18F-FLT PET/CT and USPIO MRI in a Rat Model
- Multimodality Brain Tumor Imaging: MR Imaging, PET, and PET/MR Imaging
- PET Imaging During Radiotherapy of Head and Neck Cancer
- 18F-FLT PET During Radiotherapy or Chemoradiotherapy in Head and Neck Squamous Cell Carcinoma Is an Early Predictor of Outcome
- 3'-Deoxy-3'-18F-Fluorothymidine PET Predicts Response to V600EBRAF-Targeted Therapy in Preclinical Models of Colorectal Cancer
- Correlation of 18F-FLT Uptake with Tumor Grade and Ki-67 Immunohistochemistry in Patients with Newly Diagnosed and Recurrent Gliomas
- Usefulness of 3'-Deoxy-3'-18F-Fluorothymidine PET for Predicting Early Response to Chemoradiotherapy in Head and Neck Cancer
- PET Imaging of Tumor Growth: Not as Easy as It Looks
- [18F]FLT-PET Imaging Does Not Always "Light Up" Proliferating Tumor Cells
- 4'-[Methyl-11C]-Thiothymidine PET/CT for Proliferation Imaging in Non-Small Cell Lung Cancer
- Pharmacodynamic Study Using FLT PET/CT in Patients with Renal Cell Cancer and Other Solid Malignancies Treated with Sunitinib Malate
- Multimodality Assessment of Brain Tumors and Tumor Recurrence
- Tumor 3'-Deoxy-3'-18F-Fluorothymidine (18F-FLT) Uptake by PET Correlates with Thymidine Kinase 1 Expression: Static and Kinetic Analysis of 18F-FLT PET Studies in Lung Tumors
- Quantitative Analysis of Thymidine Kinase 1 and 5'(3')-Deoxyribonucleotidase mRNA Expression: The Role of Fluorothymidine Uptake
- The future of imaging: developing the tools for monitoring response to therapy in oncology: the 2009 Sir James MacKenzie Davidson Memorial lecture
- Different Modes of Transport for 3H-Thymidine, 3H-FLT, and 3H-FMAU in Proliferating and Nonproliferating Human Tumor Cells
- PET/CT with 18F-FLT: Does It Improve the Therapeutic Management of Metastatic Germ Cell Tumors?
- 18F-FLT PET/CT for Early Response Monitoring and Dose Escalation in Oropharyngeal Tumors
- Noninvasive Imaging of Endogenous Neural Stem Cell Mobilization In Vivo Using Positron Emission Tomography
- Histopathologic Validation of 3'-Deoxy-3'-18F-Fluorothymidine PET in Squamous Cell Carcinoma of the Oral Cavity
- Kinetic Analysis of 3'-Deoxy-3'-18F-Fluorothymidine (18F-FLT) in Head and Neck Cancer Patients Before and Early After Initiation of Chemoradiation Therapy
- PET Monitoring of Therapy Response in Head and Neck Squamous Cell Carcinoma
- Cytotoxicity of {sigma}-Receptor Ligands Is Associated with Major Changes of Cellular Metabolism and Complete Occupancy of the {sigma}-2 Subpopulation
- The Role of Human Nucleoside Transporters in Uptake of 3'-Deoxy-3'-fluorothymidine
- First Demonstration of Leukemia Imaging with the Proliferation Marker 18F-Fluorodeoxythymidine
- Noninvasive imaging of cell proliferation following mitogenic extracellular kinase inhibition by PD0325901
- Glioma Proliferation as Assessed by 3'-Fluoro-3'-Deoxy-L-Thymidine Positron Emission Tomography in Patients with Newly Diagnosed High-Grade Glioma
- 3'-Deoxy-3'-[18F]Fluorothymidine Positron Emission Tomography Is a Sensitive Method for Imaging the Response of BRAF-Dependent Tumors to MEK Inhibition
- Predicting Treatment Response of Malignant Gliomas to Bevacizumab and Irinotecan by Imaging Proliferation With [18F] Fluorothymidine Positron Emission Tomography: A Pilot Study
- Clinical Applications of PET in Brain Tumors
- Early Response Assessment Using 3'-Deoxy-3'-[18F]Fluorothymidine-Positron Emission Tomography in High-Grade Non-Hodgkin's Lymphoma
- Multimodality Molecular Imaging of Glioblastoma Growth Inhibition with Vasculature-Targeting Fusion Toxin VEGF121/rGel
- Molecular Imaging of Proliferation in Malignant Lymphoma.
- Early Response of {sigma}-Receptor Ligands and Metabolic PET Tracers to 3 Forms of Chemotherapy: An In Vitro Study in Glioma Cells
- In vivo Biological Activity of the Histone Deacetylase Inhibitor LAQ824 Is detectable with 3'-Deoxy-3'-[18F]Fluorothymidine Positron Emission Tomography
- Early Detection of Chemoradioresponse in Esophageal Carcinoma by 3'-Deoxy-3'-3H-Fluorothymidine Using Preclinical Tumor Models
- 18F-Fluoro-L-Thymidine and 11C-Methylmethionine as Markers of Increased Transport and Proliferation in Brain Tumors
- Quantification of Cellular Proliferation in Tumor and Normal Tissues of Patients with Breast Cancer by [18F]Fluorothymidine-Positron Emission Tomography Imaging: Evaluation of Analytical Methods
- Reproducibility of 3'-Deoxy-3'-18F-Fluorothymidine MicroPET Studies in Tumor Xenografts in Mice
- Imaging Proliferation in Brain Tumors with 18F-FLT PET: Comparison with 18F-FDG
- Early Detection of Tumor Response to Chemotherapy by 3'-Deoxy-3'-[18F]Fluorothymidine Positron Emission Tomography: The Effect of Cisplatin on a Fibrosarcoma Tumor Model In vivo
- Kinetic Modeling of 3'-Deoxy-3'-Fluorothymidine in Somatic Tumors: Mathematical Studies
- Kinetic Analysis of 3'-Deoxy-3'-Fluorothymidine PET Studies: Validation Studies in Patients with Lung Cancer
- Monitoring Antiproliferative Responses to Kinase Inhibitor Therapy in Mice with 3'-Deoxy-3'-18F-Fluorothymidine PET
- Selectivity of 18F-FLT and 18F-FDG for Differentiating Tumor from Inflammation in a Rodent Model
- Monitoring of Therapy in Androgen-Dependent Prostate Tumor Model by Measuring Tumor Proliferation
- Molecular Targeting with Radionuclides: State of the Science
- Oncological molecular imaging: nuclear medicine techniques
- Reply
- Monitoring Tumor Cell Proliferation by Targeting DNA Synthetic Processes with Thymidine and Thymidine Analogs
- In vivo imaging of cellular proliferation in colorectal cancer using positron emission tomography
- Imaging Proliferation in Lung Tumors with PET: 18F-FLT Versus 18F-FDG
- 18F-Fluorothymidine Radiation Dosimetry in Human PET Imaging Studies
- PET Imaging with 18F-FLT and Thymidine Analogs: Promise and Pitfalls
- 3'-Deoxy-3'-[18F]Fluorothymidine as a New Marker for Monitoring Tumor Response to Antiproliferative Therapy in Vivo with Positron Emission Tomography
- 3'-[18F]Fluoro-3'-Deoxythymidine ([18F]-FLT) as Positron Emission Tomography Tracer for Imaging Proliferation in a Murine B-Cell Lymphoma Model and in the Human Disease