


Abstract
Selective inhibition of oncogenic targets and associated signaling pathways forms the basis of personalized cancer medicine. The clinical success of V600EBRAF inhibition in melanoma, coupled with the emergence of acquired resistance, underscores the importance of rigorously validating quantitative biomarkers of treatment response in this and similar settings. Because constitutive activation of BRAF leads to proliferation in tumors, we explored 3′-deoxy-3′-18F-fluorothymidine (18F-FLT) PET to noninvasively quantify changes in tumor proliferation that are associated with pharmacologic inhibition of V600EBRAF downstream effectors and that precede changes in tumor volume. Methods: Human colorectal cancer (CRC) cell lines expressing V600EBRAF were used to explore relationships between upregulation of p27 and phosphorylation of BRAF downstream effectors on small-molecule V600EBRAF inhibitor exposure. Athymic nude mice bearing V600EBRAF-expressing human CRC cell line xenografts were treated with a small-molecule V600EBRAF inhibitor (or vehicle) daily for 10 d. Predictive 18F-FLT PET was conducted before changes in tumor volume occurred. Correlations were evaluated among PET, inhibition of phosphorylated MEK (p-MEK) and phosphorylated-ERK (p-ERK) by Western blot, tumor proliferation by histology, and small-molecule exposure by matrix-assisted laser desorption/ionization (MALDI) imaging mass spectrometry (IMS). Results: Treatment of CRC cell lines with PLX4720 reduced proliferation associated with target inhibition and upregulation of p27. In vivo, PLX4720 treatment reduced 18F-FLT uptake, but not 18F-FDG uptake, in Lim2405 xenografts before quantifiable differences in xenograft volume. Reduced 18F-FLT PET reflected a modest, yet significant, reduction of Ki67 immunoreactivity, inhibition of p-MEK and p-ERK, and elevated tumor cell p27 protein levels. Both 18F-FLT PET and 18F-FDG PET accurately reflected a lack of response in HT-29 xenografts, which MALDI imaging mass spectrometry suggested may have stemmed from limited PLX4720 exposure. Conclusion: We used preclinical models of CRC to demonstrate 18F-FLT PET as a sensitive predictor of response to V600EBRAF inhibitors. Because 18F-FLT PET predicted reduced proliferation associated with attenuation of BRAF downstream effectors, yet 18F-FDG PET did not, these data suggest that 18F-FLT PET may represent an alternative to 18F-FDG PET for quantifying clinical responses to BRAF inhibitors.
BRAF is the most frequently mutated protein kinase in human cancer (1). A variety of activating mutations in BRAF exist, though the V600E mutation, which substitutes glutamic acid for valine, is the most commonly observed (2). This mutation results in constitutive activation of BRAF and associated downstream effectors within the mitogen-activated protein kinase (MAPK) pathway (3). Tumor expression of V600EBRAF correlates with increased proliferation, aggressiveness, and poor prognosis (4,5). Furthermore, growth and proliferation of tumors that express V600EBRAF tend to depend on MAPK pathway activity, illustrating the attractiveness of pharmacologic inhibition of BRAF in these tumors (6). A majority of melanomas (7) and thyroid cancers (8) express V600EBRAF. Expression of mutant BRAF has been observed in other solid tumors, such as colon cancer (∼15%) (1,9). Recent studies have shown that inhibition of mutant BRAF with therapeutic small molecules (e.g., PLX4032) leads to reduced proliferation and tumor regression in melanoma (10,11). In this disease, reduced proliferation after PLX4032 stems from inhibition of BRAF effectors (e.g., phosphorylated MEK [p-MEK] and phosphorylated-ERK [p-ERK]) and upregulation of cell cycle inhibitors (e.g., p21, p27) (12,13).
The relationship between BRAF inhibition, reduced proliferation, and clinical response in V600EBRAF melanoma suggests that noninvasive imaging metrics of proliferation may represent promising biomarkers of efficacy in this setting. Analogously, recent studies have associated proliferation with acquired resistance to BRAF inhibitors in melanoma (14). Additionally, clinical results evaluating V600EBRAF inhibition in other solid tumors, such as colon cancer (15), have been less promising for reasons that may include resistance-mediated proliferation (16). The widely applied PET tracer 18F-FDG has been used to document clinical response to BRAF inhibition in melanoma (10,17), though tissue uptake of this tracer reflects a host of metabolic processes only tangentially related to proliferation. In contrast, PET with 3′-deoxy-3′-18F-fluorothymidine (18F-FLT) measures proliferation more directly by targeting thymidine salvage, which is related to DNA synthesis.
In this study, we used preclinical models of colorectal cancer (CRC) to demonstrate 18F-FLT PET as a sensitive predictor of response to V600EBRAF inhibitors. In a V600EBRAF-sensitive model, 18F-FLT PET predicted tumor growth arrest and reduced proliferation associated with attenuation of BRAF downstream effectors that was undetectable with 18F-FDG PET. In another model, 18F-FLT PET accurately reflected a lack of in vivo response that appeared to stem from limited drug exposure in tumor tissue. Our data suggest that 18F-FLT PET represents an alternative to 18F-FDG PET for quantifying clinical responses to BRAF inhibitors in V600EBRAF-expressing solid tumors.
MATERIALS AND METHODS
In Vitro Studies
HT-29 (HTB-38) human CRC cell lines were obtained from American Type Culture Collection, and Lim2405 cells were provided by Dr. Robert Whitehead, Ludwig Institute for Cancer Research. Cell lines were maintained as subconfluent monolayer cultures in 10-cm plates in a 95% humidity, 5% CO2, 37°C atmosphere in Dulbecco modified Eagle medium (Mediatech). Growth medium was supplemented with 10% fetal bovine serum (Atlanta Biologicals) and gentamycin sulfate (1 mg/mL; Gibco). PLX4720 was synthesized as previously described (18) and was prepared as a 10 mM stock solution in dimethyl sulfoxide and aliquoted to achieve final drug concentrations as noted.
Lim2405 and HT-29 cells were propagated to 50% confluency in 6-cm plates. Cells were treated with PLX4720 (0, 10, 250, 1,000, and 5,000 nM) for 24 h and prepared for flow cytometry as previously described (19). Propidium iodide–stained cells were analyzed by flow cytometry (FACStar PLUS; Becton-Dickinson). Data analysis was performed using CellQuest software (Becton-Dickinson) and manual gating to define and quantify sub-G0, G1, S, and G2/M populations.
In Vivo Studies
All studies involving animals were conducted in compliance with federal and institutional guidelines. Cell line xenografts were generated in 5- to 6-wk old female athymic nude mice (Sprague–Dawley; Harlan) after subcutaneous injection of 1 × 10⁷ cells into the right flank. Palpable tumors were detected within 2–3 wk after implantation. Experiments commenced once tumor volumes reached 150–200 mm3. For treatment, tumor-bearing mice were administered PLX4720 (60 mg/kg) or saline vehicle by oral gavage (total volume, 100 μL) daily. PET was conducted on day 3 for 18F-FDG, 16–20 h after the second PLX4720 dose, and on day 4 for 18F-FLT, 16–20 h after the third PLX4720 dose, before changes in volume occurred between vehicle-treated and PLX4720-treated tumors. For longitudinal volume assessment, xenograft-bearing mice received a single 60 mg/kg dose of PLX4720 for 10 consecutive days.
Radiopharmaceutical Synthesis
18F-FLT was prepared from 18F-fluoride in a 2-step, 1-pot reaction as previously described (19,20) using a TRACERlab FX-FN automated module (GE Healthcare). Aqueous 18F-fluoride was eluted with Kryptofix-222 (Sigma-Aldrich) and K2CO3 in CH3CN/H2O into the reaction vessel. Three sequences of heating (110°C) with He(g) flow resulted in dry 18F-fluoride/Kryptofix-222/K2CO3. The cyclic precursor 2,3′-anhydro-5′-O-benzoyl-2′-deoxythymidine (ABX Advanced Biochemical Compounds) was added in dimethyl sulfoxide and reacted for 10 min at 160°C. The benzoyl-protecting group was removed from the labeled intermediate by basic hydrolysis (0.25 M NaOH, 50°C, 10 min). The reaction mixture was purified on a semipreparative C-18 high-performance liquid chromatography column eluting with 10% ethanol/ 10 mM sodium phosphate buffer and sterilized by 0.2-μm membrane filtration. Radiochemical identity, purity, and specific activity were determined by analytic high-performance liquid chromatography. The 18F-FLT product was obtained with an average radiochemical purity of 98.3% and a specific activity of 345.5 TBq/mmol. 18F-FDG was synthesized in the Vanderbilt University Medical Center Radiopharmacy and distributed by PETNET. The average radiochemical purity of the product was 98.5%, and specific activity was more than 37 TBq/mmol.
Imaging
PET was performed using a dedicated small-animal PET scanner (Focus 220; Concorde Microsystems) as previously described (19). Briefly, the mice were maintained under 2% isoflurane anesthesia in 100% oxygen at 2 L/min and kept warm via a circulating water heating pad during the PET scan. For 18F-FLT, mice were administered 7.4–9.3 MBq intravenously and allowed free access to food and water during a 40-min uptake period followed by a 20-min PET acquisition. For 18F-FDG, they were kept fasting for approximately 6 h before imaging and warmed in a heated (31°C) chamber for 1 h before injection and during the uptake period to minimize brown fat uptake of 18F-FDG. Mice were administered 7.4–9.3 MBq of 18F-FDG intravenously and allowed free access to water during a 50-min uptake period followed by a 10-min PET acquisition.
High-resolution ultrasound measurement of xenograft volumes was conducted as previously described (21). Briefly, 3-dimensional ultrasound imaging datasets were collected for each xenograft using a Vevo 770 ultrasound microimaging system (VisualSonics). The mice were anesthetized using 2% isoflurane in oxygen and remained on a heated stage during the course of imaging. Xenografts were covered in warmed (37°C) Aquasonic 100 ultrasound gel (Parker Laboratories) and centered in the imaging plane. Three-dimensional B-mode data were acquired by automated translation of the 30-MHz ultrasound transducer along the entire length of the xenograft.
For PET, scans were reconstructed using maximum a posteriori 3-dimensional ordered-subset expectation maximization as previously described (22). The resulting 3-dimensional reconstructions had a voxel size of 0.474 mm in the x–y plane and a 0.796-mm interslice distance. ASIPro software (Siemens) was used to manually draw 3-dimensional regions of interest around the tumor volumes in the reconstructed images. 18F-FLT uptake was quantified and expressed as percentage injected dose per gram of tissue (%ID/g) by dividing the region-of-interest activity by the injected dose and multiplying by 100. For volumetric analysis of xenografts, ultrasound data were imported into Amira 5.2 (Visage Imaging). Tumors were manually segmented, and volume was determined by summation of the in-plane–segmented regions and multiplication by the interslice spacing.
Antibodies and Immunoblotting
In vitro cell samples were collected from 10-cm plates after 48 h of PLX4720 exposure. For immunoblotting, medium was removed and cell monolayers were washed with phosphate-buffered saline before the addition of 450 μL of lysis buffer (7 mL of CelLytic M lysis buffer [Sigma], mini protease inhibitor cocktail [Roche], 100 μL of phosphatase inhibitor cocktail 1 and 2 [Sigma]). Protein concentrations were normalized using a bicinchoninic acid assay. Frozen tumor samples were subsequently homogenized and diluted to 1 μg/μL in lysis buffer. All samples were stirred in a vortex mixer and centrifuged to collect the final cell lysate.
For Western blotting, 20–40 μg of protein were loaded into 7.5%–12% sodium dodecyl sulfate polyacrylamide gels and resolved by electrophoresis. Membranes were immunoblotted with antibodies to p-MEK1/2 (no. 9154S; Cell Signaling), total MEK (no. 9126; Cell Signaling), p-ERK1/2 (no. 4370S; Cell Signaling), total ERK (no. 4695; Cell Signaling), p27 (no. 3686S; Cell Signaling), and β-tubulin (no. NB600-936; Cell Signaling). The membranes were imaged on a Xenogen IVIS 200 using Western Lightning Plus-ECL (PerkinElmer) substrate.
Immunohistochemistry
Immediately after sacrifice, excised tumors were fixed in 10% formalin for 24 h and transferred to 70% ethanol. Samples were then blocked in paraffin and sectioned before immunostaining for Ki67 (M7240; Dako) and TK1 (ab57757; Abcam). Tissues were evaluated by an expert gastrointestinal pathologist. Stained samples were imaged at ×40 magnification and analyzed for expression of histologic markers. The index for each marker was expressed as the average number of positive cells per field based on counting at least 3 random fields per tumor section and 3 sections per condition.
Matrix-Assisted Laser Desorption/Ionization (MALDI) Imaging Mass Spectrometry (IMS)
Immediately after PET, xenograft-bearing mice were sacrificed, placed in 50-mL conical tubes containing deionized water, and subsequently frozen using dry ice. Transverse sections were prepared for MALDI IMS as described (23,24). Mass spectra were acquired in positive-ion mode using a MALDI LTQ XL linear ion trap mass spectrometer. An average of 15 laser shots per scan was used to produce a mass spectrum every 200 μm laterally across the tissue. Two-dimensional ion density images were extracted from raw data using ImageQuest (version 1.0.1; Thermo Scientific). False-color ion intensity maps were coregistered with white-light images to visualize drug concentration in the mouse tissues (23).
Statistics
The statistical significance of data was evaluated using the nonparametric Wilcoxon rank sum (Mann–Whitney U) tests in Prism 4 (GraphPad Software). Data were considered significant if the P value was less than 0.05.
RESULTS
In Vitro Sensitivity of CRC Cells to PLX4720
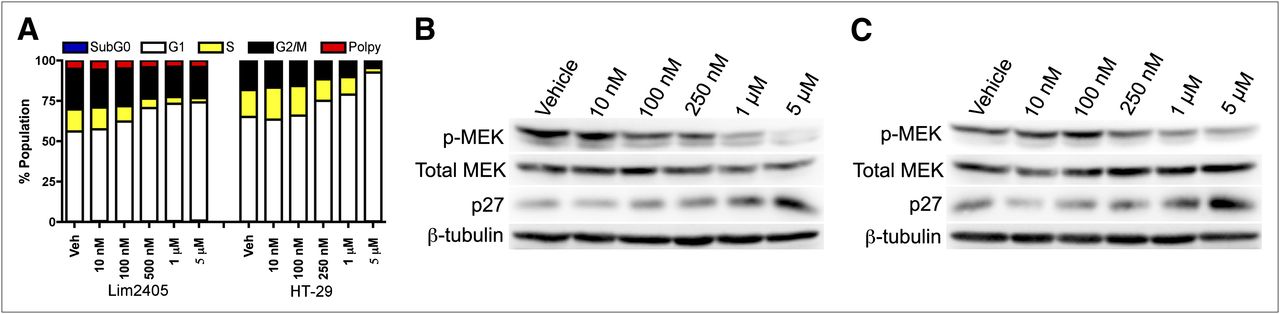
The V600EBRAF-expressing Lim2405 and HT-29 cell lines exhibited marked sensitivity to PLX4720, characterized primarily by concentration-dependent G1 arrest and decreased S-phase (Fig. 1A) as measured by propidium iodide flow cytometry. Other cell cycle phases were only modestly affected, suggesting that the primary effect of PLX4720 exposure in these cell lines was diminished DNA synthesis.

In vitro PLX4720 exposure decreases proliferation and leads to elevated p27 levels in human CRC cell lines harboring V600EBRAF. Lim2405 and HT-29 cells expressing V600EBRAF exhibited marked sensitivity to PLX4720. (A) Propidium iodide flow cytometry demonstrated concentration-dependent G1 arrest and decreased S-phase fractions. (B and C) Western blot analysis of lysates collected from HT-29 (B) and Lim2405 (C) cells after 48 h of in vitro PLX4720 exposure (0, 10 nM, 100 nM, 250 nM, 1 μM, and 5 μM) are shown. In both cell lines, p-MEK was inhibited at concentrations greater than 250 nM. Additionally, increased p27 protein expression was observed at PLX4720 concentrations greater than 250 nM.
Reasoning that 18F-FLT PET measures cellular proliferation in an S-phase–dependent manner, we used Lim2405 and HT-29 cells to explore the relationship between the inhibition of BRAF downstream effectors and cell cycle inhibitors. As expected, PLX4720 treatment resulted in reduced p-MEK by 50% or greater at concentrations of approximately 250 nM and above for both Lim2405 (Fig. 1B) and HT-29 (Fig. 1C). Levels of p27 were inversely related to p-MEK after PLX4720 exposure.
In Vivo Sensitivity of Lim2405 Xenografts to PLX4720
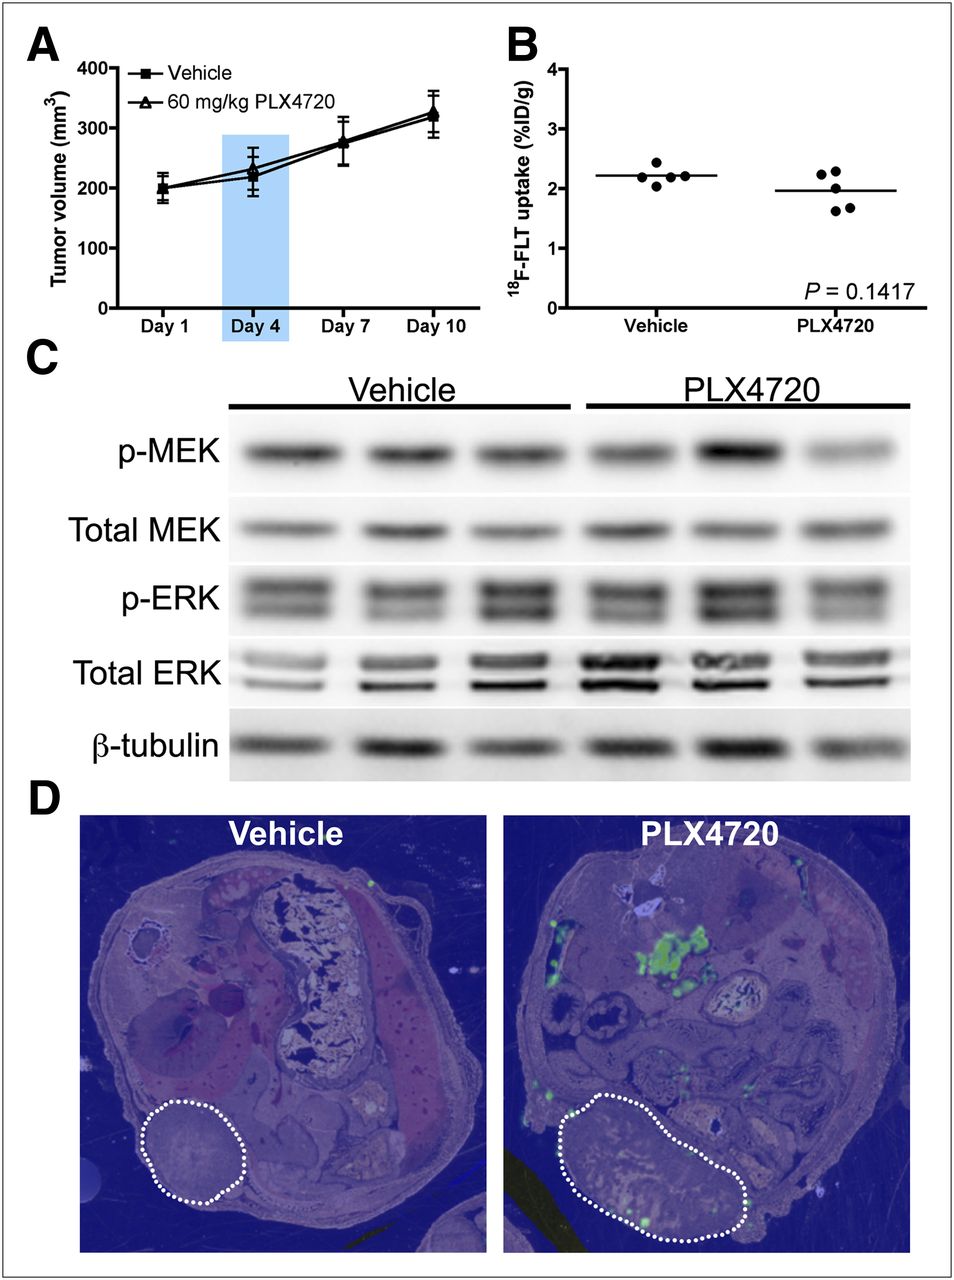
Mice bearing Lim2405 xenografts were used to evaluate early post-treatment 18F-FLT PET to predict changes in xenograft volume stemming from small-molecule BRAF inhibitor exposure. Mice were treated daily with PLX4720 over a 10-d treatment course. PLX4720 treatment resulted in significant growth arrest of Lim2405 xenografts that was detectable using high-resolution ultrasound imaging by day 7 (Fig. 2A). 18F-FLT PET of xenograft-bearing mice was conducted on day 4, when there was no quantifiable difference in xenograft volume between PLX4720-treated and vehicle-treated cohorts. We found 18F-FLT uptake to be significantly reduced in PLX4720-treated Lim2405 xenografts (9.9 ± 1.4 %ID/g, n = 5), compared with similar vehicle-treated controls (14.9 ± 1.5 %ID/g, n = 5) (Figs. 2B and 2C). Analogously, pre-treatment and post-treatment comparisons of individual mice showed a statistically significant decrease after PLX4720 exposure but not after vehicle exposure (Supplemental Fig. 1; supplemental materials are available online only at http://jnm.snmjournals.org). Unlike 18F-FLT PET, 18F-FDG PET was not significantly different between vehicle-treated and PLX4720-treated Lim2405 xenograft tumors (Supplemental Fig. 2). A subset of mice was immediately sacrificed after imaging for correlative analysis that included preparation of whole-animal transverse thin sections for MALDI IMS; this technique was used to evaluate relative PLX4720 tissue concentrations and the spatial distribution in Lim2405 xenograft–bearing mice at the time of imaging. Pseudocolor maps of the MALDI ion intensity corresponding to the parent molecular mass of PLX4720 confirmed the presence of unmetabolized drug in tumors and adjacent nontumor tissues such as the bowel. No background ion intensity was observed in vehicle-treated mice (Fig. 2D).

Reduced in vivo 18F-FLT PET precedes quantifiable, PLX4720-dependent differences in tumor volume and correlates with drug exposure in Lim2405 xenografts. Mice bearing Lim2405 xenografts were treated daily with PLX4720 or vehicle. (A) Over 10-d regimen, PLX4720 treatment induced significant xenograft growth arrest detectable by treatment day 7. 18F-FLT PET was performed on treatment day 4 when there was negligible difference in tumor volume between PLX4720-treated and vehicle-treated controls (blue box). (B) 18F-FLT PET was significantly lower in PLX4720-treated xenografts than in vehicle-treated controls. (C) Shown are representative transverse images of vehicle-treated and PLX4720-treated cohorts collected on treatment day 4 (xenograft denoted by arrowhead). Immediately after PET, mice were sacrificed, and thin, transverse sections of vehicle-treated and PLX4720-treated mice were prepared for MALDI IMS. (D) Pseudocolor maps of ion intensity corresponding to parent molecular mass of PLX4720 demonstrate minimal signal intensity in vehicle-treated animals. In contrast, treated animals demonstrated considerable PLX4720 ion intensity, with drug primarily localized to tumor tissue (dotted line). Other tissues exhibiting PLX4720 ion intensity included bowel, consistent with oral administration.
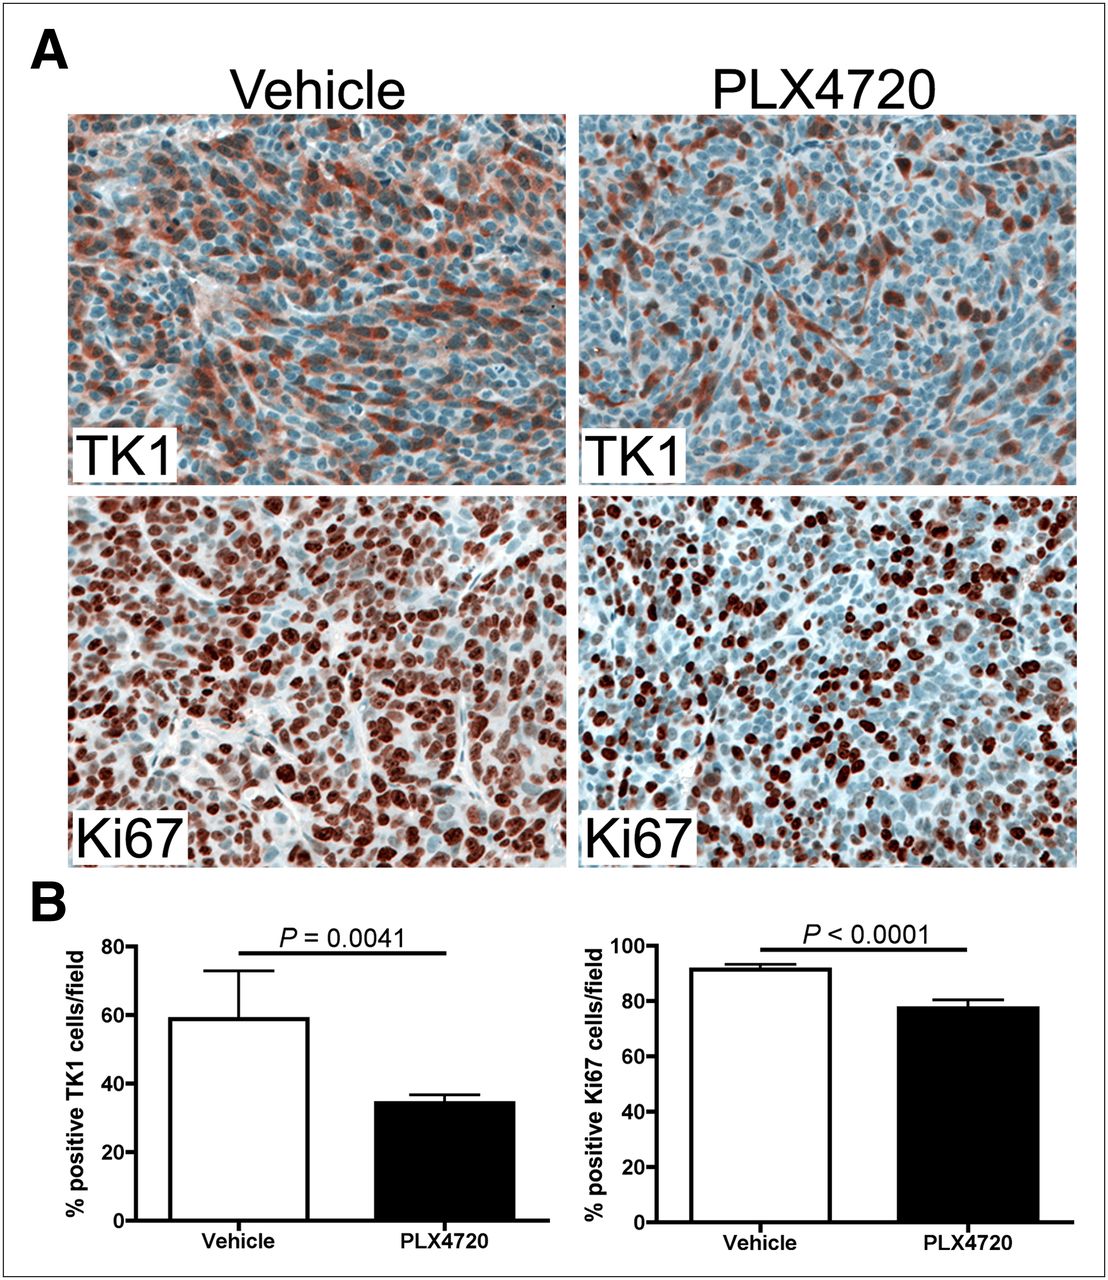
Western blot analysis of imaging-matched Lim2405 xenograft tissues harvested shortly after imaging on treatment day 4 illustrated that reduced 18F-FLT PET was associated with approximately 50% inhibition of p-MEK and p-ERK (Fig. 3) and an approximately 2-fold upregulation of p27 levels. Using immunohistochemistry, we observed a 25% reduction in TK1 positivity in PLX4720-treated Lim2405 xenografts, compared with vehicle-treated controls (Figs. 4A and 4B). Similarly, Ki67 immunoreactivity was also reduced in PLX4720-treated tumors (Figs. 4A and 4B), although to a lesser extent than observed for TK1.
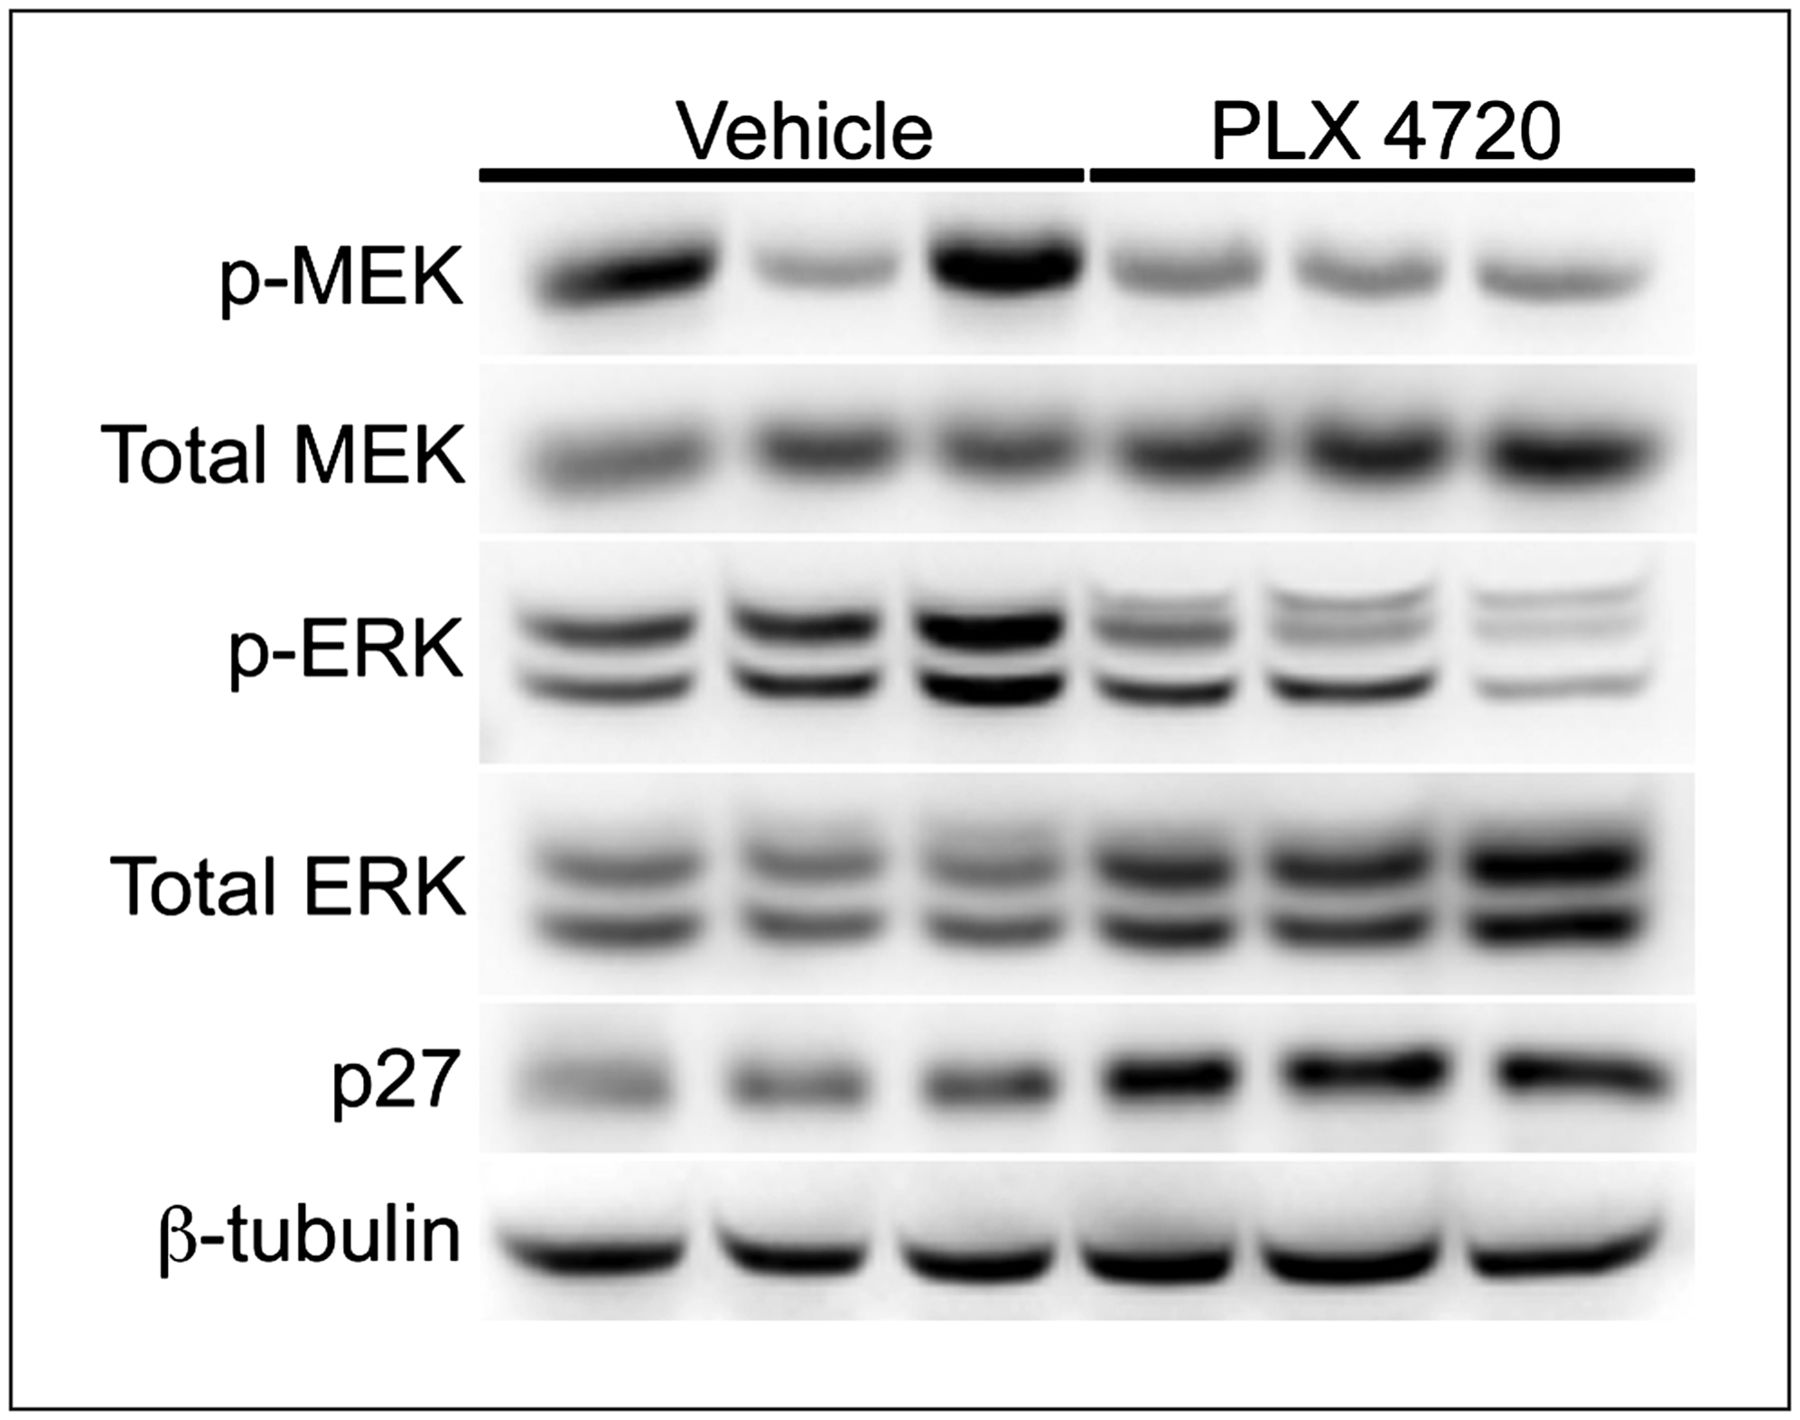
Early 18F-FLT PET predicts inhibition of BRAF downstream effectors and p27 upregulation, as shown by Western blot analysis quantifying BRAF effector molecules and p27 in 18F-FLT PET–matched Lim2405 xenografts (Fig. 2). Compared with vehicle controls, xenografts harvested from PLX4720-treated cohorts at treatment day 4 exhibited reduced levels of p-MEK and p-ERK and elevated levels of p27.

Early 18F-FLT PET agrees with tumor cell TK1 levels and Ki67 immunohistochemistry, as shown by immunohistochemistry analysis of 18F-FLT PET–matched Lim2045 xenografts (Fig. 2). (A) Representative TK1 and Ki67 immunohistochemistry images of xenografts harvested at treatment day 4 are shown for both vehicle-treated and PLX720-treated tumors. (B) PLX4720-treated xenografts exhibited approximately 25% fewer TK1-positive cells per field than vehicle controls (34.3% vs. 58.8%, P = 0.0041). Modest, though statistically significant (P < 0.0001), reduction in number of Ki67-positive cells per field was observed for PLX4720-treated xenografts, compared with vehicle controls (77.4% vs. 89.5%).
In Vivo Sensitivity of HT-29 Xenografts to PLX4720
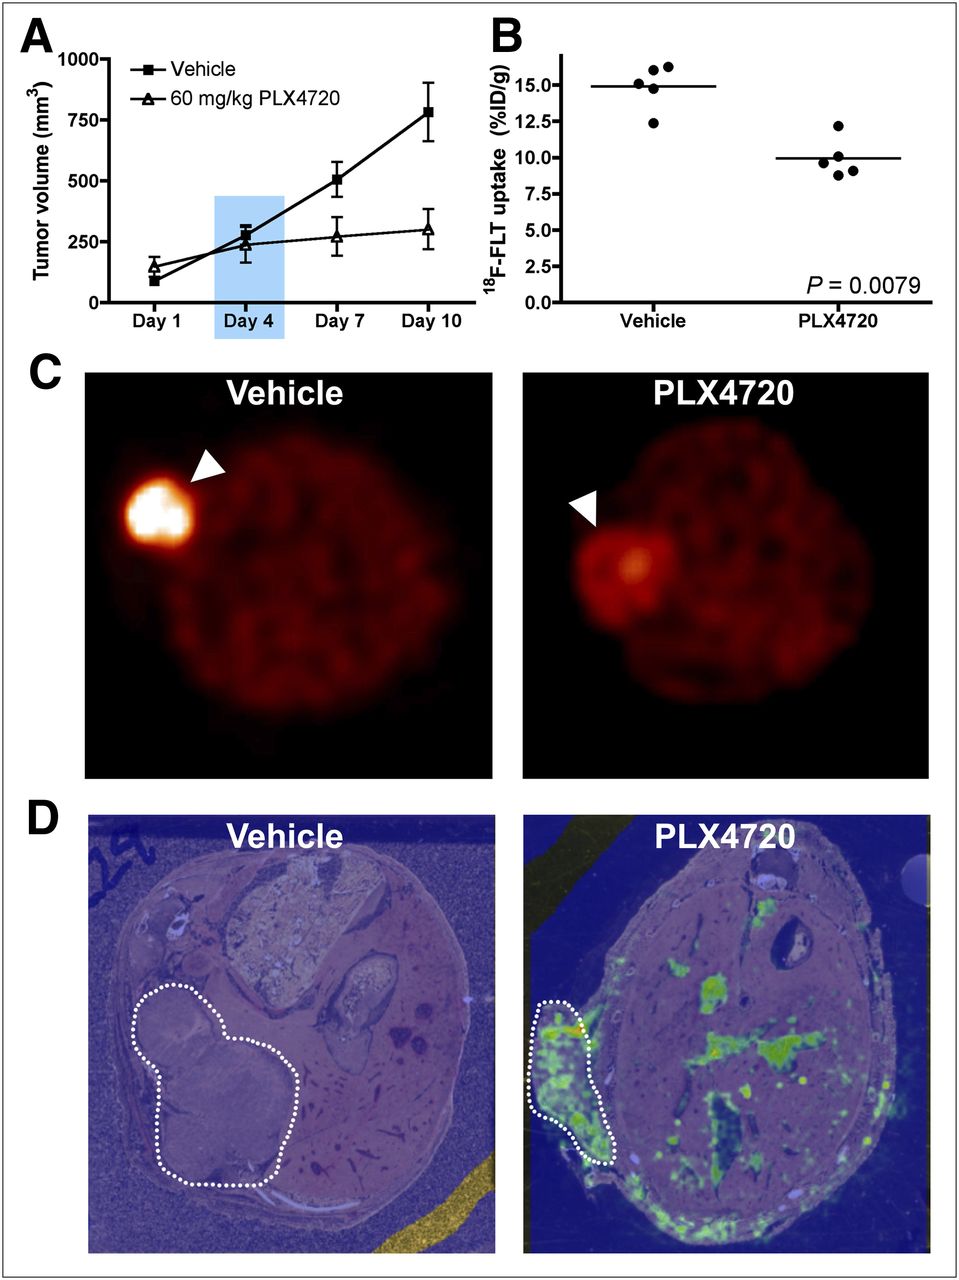
Analogous to studies with Lim2405 xenografts, mice bearing HT-29 xenografts were treated daily with PLX4720 or vehicle over a 10-d treatment course. No difference in xenograft volume was observed between PLX4720-treated and vehicle-treated mice over the 10-d treatment course. (Fig. 5A). Unlike Lim2405 xenografts, at day 4, 18F-FLT uptake was similar comparing PLX4720-treated and vehicle-treated HT-29 xenografts (vehicle: 2.21 ± 0.06 percentage injected dose per gram, n = 5; PLX4720: 1.97 ± 0.14 percentage injected dose per gram, n = 5) (Fig. 5B), suggesting that 18F-FLT PET accurately predicted lack of response. Similarly, no difference in 18F-FDG uptake was observed between PLX4720-treated and vehicle-treated HT-29 xenograft–bearing mice (Supplemental Fig. 3A). Western blot analysis determined that PLX4720 treatment did not affect relative p-MEK or p-ERK levels in HT-29 xenografts harvested immediately after imaging on treatment day 4 (Fig. 5C). Surprisingly, unlike similarly treated Lim2405 xenografts, appreciable levels of PLX4720 were not detected in HT-29 xenografts of treated mice, although drug was detected in adjacent bowel (Fig. 5D). In agreement with 18F-FLT PET, neither TK1 levels (Supplemental Fig. 3B) nor Ki67 immunoreactivity (Supplemental Fig. 3C) was significantly affected by PLX4720 treatment in HT-29 xenografts.
18F-FLT PET predicts lack of response to PLX4720 in HT-29 xenografts. Mice bearing HT-29 xenografts were treated daily with PLX4720 or vehicle. (A) Over 10-d regimen, no difference in tumor volume was observed between PLX4720-treated and vehicle-treated groups. (B and C) Tumor 18F-FLT PET (B) and phosphorylation of BRAF effectors (C) were similar between vehicle-treated and PLX4720-treated HT-29 cohorts. (D) Representative transverse MALDI IMS pseudocolor maps of ion intensity corresponding to parent molecular mass of PLX4720 demonstrate minimal signal intensity in vehicle-treated animals. Treated animals demonstrated little PLX4720 ion intensity within tumor tissue (dotted line), yet PLX4720 ion intensity was observed in bowel.
DISCUSSION
Current imaging criteria for evaluating therapeutic response are primarily based on anatomic response criteria, such as Response Evaluation Criteria in Solid Tumors (RECIST) or similar guidelines. Because relevant cellular and molecular changes may precede changes in size and occur within hours of treatment, RECIST and associated conventional imaging methods may be ill-suited for assessing early responses of tumors to therapy. These limitations have led to the development of newer criteria, such as Positron Emission Tomography Response Criteria in Solid Tumors (25), that recognize the potential utility of 18F-FDG PET to predict early response. For example, 18F-FDG PET has shown clinical utility to predict response to V600EBRAF in melanoma (26), although that was not the case in this study, which used preclinical models of CRC. A drawback of 18F-FDG is that its uptake reflects numerous metabolic processes. For this reason, more specific imaging biomarkers of proliferation may be better suited to predict treatment response in certain clinical scenarios (27).
Compared with 18F-FDG PET, 18F-FLT PET exhibits increased proliferation specificity (28,29) and may be a more suitable option in some settings for evaluating response to targeted therapy. Uptake of 18F-FLT reflects proliferation by reporting the activity of thymidine salvage, a mechanism that provides dividing cells with DNA precursors from the extracellular environment. On internalization, 18F-FLT is monophosphorylated by the cytosolic enzyme thimidine kinase 1 (TK1), resulting in intracellular trapping and accumulation (30–32). TK1 expression is a product of E2F transcription, which can be activated by MAPK signaling (33). For example, Solit et al. reported that 18F-FLT PET correlated with response to a MEK inhibitor in melanoma xenografts (34). Given this, we hypothesized that 18F-FLT PET would also be sensitive to V600EBRAF inhibition in tumors whose proliferation was associated with constitutive MAPK pathway activity.
In this study, we used preclinical models of CRC to explore 18F-FLT PET as a metric to predict response to a V600EBRAF inhibitor. In a V600EBRAF-sensitive model, we found that 18F-FLT PET predicted tumor growth arrest and reduced proliferation associated with attenuation of BRAF downstream effectors. Notably, in the same model 18F-FDG PET failed to predict drug sensitivity. In another model that exhibited in vitro but not in vivo sensitivity, 18F-FLT PET accurately reflected a lack of in vivo response that correlated with limited drug exposure in tumor tissue. Through the use of MALDI-IMS, we were able to document that the sensitive model, Lim2405 xenografts, exhibited significantly greater levels of PLX4720 in tumor tissue at the time of 18F-FLT PET than did the insensitive model, HT-29 xenografts. Though both models were treated and imaged similarly, we anticipate that differences in vasculature or stroma may have contributed to the observed differences in exposure. Regardless, 18F-FLT PET effectively reflected tumor proliferation in both models.
Other preclinical results have documented the sensitivity of CRC cell lines to V600EBRAF inhibition, though clinical results evaluating this approach in patients with colon cancer have been less promising (15). Clinically, it remains unclear whether the lack of single-agent efficacy in V600EBRAF colon tumors stems from resistance or, as with our study, a lack of adequate exposure or potentially other reasons. A recent preclinical study found that combined BRAF and epidermal growth factor receptor inhibition results in improved efficacy in this setting (16). Importantly, because combination therapy led to reduced MAPK activity and proliferation, our results suggest that 18F-FLT PET represents a potentially superior, quantitative biomarker to evaluate the efficacy of analogous combination regimens in this setting.
CONCLUSION
We used preclinical models of CRC to demonstrate 18F-FLT PET as a sensitive predictor of response to a V600EBRAF inhibitor. Because 18F-FLT PET predicted reduced proliferation associated with attenuation of BRAF downstream effectors, whereas 18F-FDG PET did not, we anticipate this imaging metric may represent an alternative to 18F-FDG PET for quantifying clinical responses to BRAF inhibitors.
DISCLOSURE
The costs of publication of this article were defrayed in part by the payment of page charges. Therefore, and solely to indicate this fact, this article is hereby marked “advertisement” in accordance with 18 USC section 1734. This work was funded by the National Institutes of Health (R01 CA140628, RC1 145138, K25 CA127349, P50 951903, P50 CA128323, S10 RR17858, U24 CA126588, R25 CA136440, R01 CA46413, and P30 DK058404) and the Kleberg Foundation. No other potential conflict of interest relevant to this article was reported.
Acknowledgments
We acknowledge Michelle Reyzer and Richard Caprioli for assistance with MALDI IMS.
Footnotes
Published online Jan. 22, 2013.
- © 2013 by the Society of Nuclear Medicine and Molecular Imaging, Inc.
REFERENCES
- Received for publication May 8, 2012.
- Accepted for publication September 25, 2012.


