


Abstract
Standard MR imaging and CT are routinely used for anatomic diagnosis in brain tumors. Pretherapy planning and posttreatment response assessments rely heavily on gadolinium-enhanced MR imaging. Advanced MR imaging techniques and PET imaging offer physiologic, metabolic, or functional information about tumor biology that goes beyond the diagnostic yield of standard anatomic imaging. With the advent of combined PET/MR imaging scanners, we are entering an era wherein the relationships among different elements of tumor metabolism can be simultaneously explored through multimodality MR imaging and PET imaging. The purpose of this review is to provide a practical and clinically relevant overview of current anatomic and physiologic imaging of brain tumors as a foundation for further investigations, with a primary focus on MR imaging and PET techniques that have demonstrated utility in the current care of brain tumor patients.
Imaging plays a pivotal role in the management of human brain tumors. Anatomic features are routinely assessed through MR imaging and CT. Advanced MR imaging techniques and PET imaging offer physiologic, metabolic or functional information about brain tumor biology beyond standard MR imaging and CT evaluations. With combined PET/MR imaging scanners, relationships among different aspects of brain tumor metabolism can be simultaneously explored. The purpose of this review is to provide a practical overview of current multimodality imaging of brain tumors.
ANATOMIC MR IMAGING AND CT
Neuroimaging of brain tumors is performed using MR imaging with gadolinium contrast, except when contraindications exist (1–4). Anatomic MR imaging assessments form the basis on which clinical management decisions are made. Although MR imaging is generally superior to CT for brain tumors, CT remains more readily available and provides important complementary information. CT remains the gold standard for depiction of acute hemorrhage, calcifications, and osseous features. For example, calcifications may be observed in oligodendrogliomas, whereas hyperdensity suggests a cellular tumor such as lymphoma. Despite these situational advantages, some limitations of CT compared with MR imaging include inferior soft-tissue characterization, posterior fossa beam hardening artifacts, and the use of ionizing radiation.
MR SPECTROSCOPY
MR spectroscopy relies on chemical shift and spin–spin coupling effects to identify, characterize, and quantify certain metabolites. Each of these metabolites yields a characteristic resonance frequency across a spectrum determined by the atomic nucleus of interest. Proton MR spectroscopy (1H-MRS) depicts changes in the metabolite profile of certain brain tumors as compared with normal brain tissue (5). Key metabolites of interest include N-acetylaspartate, for neuronal integrity; choline, for cellular membrane turnover; creatine, for bioenergy stores; lactate, for anaerobic glycolysis; lipids, byproducts of necrosis; glutamate-glutamine and γ-aminobutyric acid, neurotransmitters; and myoinositol, a glial cell marker (6).
The hallmark of brain tumor malignancy by 1H-MRS is elevation of choline due to increased cellular membrane synthesis in a growing neoplasm, along with decrease in N-acetylaspartate due to neuronal loss or absence. Creatine forms an internal reference marker for cellular metabolism. Therefore, elevations of choline/N-acetylaspartate and choline/creatine ratios indicate malignancy. Lactate marks hypoxic metabolism, whereas lipids indicate necrosis, both characteristic features of high-grade malignancy. Myoinositol indicates glial cell lineage, whereas other metabolites may be detected in specific tumor subtypes (e.g., alanine in meningiomas, taurine in medulloblastomas) or in pyogenic abscesses as byproducts of fermentation (e.g., succinate and acetate) (6–8).
In clinical practice, 1H-MRS is operator-dependent because a volume of interest must be selected and carefully shimmed to avoid areas of macroscopic necrosis, hemorrhage, calcification, or cysts. Either single-voxel or multivoxel techniques may be used, or both may be obtained sequentially. Echo time must also be selected, necessitating a decision to obtain minor metabolite peaks using short echo times (e.g., on the order of 30 ms), to display the characteristic inversion of lactate below the MR spectrum baseline (using long echo times such as 135 or 144 ms), or to obtain a cleaner spectrum comprising the major metabolites choline, creatine, N-acetylaspartate, and lactate (using longer echo times such as 270 or 288 ms). The absolute quantification of metabolites using MR spectroscopy remains challenging in the clinical environment; therefore, semiquantitative assessments of MR spectra using metabolite peak ratios are often used clinically.
PERFUSION MR IMAGING
MR perfusion characterizes vascularity within brain tumors and surrounding tissue. Many brain tumors exhibit an increased density of vessels per unit volume of tissue, most often quantified by MR perfusion as an increase in cerebral blood volume (CBV) or cerebral blood flow within the tumor as compared with normal brain tissue (9). Neovessels within brain tumors also frequently lack blood–brain barrier integrity, leading to an increase in vascular permeability (10). A variety of different MR imaging strategies can be used to obtain MR perfusion information, each with its own strengths and weaknesses (11).
Dynamic contrast-enhanced (DCE) perfusion is obtained via serial T1-weighted MR imaging during intravenous gadolinium contrast injection and most often quantifies the vascular leakage constant, K-trans (12). Dynamic susceptibility-contrast (DSC) T2- or T2*-weighted perfusion is similarly obtained during a first-pass intravenous bolus of gadolinium contrast, resulting in a drop in MR signal that can characterize vessel density (macrovessel or microvessel, depending on the precise sequence used) in the form of relative CBV measured within a region of interest.
DSC perfusion is more rapidly acquired and more widely used than DCE in clinical practice. DSC may also detect increased microvessel density within nonenhancing or equivocally enhancing tumors with a relatively intact blood–brain barrier (13), although T1 leakage complicates DSC quantification in enhancing tumors (14). Ferumoxytol, a superparamagnetic iron oxide nanoparticle, acts as a blood pool agent shortly after administration, thus avoiding the need for leakage correction and improving the accuracy of CBV quantification (15). However, DCE images are typically of higher resolution than DSC images and have fewer magnetic susceptibility artifacts, and although MR signal intensity does not scale linearly with gadolinium contrast concentration, this scaling problem is worse for DSC than for DCE (10,16).
Another promising technique, arterial spin labeling (ASL), offers advantages over contrast-bolus techniques. ASL does not require gadolinium contrast, enabling repeated measurements during the same imaging session and perfusion evaluation when gadolinium contrast is contraindicated. ASL also may better quantify cerebral blood flow in brain tissue than can DCE and DSC techniques, although such quantification with ASL is technically challenging and may lead to underestimation of perfusion in white matter and in brain tumors relative to normal gray matter (11).
Although MR perfusion methods are relatively operator-independent, the selection of which technique to use, how to account for contrast leakage effects, how to define a region of interest, and how to quantify the resulting parametric information is not. The wide variety of postprocessing software tools currently available for MR perfusion is beyond the scope of this review. However, comparisons of cerebral perfusion quantification by different MR imaging techniques exist, as do recommendations for choice of perfusion acquisition and postprocessing methods (11,17).
Elevation of relative CBV by DSC correlates with shorter survival in both low-grade and high-grade gliomas, independent of pathologic findings (18). Elevation of relative CBV from DSC obtained at baseline may also be a stronger predictor of overall survival than are classifications based on genomic expression in glioblastoma (19).
DIFFUSION MR IMAGING
Diffusion-weighted imaging is sensitive to the motion of water molecules in 3 dimensions within tissue (20). Calculated apparent diffusion coefficient (ADC) maps represent a means of quantifying the apparent diffusion of water molecules without the T1- and T2-relaxivity effects inherent in the diffusion-weighted images themselves (20). Relatively low ADC values observed in certain brain tumors (e.g., meningiomas and lymphoma) are attributed to increased neoplastic cellularity (21), although nonneoplastic central nervous system (CNS) lesions may typically show low ADC values (e.g., acute infarcts, pyogenic abscesses) for other reasons (22,23).
Diffusion tensor imaging requires a minimum of 6 diffusion-encoded directions to generate parametric maps of fractional anisotropy in addition to mean diffusivity and ADC maps. Fractional anisotropy incorporates directionality such that a fractional anisotropy of zero indicates isotropic diffusion whereas a fractional anisotropy of 1 indicates diffusion restriction to a single axis of motion (24). Diffusion tractography renders estimations of white matter tracts, including fiber tracking as well as generation of maps wherein each voxel is color-coded (e.g., red for left–right, blue for superior–inferior, and green for anterior–posterior) according to the direction of its tensor’s main vector (principal eigenvector) and then scaled by its fractional anisotropy value (25). Fiber tracking traces apparent fibers that project through one or more user-defined regions of interest within the white matter to approximate important white matter pathways, such as the cortical spinal tracts for neurosurgical preoperative planning (26).
Diffusion tensor imaging has been shown to differentiate between low- and high-grade glioma (27) and to distinguish glioblastoma from metastases (28). Diffusion tensor imaging also delineates margins of primary brain tumors better than conventional MR imaging alone (29), whereas diffusion tractography alters surgical planning and may enable greater resection while improving surgical safety (30,31).
FUNCTIONAL MR IMAGING
Functional MR imaging is based on the principle that areas of neuronal activation use oxygenated blood to a greater degree than areas at rest. Blood oxygen level–dependent MR imaging is a rapid T2*-weighted sequence that provides a means of serially imaging the brain and its use of oxygen in response to simple motor or language testing (32).
For presurgical evaluation, functional MR imaging primarily localizes regions of motor and language activation that lie nearby or within a brain tumor (32). Cortical gray matter activation information from functional MR imaging is often coupled with diffusion tractography of important white matter tracts to optimize presurgical planning (33), as identification of key anatomic landmarks has been shown to reduce the need for intraoperative cortical mapping via direct cortical stimulation (34). One pitfall for functional MR imaging is the phenomenon of neurovascular uncoupling, where eloquent cortex adjacent to a tumor may show decreased activation or no activation by blood oxygen level–dependent MR imaging due to its close proximity to the tumor (35).
DIAGNOSIS AND TREATMENT PLANNING
Imaging for a suspected brain tumor should include MR imaging of the brain with gadolinium contrast, unless contraindications exist. Standard anatomic MR imaging includes precontrast T1- and T2-weighted sequences, fluid-attenuated inversion recovery, and postcontrast T1-weighted sequences in at least 2 orthogonal planes. Many protocols include T2*-weighted imaging, diffusion-weighted imaging, fat suppression, or 3-dimensional imaging. Volumetric T1-weighted sequences with isometric voxel size and zero angulation/zero rotation are frequently acquired for frameless stereotactic intraoperative guidance. Advanced imaging options include MR perfusion imaging (DCE, DSC, or ASL) and 1H-MRS. Many surgical centers routinely perform functional MR imaging for cortical motor or language activation mapping along with diffusion tensor imaging/tractography to identify critical white matter pathways for presurgical planning.
One goal of brain tumor imaging during the initial work-up phase is to identify lesions wherein surgical intervention can be either minimized or avoided. Anatomic MR imaging alone may not differentiate CNS neoplasms from nonneoplastic mass lesions, or reliably distinguish low-grade from high-grade tumors, given that up to one third of high-grade gliomas do not show gadolinium enhancement. Advanced MR imaging has been proposed for differentiating brain tumors from nonneoplastic lesions, for stratifying lesions into low-grade versus high-grade tumor categories, and for distinguishing glioblastoma from solitary metastasis. Identification of high-grade features through advanced MR imaging can inform surgical decision making, although results from different modalities may vary within individual tumors (Fig. 1).

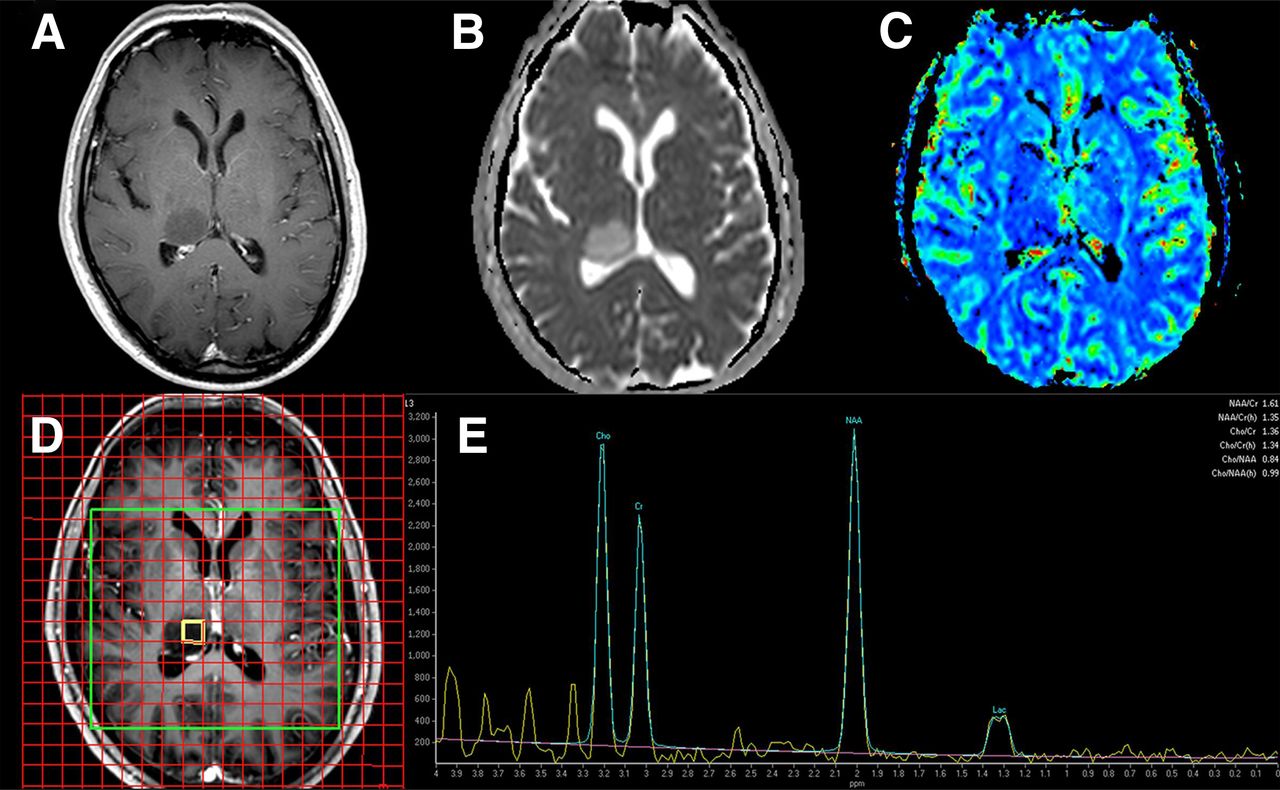
High-grade glioma by 1H-MRS in 69-y-old man with right thalamic tumor. Multimodality MR imaging shows no T1-weighted gadolinium enhancement (A), with high ADC values (B) and low relative CBV (C) relative to normal white matter, suggesting low-grade glioma. However, multivoxel 1H-MRS using 288-ms echo time (D and E) shows elevation of choline (Cho) and reduction of N-acetylaspartate (NAA) relative to creatine (CR), along with a characteristic lactate (Lac) doublet peak, consistent with high-grade glioma. These 1H-MRS findings prompted stereotactic biopsy, which confirmed anaplastic astrocytoma, World Health Organization grade III.
Despite the potential for advanced MR imaging to characterize brain lesions noninvasively, histopathologic diagnosis remains the gold standard for brain tumor treatment planning and clinical decision making in neurooncology. However, gliomas are notoriously heterogeneous to the extent that diagnosis based on stereotactic biopsy alone may differ from final histopathologic classification after resection in the same patient in approximately one third of cases (36). Beyond histopathology, advanced MR imaging techniques can provide independent and complementary prognostic information (18,37).
TREATMENT RESPONSE ASSESSMENT
Updated criteria for therapeutic response proposed by the Response Assessment in Neuro-Oncology (RANO) Working Group continue to gain acceptance over the previous Macdonald criteria (Table 1) (1–3). Similar to response criteria applied elsewhere in the body, complete disappearance or decrease in size of all measurable contrast-enhancing lesions as compared with pretreatment baseline is taken as evidence of treatment response, whereas an increase in size indicates treatment failure. The RANO criteria were prompted by the recognition of certain MR imaging pitfalls—namely pseudoprogression and pseudoresponse—that are commonly observed in the posttreatment setting (1,38,39). Pseudoprogression refers to transient increase in size of enhancement or the appearance of new enhancement in the early–delayed (first 3–6 mo) postradiation period, a phenomenon more commonly recognized in the era of combined chemoradiation therapy for initial treatment of glioblastoma (38). Gadolinium-enhanced MR imaging cannot distinguish true early progression from pseudoprogression (40). Pseudoresponse refers to decreased tumoral enhancement resulting from antiangiogenic therapy. In recognition of these confounding factors, the RANO Working Group proposed updated criteria for response assessment in high-grade gliomas (Table 1).
Summary of RANO Response Criteria for High-Grade Gliomas
Given that response assessment with MR imaging begins at 10 wk after the initiation of radiotherapy, strategies for earlier identification of nonresponding patients have been proposed. Parametric response mapping incorporates both ADC and relative CBV maps acquired before treatment and at 3 wk during treatment into a voxel-by-voxel image analysis method. Using ADC and relative CBV individually, parametric response mapping has been reported to predict outcome after radiotherapy in high-grade glioma (41,42). A large fraction of the tumor with significantly increasing ADC values at 3 wk correlated with improved overall survival, whereas a small fraction of the tumor with decreasing relative CBV also correlated with an improved outcome. Parametric response mapping using combined ADC and CBV has a stronger correlation to survival than baseline clinical or treatment response imaging metrics alone (43).
Although there is inconclusive evidence that late–delayed (>9–12 mo) postradiation effects can be reliably distinguished from tumor recurrence, multivoxel 1H-MRS has been suggested to distinguish between glioma recurrence and radiation injury, as have DCE perfusion, DSC perfusion, and diffusion/diffusion tensor imaging. Some investigations have explored multiparametric approaches to this problem with varied results (44–46).
POSTSURGICAL ASSESSMENT
Postoperative imaging for residual tumor presents a distinct set of challenges (4). Specifically, a neurosurgeon’s operative report should not be used to determine the extent of tumor resection. Instead, gadolinium-enhanced MR imaging should be performed after tumor resection within 24–48 h; beyond that timeframe, postoperative resection margins may show enhancement that could be misinterpreted as residual tumor. In this setting, diffusion-weighted imaging is particularly useful for identifying areas of postsurgical injury along or near the resection margin; specifically, these diffusion-restricted areas may show enhancement on subsequent MR imaging scans that could be misinterpreted as early tumor recurrence (47).
18F-FDG PET
Although 18F-FDG PET imaging has been widely explored, its current clinical role in brain tumors is limited. 18F-FDG is an analog for glucose and thus a radiotracer for energy metabolism. Some tumors are known to overexpress hexokinase II, for which 18F-FDG is a substrate, and therefore 18F-FDG PET may overestimate glucose consumption (48). 18F-FDG uptake in low-grade CNS tumors is typically similar to that of normal white matter, whereas uptake in high-grade tumors is variable but often similar to that of normal gray matter. Heterogeneous primary brain tumors may show areas of adjacent low uptake and high uptake, particularly in glioblastomas with macroscopic necrosis. Some tumors, including pilocytic astrocytomas and gangliogliomas, show relatively high 18F-FDG uptake despite their low grade. Ratios of intratumoral 18F-FDG uptake to normal white matter and normal gray matter have been suggested for distinguishing low-grade from high-grade tumors (49). Delayed 18F-FDG imaging (Fig. 2) may improve discrimination between tumor and normal background due to prolonged radiotracer retention in tumors relative to gray matter (50). Despite these limitations, 18F-FDG uptake has been shown to correlate with both glioma grade and survival (51).

Recurrent glioblastoma by delayed 18F-FDG PET in 45-y-old woman with glioblastoma recurrence vs. radionecrosis. Postcontrast T1-weighted MR imaging (A) shows irregular rim-enhancement surrounding right temporal resection cavity, causing concern about tumor recurrence vs. radionecrosis. PET imaging at 90 min (B) shows corresponding 18F-FDG uptake greater than white matter but less than or equal to gray matter. Six-hour delayed 18F-FDG PET (C) shows delayed lesion washout, consistent with recurrent tumor. Reoperation confirmed glioblastoma recurrence.
Perhaps the most common clinical indication for 18F-FDG PET in brain tumors is the question of tumor recurrence versus delayed radionecrosis (52). Gadolinium-enhanced MR imaging cannot reliably distinguish active tumor from postradiation injury, although characteristic appearances have been described (40,53). Similarly, 18F-FDG PET cannot definitively distinguish recurrent tumor from postradiation injury, regardless of whether white matter or gray matter is the reference standard (54). Confounding factors include relatively high glucose uptake within normal brain and other nonneoplastic etiologies in the posttreatment setting, namely inflammation or apoptosis. Despite these limitations, a recent metaanalysis of 18F-FDG PET studies found moderate accuracy for diagnosing glioma recurrence, with summary sensitivity of 0.77 (95% confidence interval, 0.66–0.85) and specificity of 0.78 (95% confidence interval, 0.54–0.91) for any glioma histology (55).
18F-FLT PET
Thymidine is the nucleic acid specific to DNA. Thymidine is a substrate for thymidine kinase 1, which varies during the cell cycle, and for mitochondrial thymidine kinase 2, which limits specificity for active cell division. The thymidine analog 3-deoxy-3-18F-fluorothymidine (18F-FLT) becomes trapped by thymidine kinase 1, analogous to the manner in which 18F-FDG is trapped by hexokinase (56). Unlike thymidine, 18F-FLT is a poor substrate for mitochondrial thymidine kinase 2, and thus its uptake is specific to the cell cycle (57). Therefore, 18F-FLT PET can provide a quantitative measure of mitotic activity and cell division.
However, the blood–brain barrier limits cellular uptake of 18F-FLT (58). 18F-FLT uptake is a function of the plasma input function and the rate of its transport across the blood–brain barrier; therefore, a complete kinetic model of 18F-FLT uptake, transport, and metabolism is needed to accurately quantify DNA synthesis in brain tumors (59). Without such a model, 18F-FLT is unlikely to perform better than an inert contrast agent, such as gadolinium chelates, in brain tumor imaging (Fig. 3).
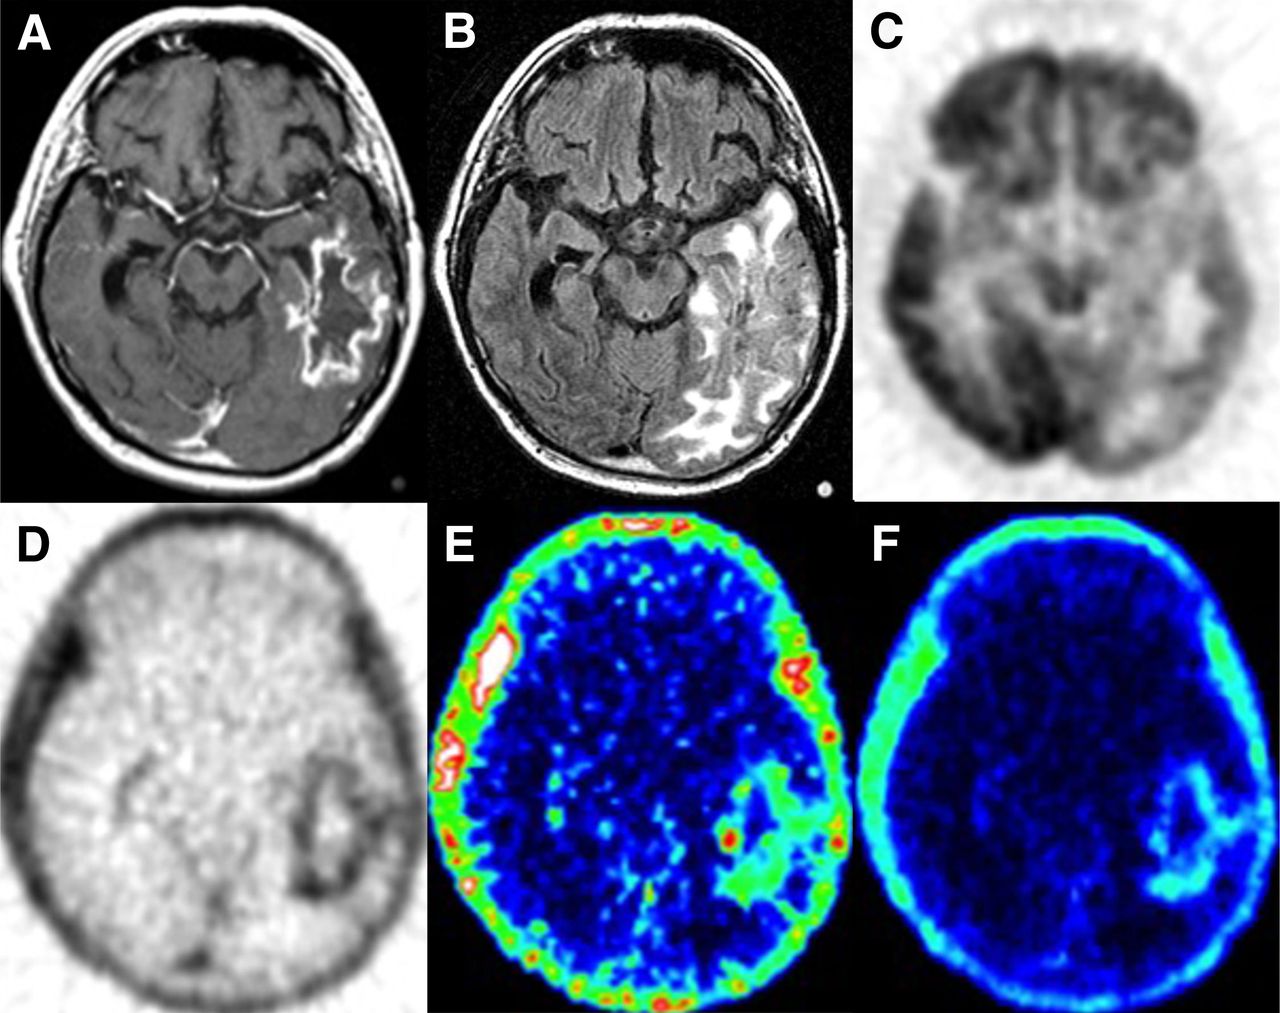
Recurrent glioblastoma by PET imaging in 60-y-old man with left temporal glioblastoma recurrence vs. radionecrosis. Postgadolinium T1-weighted (A) and fluid-attenuated inversion recovery (B) images show irregular rim-enhancement and edema in left temporal–occipital region. 18F-FDG standardized uptake value image (C) shows uptake higher than white matter along lateral lesion margin. 18F-FLT standardized uptake value image (D) shows uptake around entire margin of lesion, similar to gadolinium rim-enhancement by MR imaging. 18F-FLT images derived from dynamic PET acquisition with blood sampling of metabolites and kinetic modeling separate radiotracer retention due to blood–brain barrier leakage (E) from incorporation into DNA synthesis pathway (F). Despite treatment for glioblastoma recurrence based on 18F-FDG PET results, this patient experienced functional decline and died 9 mo later. (Parametric 18F-FLT images were generated with assistance from Finbarr O'Sullivan, PhD.)
18F-FLT PET identifies recurrent high-grade glioma and correlates with survival better than 18F-FDG (60), and quantitative 18F-FLT PET with kinetic modeling may distinguish tumor recurrence from radionecrosis (61). However, an assumption that 18F-FLT standardized uptake value reflects primarily uptake of the tracer into the DNA synthesis pathway is potentially misleading in CNS neoplasms (62).
18F-FLUOROMISONIDAZOLE PET
Hypoxia is an important factor in malignant tumor progression and resistance to therapy (63). Conventional photon radiation therapy depends on available oxygen to form free radicals that damage DNA and thereby induce apoptosis and inhibit tumor growth. Persistence of tumor cells within a hypoxic microenvironment correlates with poor prognosis. Hypoxia-inducible factors mediate changes that enable tumors to survive under hypoxic conditions (64). Some of these changes, including neoangiogenesis resulting from production of vascular endothelial growth factor, pose a significant barrier to treatment (65).
18F-fluoromisonidazole freely crosses the blood–brain barrier and rapidly equilibrates within tissues independently of perfusion (66,67). 18F-fluoromisonidazole is trapped only within viable cells under severely hypoxic conditions. 18F-fluoromisonidazole PET images are analyzable through a relatively simple calculation using calibrated blood sampling to obtain a tumor-to-blood ratio. A tumor-to-blood ratio above 1.2 identifies 18F-fluoromisonidazole uptake within hypoxic tissue above background normal tissue, and regions of interest drawn around visible tumor involvement on MR imaging allow hypoxic volume and tumor-to-blood maximum value to be calculated; these parameters correlate with worsened prognosis in glioblastoma independently of other prognostic factors (68). In a more recent prospective study of glioma patients (14 World Health Organization grade IV, 9 grade II or III) who underwent both 18F-fluoromisonidazole PET and 18F-FDG PET examinations, 18F-fluoromisonidazole PET showed an improved ability to distinguish glioblastoma from lower grades as compared with 18F-FDG (69).
AMINO ACID PET
An advantage of amino acid and amino acid analog PET radiotracers is their relatively high tumor-to-background contrast. 11C-methionine is perhaps the most widely studied in this group but is limited by the short half-life of 11C (20 min) compared with 18F (110 min), restricting its use to centers with an on-site cyclotron. 18F-labeled alternatives to 11C-methionine include 18F-fluoroethyl-l-tyrosine (18F-FET) and 3,4-dihydroxy-6-18F-fluoro-l-phenylalanine (18F-FDOPA).
It has been suggested that 18F-FDG or 11C-methionine PET is more specific than gadolinium enhancement for targeting of high-grade glioma for resection, thereby prolonging survival through greater tumor removal (70). Pretreatment 11C-methionine PET also identifies locations at highest risk for glioblastoma recurrence after chemoradiation therapy (71). In a recent metaanalysis of PET studies for glioma recurrence after therapy, the accuracy of 11C-methionine PET was moderate, with summary sensitivity of 0.70 (95% confidence interval, 0.50–0.84) and specificity of 0.93 (95% confidence interval, 0.44–1.0) for high-grade glioma (55).
18F-FET PET has been studied for delineation of gliomas to guide tissue sampling and treatment planning, for detection of tumor recurrence, and for prognostication in low-grade glioma. In a prospective study of 18F-FET PET and 18F-FDG PET scans obtained on the same day in patients with suspected glioma, 18F-FET was superior for determination of tumor extent, although some benign nonneoplastic lesions showed uptake of both tracers, and uptake of 18F-FDG (and not 18F-FET) correlated with overall survival (72).
18F-FDOPA was developed for imaging the DOPA-decarboxylase pathway in neurodegenerative disease, but it also serves as a marker for l-amino acid transport in brain tumors. 18F-FDOPA has been shown to be more accurate than 18F-FDG for evaluating low-grade tumors and for distinguishing tumor recurrence from radiation necrosis (73).
PET/MR IMAGING OF BRAIN TUMORS
The first application for integrated PET/MR imaging in humans was to evaluate feasibility in the brain (74). Initial PET/MR imaging research focused on correlations to PET/CT in assessment of primary CNS tumors (75). The simultaneous acquisition of coregistered PET and MR imaging data enables direct correlation among different imaging parameters acquired during a single imaging session, thus enabling development of applications that exploit the complementary nature of metabolic and anatomic information from each modality (76).
Early work in combining PET and MR imaging in brain tumors has focused on correlations with histologic specimens and biopsy targeting. For example, different markers for cellular proliferation (low ADC, elevated choline, increased 18F-FLT uptake) and tumor vascularity (elevated perfusion by DCE, DSC, and ASL) have been shown to identify similar areas for surgical targeting in a variety of high- and low-grade gliomas (77). In the case of nonenhancing gliomas, 1H-MRS and 11C-methionine PET can detect areas of anaplasia and reduce tumor under-grading from sampling error (78). Although 11C-methionine PET does not always correlate with choline/N-acetylaspartate ratios by 1H-MRS, increased creatine/N-acetylaspartate correlates with increased 11C-methionine uptake in low-grade gliomas (79). In the posttreatment setting, both 1H-MRS and MR perfusion may be more accurate for detecting tumor recurrence, high-grade transformation, and radionecrosis than standard MR imaging and 18F-FDG PET (80).
CONCLUSION
Gadolinium-enhanced MR imaging remains the standard of care for brain tumor diagnosis, treatment planning, and posttreatment response assessment. Current criteria for therapeutic response assessment rely on anatomic MR imaging with integration of clinical assessments, although future updates integrating advanced MR imaging or PET information are likely forthcoming. Currently, advanced MR imaging modalities such as 1H-MRS, MR perfusion, and MR diffusion/diffusion tensor imaging remain useful for problem solving in difficult cases, such as characterizing atypical CNS mass lesions and distinguishing tumor recurrence from postradiation injury. Similarly, PET imaging with experimental radiotracers beyond 18F-FDG, including 18F-FLT, 18F-fluoromisonidazole, 11C-methionine, 18F-FET, and 18F-FDOPA, have shown promising results for characterizing different aspects of brain tumor biology. The combination of simultaneously acquired PET and MR imaging information will facilitate research into how multimodality MR imaging and PET imaging parameters can be integrated and validated to optimize patient care and improve outcomes in neurooncology.
Footnotes
Published online Aug. 20, 2015.
Learning Objectives: On successful completion of this activity, participants should be able to (1) describe the role of anatomic MR and CT imaging in clinical assessment of brain tumors; (2) identify situations in which advanced MR imaging modalities may aid in brain tumor diagnosis and managment; and (3) understand the metabolic pathways and potential uses of radiotracers commonly employed for PET imaging of brain tumors.
Financial Disclosure: Dr. Fink has investment interest in GE Healthcare, is a meeting participant or lecturer for ProCure, and is involved in scientific studies or trials for Guerbet, Bracco, and Bayer. The authors of this article have indicated no other relevant relationships that could be perceived as a real or apparent conflict of interest.
CME Credit: SNMMI is accredited by the Accreditation Council for Continuing Medical Education (ACCME) to sponsor continuing education for physicians. SNMMI designates each JNM continuing education article for a maximum of 2.0 AMA PRA Category 1 Credits. Physicians should claim only credit commensurate with the extent of their participation in the activity. For CE credit, SAM, and other credit types, participants can access this activity through the SNMMI website (http://www.snmmilearningcenter.org) through October 2018.
- © 2015 by the Society of Nuclear Medicine and Molecular Imaging, Inc.
REFERENCES
- 1.↵
- 2.
- 3.↵
- 4.↵
- 5.↵
- 6.↵
- 7.
- 8.↵
- 9.↵
- 10.↵
- 11.↵
- 12.↵
- 13.↵
- 14.↵
- 15.↵
- 16.↵
- 17.↵
- 18.↵
- 19.↵
- 20.↵
- 21.↵
- 22.↵
- 23.↵
- 24.↵
- 25.↵
- 26.↵
- 27.↵
- 28.↵
- 29.↵
- 30.↵
- 31.↵
- 32.↵
- 33.↵
- 34.↵
- 35.↵
- 36.↵
- 37.↵
- 38.↵
- 39.↵
- 40.↵
- 41.↵
- 42.↵
- 43.↵
- 44.↵
- 45.
- 46.↵
- 47.↵
- 48.↵
- 49.↵
- 50.↵
- 51.↵
- 52.↵
- 53.↵
- 54.↵
- 55.↵
- 56.↵
- 57.↵
- 58.↵
- 59.↵
- 60.↵
- 61.↵
- 62.↵
- 63.↵
- 64.↵
- 65.↵
- 66.↵
- 67.↵
- 68.↵
- 69.↵
- 70.↵
- 71.↵
- 72.↵
- 73.↵
- 74.↵
- 75.↵
- 76.↵
- 77.↵
- 78.↵
- 79.↵
- 80.↵
- Received for publication April 2, 2015.
- Accepted for publication August 18, 2015.


Jump to section
- Article
- Abstract
- ANATOMIC MR IMAGING AND CT
- MR SPECTROSCOPY
- PERFUSION MR IMAGING
- DIFFUSION MR IMAGING
- FUNCTIONAL MR IMAGING
- DIAGNOSIS AND TREATMENT PLANNING
- TREATMENT RESPONSE ASSESSMENT
- POSTSURGICAL ASSESSMENT
- 18F-FDG PET
- 18F-FLT PET
- 18F-FLUOROMISONIDAZOLE PET
- AMINO ACID PET
- PET/MR IMAGING OF BRAIN TUMORS
- CONCLUSION
- Footnotes
- REFERENCES
- Figures & Data
- Info & Metrics
Related Articles
Cited By...
- Correlation Between CT Density, Incidence, Mortality, and Mortality-to-Incidence Ratio in Central Nervous System Cancers: An Exploratory Analysis of Global Data
- Impact of 18F-FET PET/MRI on Clinical Management of Brain Tumor Patients
- Pharmacokinetic Assessment of 18F-(2S,4R)-4-Fluoroglutamine in Patients with Cancer
- VCAM-1-targeted MRI Enables Detection of Brain Micrometastases from Different Primary Tumors
- Imaging in low-grade glioma: a guide for neurologists
- Diagnostic Accuracy of Neuroimaging to Delineate Diffuse Gliomas within the Brain: A Meta-Analysis
- Optimization of DSC MRI Echo Times for CBV Measurements Using Error Analysis in a Pilot Study of High-Grade Gliomas