


Abstract
The use of radiolabeled thymidine (TdR) and thymidine analogs as PET-based tracers of tumor growth rate is based on the assumption that measurement of uptake of these nucleosides, a function primarily of thymidine kinase-1 (TK1) activity, provides an accurate measure of active cell proliferation in tumors. The goal of this study was to test this hypothesis and determine how well these tracers track changes in proliferation of tumor cells. Methods: TK1 activity; S-phase fraction; and uptake of TdR, 3′-deoxy-3′-fluorothymidine (FLT), and 2′-fluoro-5-methyl-1-(β-D-2-arabino-furanosyl) uracil (FMAU) were determined in plateau-phase and exponentially growing cultures of 3 human and 3 murine tumor cell lines. Results: TK1 activity and S-phase fraction increased in all cell lines as cells moved from plateau-phase conditions to exponential growth. Some cell lines had relatively large TK1 activities and S-phase fractions under plateau-phase conditions, consistent with a loss of normal cell cycle checkpoint control in these cells. There were also 2 cell lines in which TK1 activity changed little as cells moved from the plateau phase to exponential growth, suggesting that in these cell lines, de novo nucleotide synthesis pathways predominate over salvage pathways. Both TdR and FLT detected changes in TK1 activity. The slope of the relationship between TdR uptake and TK1 activity was nearly twice that for FLT and more than 40-fold that for FMAU. Conclusion: Although not all tumors show a strong TK1 dependence of proliferation, in all cell lines for which proliferation is highly TK1 dependent, phosphorylation of TdR or FLT accurately reflects changes in TK1 enzyme activity.
- 3′-deoxy-3′-fluorothymidine
- 2′-fluoro-5-methyl-1-(β-d-2-arabino-furanosyl) uracil
- thymidine kinase
- cell proliferation
Tumor growth rate is considered to be a useful prognostic indicator of tumor aggressiveness and tumor response to therapy (1–8). PET imaging provides a noninvasive approach to measure tumor growth rate in situ (5,9–16). Early approaches have used 18F-FDG or methionine to monitor proliferation status (9,17–19). These 2 tracers detect changes in glucose and amino acid metabolism, respectively, and therefore provide only an indirect measure of proliferation status. More recent studies have focused on DNA synthesis itself as a marker of cell proliferation (5,11, 14–16,20–22). Cell lines and tissues with a high proliferation rate require high rates of DNA synthesis.
Choosing an appropriate PET tracer requires knowledge of specific biochemistry for that tracer. Incorporation of radiolabeled thymidine (TdR) is the standard marker for DNA synthesis, and it has long been used to track cell proliferation both in vitro and in vivo. Use of radiolabeled TdR for in vivo imaging studies, however, is complicated by the rapid metabolism of TdR by thymidine phosphorylase that results in large amounts of labeled small molecules, which must be analyzed in plasma samples and accounted for using mathematic models to accurately interpret scans (5,11,12,16,20). Several TdR analogs, which can be labeled and are resistant to catabolism in vivo, have been proposed as alternatives to TdR (15,16,21,23).
It is also important to consider the relevance of the biochemical path being targeted and how that pathway may be altered in tumor cells. The processing of TdR into DNA has multiple steps. The initial step in TdR metabolism is phosphorylation by thymidine kinase-1 (TK1). In normal cells, TK1 expression is tightly regulated; TK1 activity peaks in the S phase (24–26). Cell cycle checkpoint controls are often less well regulated in tumor cells. Therefore, noncycling tumor cells may arrest in the S phase rather than the G1 phase. If TK1 activity remains high in S-phase cells regardless of whether these cells are proliferating, then high tracer uptake levels might not always track with rapid proliferation. Another factor that might influence the ability to detect changes in proliferation using TdR or thymidine analogs would be the relative contribution of de novo and salvage pathways to nucleotide biosynthesis. Tumors vary in the relative contribution of de novo and salvage nucleotide biosynthesis (27–30). Dominance of de novo pathways, although uncommon, would mask proliferation-dependent increases in TK1 activity.
To examine how some tumor-specific variations in cell biology influence PET tracer uptake, we considered the relationships between proliferation tracer uptake, S-phase fraction, and TK1 activity in both plateau-phase and growing cultures of tumor cells. We compared 3 tracers: TdR, 3′-deoxy-3′-fluorothymidine (FLT), and 2′-fluoro-5-methyl-1-(β-d-2-arabino-furanosyl) uracil (FMAU). Our results confirmed that not all tumor cells arrest in G1 phase under nonproliferative conditions and that not all tumors show a TK1 dependence of proliferation. However, in all cell lines for which proliferation is highly TK1 dependent, phosphorylation of TdR or FLT accurately reflects changes in TK1 enzyme activity.
MATERIALS AND METHODS
Cell Culture Systems
Six cultured cell lines were examined in this study. Three were murine tumor cell lines (EMT6, RIF1, and KHTn), and 3 were human tumor cell lines (A549, WiDr, and HT29). These were chosen primarily because they have extensively been characterized in our laboratory (27–35). The tumor cell lines were from the American Type Culture Collection. All 6 cell lines were maintained in a 1:1 mixture of Dulbecco’s modified Eagle’s medium and F12 medium containing 10% heat-inactivated fetal bovine serum, 2 mmol/L glutamine, 100 U/mL penicillin, and 0.01 mg/mL streptomycin (Invitrogen Life Technologies).
To mimic both nongrowth and growth conditions in vivo, plateau-phase and exponentially growing cultures of each cell line were compared. For plateau-phase cultures, cells were seeded at about 2 × 10⁵ cells in 60-mm plastic dishes and grown for 8 d with no change of culture medium. Under these conditions, 8-d-old cultures show little or no continued growth. To analyze exponentially growing cultures, plateau-phase cultures were released by trypsin treatment and then reseeded in fresh medium at 3–5 × 10⁵ cells per dish for up to 48 h before TK1 activity, S-phase fraction, and tracer uptake were determined.
Radiotracer Uptake
To determine tracer uptake, cells were incubated for 1 h in medium containing 37 kBq of 3H-TdR (111.0 GBq/mmol, 99.9% TdR), 3H-FLT (81.4 GBq/mmol, 99.2% FLT), or 3H-FMAU (77.7 GBq/mmol, 99.3% FMAU) (Moravek Biochemicals, Inc.) per milliliter at 37°C in a humidified atmosphere containing 5% CO2. The cells were quickly rinsed twice in cold phosphate-buffered saline to remove unbound label and then were harvested by trypsin treatment to remove them from the dishes. Approximately 25% of the total sample was counted in a model 1900CA liquid scintillation spectrometer (Packard BioScience Co.) in 10 mL of Ultima Gold scintillation cocktail (Packard BioScience Co.). The counting efficiency (64.0% ± 1.6% based on a 3H standard) was greater than the minimum recommended by the manufacturer. Scintillation counts were corrected for quenching caused by cell culture medium components. Replicate plates were run in each experiment. Tracer uptake was calculated both as disintegrations per minute per 106 cells and as a percentage of the radioactivity in an equivalent volume of medium. To calculate the latter value, the cells were sized using a Coulter counter (33). Cell diameters for plateau-phase cultures ranged from 13.1 μm in RIF-1 cells to 15.0 μm in WiDr cells. The mean ± SD was 14.3 ± 0.9 μm. Cell diameters for cells 24 h after release from the plateau phase ranged from 15.6 μm in HT29 cells to 19.2 μm in KHTn cells. The mean ± SD was 16.9 ± 1.3 μm. An analysis of the influence of size on tracer uptake measurements suggested that any differences in cell size between the 6 cell lines did not significantly affect our results or conclusions. Therefore, the data are presented in terms of cell number and not as a percentage of the activity in the medium.
Cell Cycle Phase Determinations
Cell cycle distributions were determined in parallel cultures by flow cytometry on an Epics Elite flow cytometer (Coulter Corp.) with ultraviolet excitation at 360 nm from an Innova-90-6 water-cooled argon-ion laser (Coherent). 4′,6-Diamidino-2-phenylindole fluorescence was collected with a 450-nm/35-nm band pass emission filter. A minimum of 20,000 cells was analyzed per sample. The data were collected using Elite software (Coulter Corp.), version 4.01. The Multicycle-AV software package (Phoenix Flow Systems) was used for data analysis.
TK1 Assay
Cell protein from a measured number of cells was assayed for TK1 activity by the method described by Rasey et al. (33). Protein samples were added to reaction mixtures consisting of 50 mmol/L Tris (pH 7.6), 5 mmol/L MgCl2, 5 mmol/L adenosine triphosphate, 2 mmol/L dithiothreitol, 10 mmol/L NaF, and 100 μmol/L 3H-TdR. Individual mixtures were incubated at 37°C, and aliquots were removed at various intervals and heat inactivated. To sequester labeled nucleotides, samples were spotted onto DE-81 filters, dried, and then washed in 4 mmol/L ammonium formate to remove nonphosphorylated substrate. Activity captured by the filters was measured by liquid scintillation counting. Activity values from the linear portions of the activity-versus-time curves were used to determine TK1 activity rates. Both the picomoles of TdR phosphorylated in 30 min per milligram of protein and the picomoles of TdR phosphorylated in 30 min per 106 cells were calculated. Protein concentrations were calculated using a bicinchoninic acid protein assay (Pierce). A comparison of these 2 measurements suggests that using either calculation will yield the same conclusion. For the work presented in this article, we have used the activity normalized to a milligram of protein.
RESULTS
Relationship Between S Phase, TK1 Activity, and Cell Proliferation
Under plateau-phase conditions (0 h after release), S-phase percentages were low relative to actively growing cultures (Table 1; Fig. 1A). The plateau-phase levels of cells in S phase varied between cell lines. Three of the 6 cell lines—A549, EMT6, and RIF1—had less than 5% S-phase cells in plateau-phase growth conditions, whereas the other 3 had levels of S-phase cells that ranged from 12.3% to 17.7% (Table 1; Fig. 1A). TK1 activity was lower in plateau-phase cultures of the 3 murine cell lines than in the 3 human cell lines (Table 1; Fig. 1B). The mean level of TK1 activity immediately after release was 36 ± 5 pmol TdR phosphorylated in 30 min per milligram of protein for the 3murine cell lines and was 607 ± 290 pmol TdR phosphorylated in 30 min per milligram of protein for the 3 human cell lines.
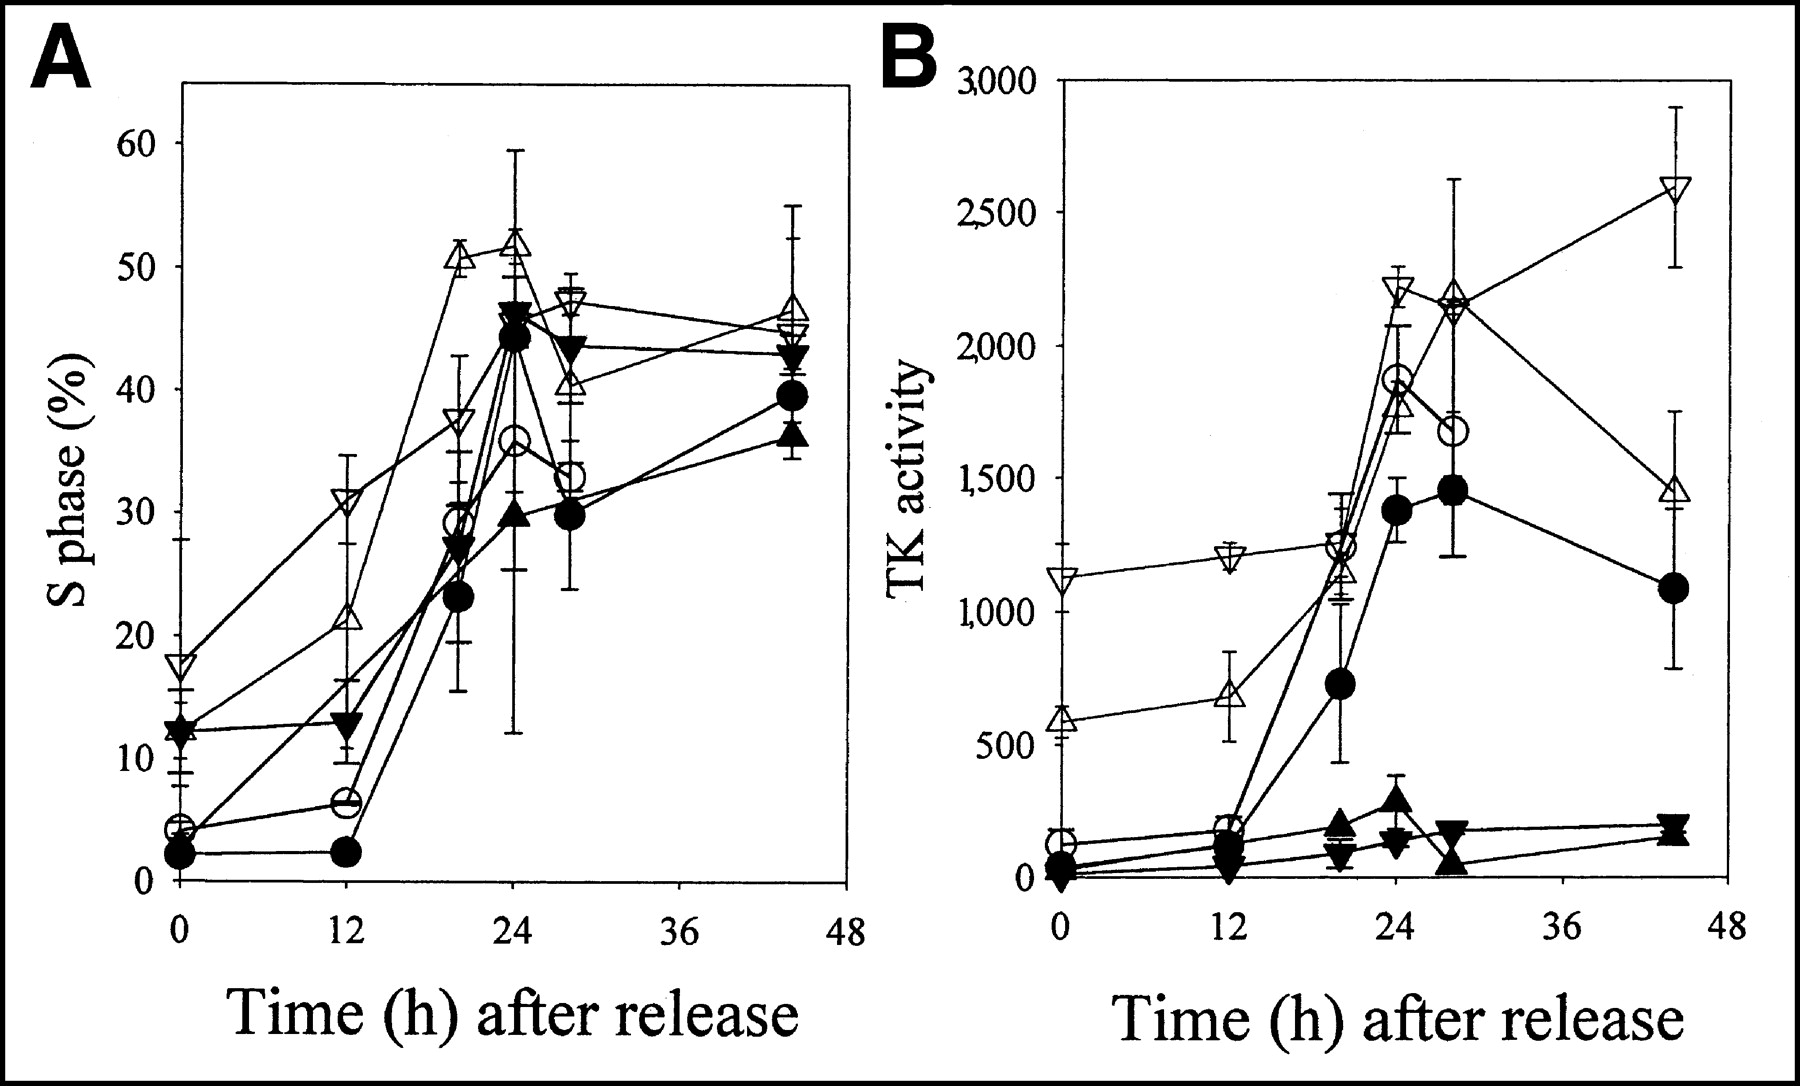
Changes in S-phase percentage (A) and TK1 activity (B) (pmol TdR phosphorylated in 30 min per milligram of protein) as function of time after release from plateau-phase culture. Results are mean ± SD for 2–4 independent measurements. ○ = A549; • = EMT6; ▿ = HT29; ▾ = KHTn; ▴ = RIF-1; ▵= WiDr.
Comparison Between TK1 Activity and S-Phase Percentage
Release from the plateau phase by replating cells at lower cell densities led to an increased S-phase percentage in all 6 cell lines (Table 1; Fig. 1B). S-phase values peaked at between 30% and 60% S-phase cells by 24–48 h after release. Release from the plateau phase led to increased TK1 activity in all cell lines, but the magnitude of change varied greatly. For WiDr and HT29 cells, TK1 activity increased only 2- to 4-fold. The other 4 cell lines had increases of 10- to 35-fold. Absolute TK1 values were low for 2 of the murine cell lines, KHTn and RIF-1. Table 1 compares TK1 activity and S-phase percentage. TK1 activity correlated with S-phase percentage for all but 2 cell lines, HT29 and RIF1, and for these 2, there were certainly linear trends in the relationship between TK1 activity and S-phase percentage. Four of the lines had similarly large slopes, whereas the 2 murine cell lines with low TK1 activity had much smaller slopes.
TK1 Activity and Uptake of 3 Tracers
The relationship between TK1 activity and tracer uptake for each of the 6 cell lines is summarized in Figure 2 and Table 2. In general, TdR uptake levels were higher than either FLT or FMAU levels, and FLT levels were usually higher than FMAU levels. However, there were cell line variations in the magnitude of the differences. For HT29 and WiDr cells, FLT uptake was 60%–80% of TdR levels, whereas FMAU levels were about 10% of TdR levels. For the other cell lines, both FLT and FMAU levels were 5%–15% of TdR levels.
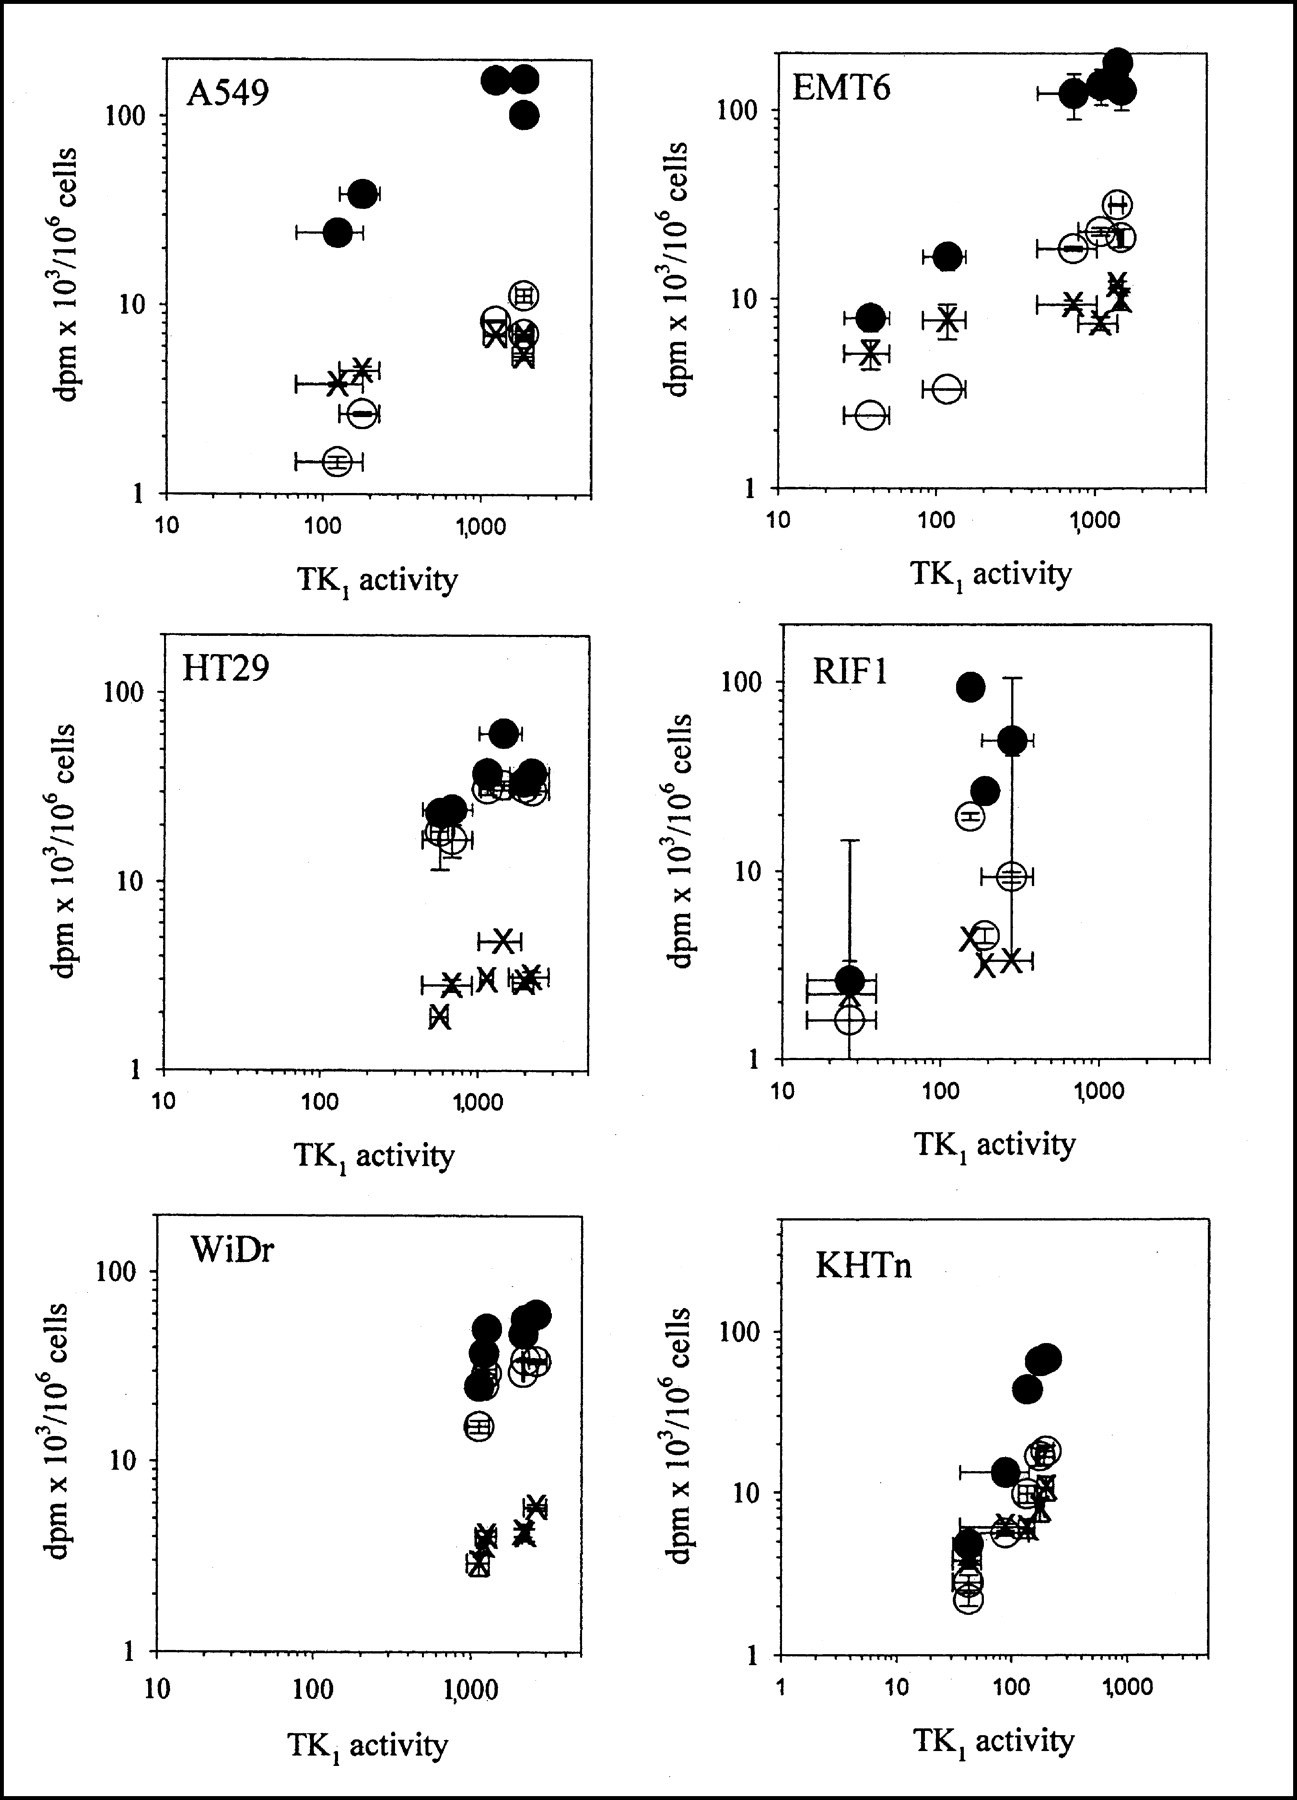
Comparison between tracer uptake (disintegrations per minute × 103/106 cells) and TK1 activity (picomoles of TdR phosphorylated in 30 min per milligram of protein). Results are mean ± SD for 2–4 independent measurements. ○ = FLT; × = FMAU; • = TdR.
Comparisons Between TK1 Activity, S-Phase Fraction, and Tracer Uptake
Tracer uptake in the plateau-phase cultures showed wide variations related to TK1 levels under these quiescent growth conditions. WiDr and HT29 cells, the 2 cell lines with relatively high tracer uptake in plateau-phase cultures, also were the cell lines with the highest TK1 activities in plateau-phase cultures.
Thymidine uptake varied by more than 2 orders of magnitude, depending on cell type and proliferation status. In general, TdR uptake was lower in plateau-phase cultures, but the increase in uptake between plateau-phase and plateau-released cultures varied from only 30% higher in HT29 cells to more than 50-fold higher in A549 cells. When all cell lines were considered together, the correlation between TK1 activity and TdR uptake was significant, but with much scatter in the relationship (r2 = 0.13). When the results were normalized to plateau-phase levels (Table 2), the relationship between TK1 activity and TdR uptake improved (r2 = 0.56). When the 4 cell lines that show large TK1-dependent changes in proliferation (A549, HT29, WiDr, and EMT6) were considered separately, the relationship between TK1 activity and TdR uptake improved to an r2 of 0.90. For KHTn and RIF1, the normalized data yield an r2 of 0.36. The correlation between TK1 activity and FLT uptake (r2 = 0.80) was better than that between TK1 activity and TdR uptake, and this effect was also driven by the 4 cell lines with large TK1-dependent changes in proliferation (A549, HT29, WiDr, and EMT6).
FMAU uptake was low in all cell lines and under all conditions. Release from plateau-phase conditions led to, at most, 2- to 4-fold increased FMAU uptake in the murine cell lines, but even less in the human cell lines. Some of the human cell lines showed no evidence of any increase in FMAU uptake with release of cells from plateau. Overall, there were no significant correlations between FMAU uptake and TK1 activity even when results were normalized to plateau-phase levels (Table 2). When only the normalized results from A549, HT29, WiDr, and EMT6 were considered, a weak relationship was seen between FMAU uptake and TK1 activity (r2 = 0.20), with a slope that was 0.02 ± 0.01, a value that is only about 4% of the value for TdR uptake. FMAU uptake and TK1 activity showed no significant correlation in the other 2 cell lines.
S-Phase Levels and Tracer Uptake
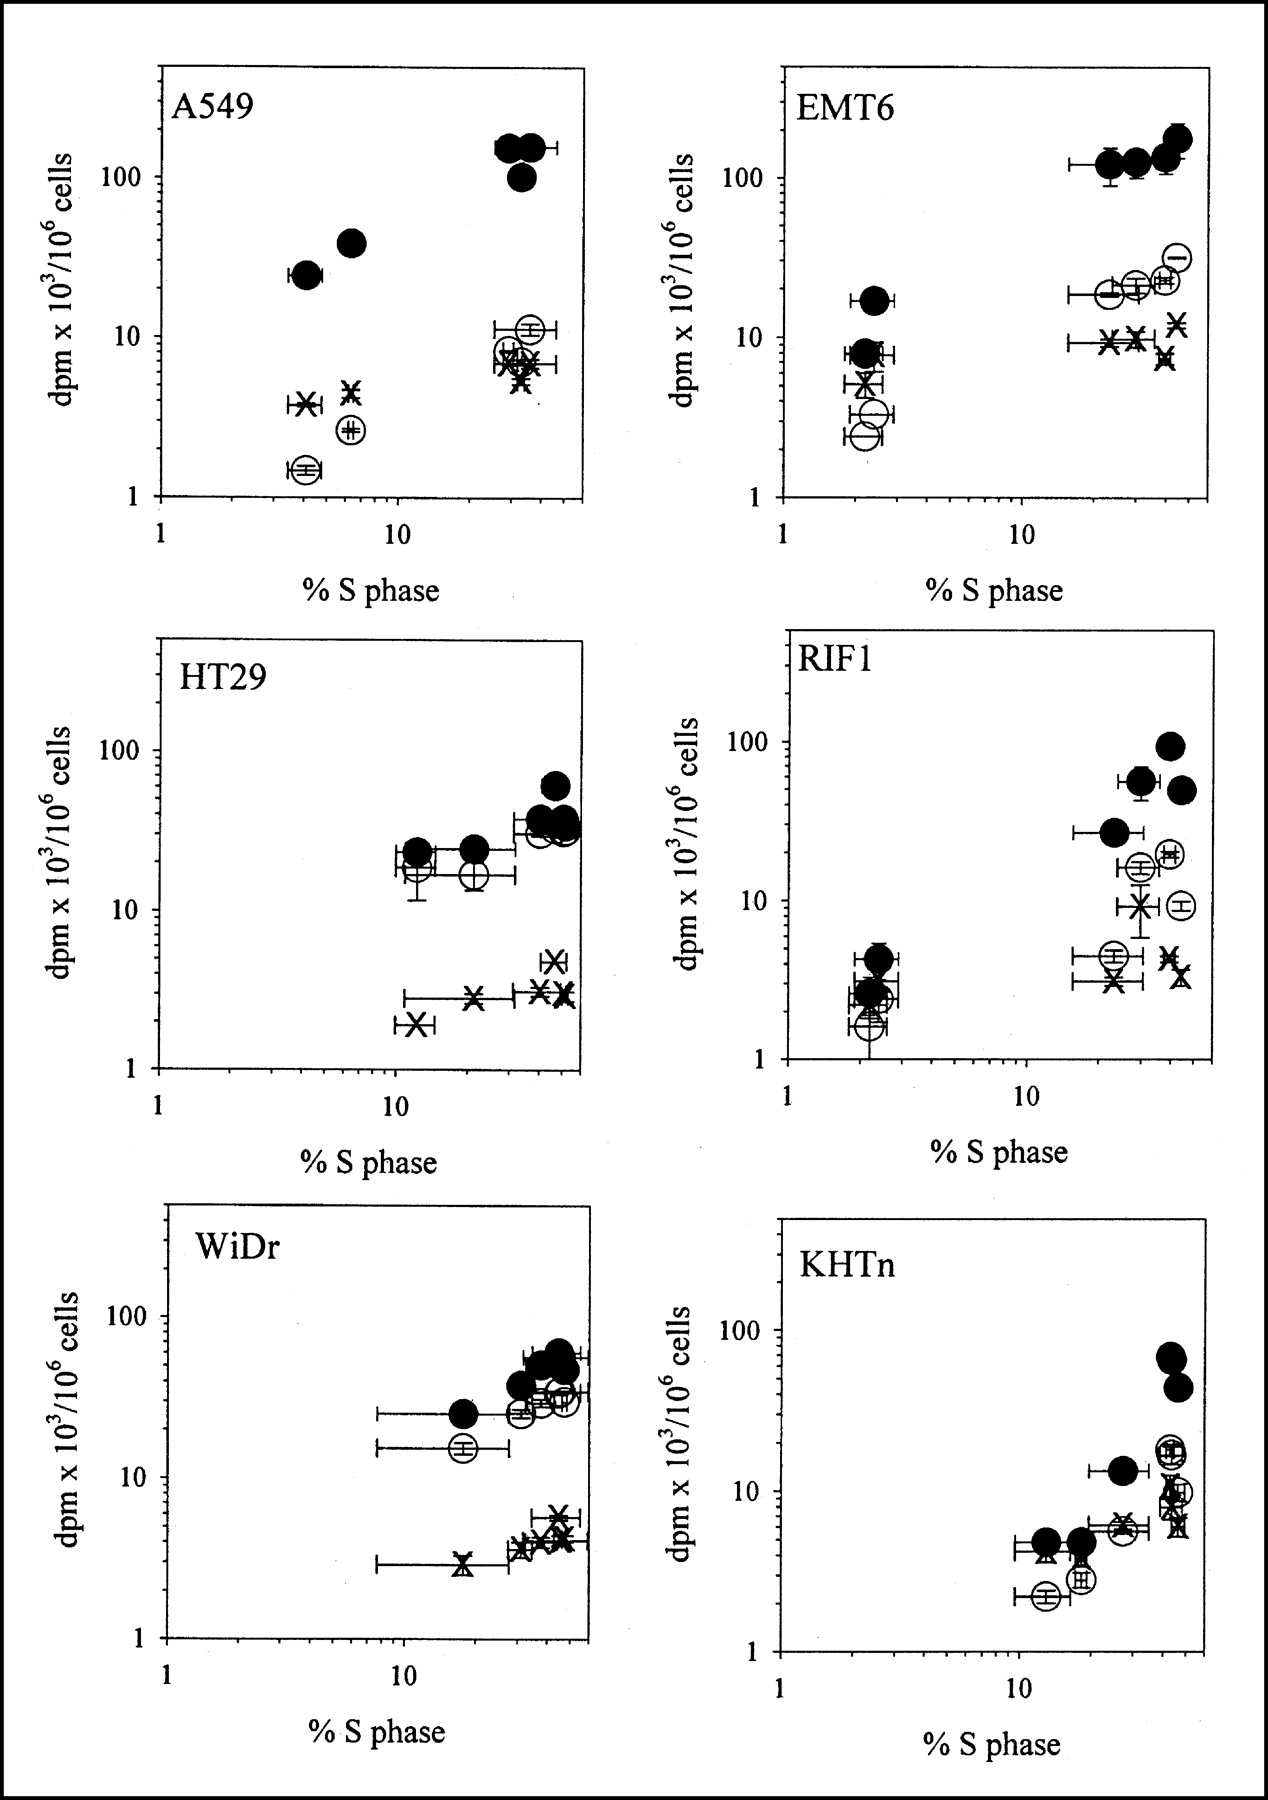
Comparisons between S-phase fraction and tracer uptake (Fig. 3; Table 2) produced results and conclusions similar to those for TK1 activity and tracer uptake. The correlation between TdR uptake and S-phase fraction (r2 = 0.26) improved considerably when results were normalized to plateau-phase levels (r2 = 0.66), and this improvement was driven by results from A549, HT29, WiDr, and EMT6. The correlation between S-phase fraction and FLT uptake when normalized to plateau-phase levels was 0.63, and that value improved to 0.73 when just A549, HT29, WiDr, and EMT6 were considered. The slope of the line for the normalized data was 0.59 ± 0.03, a value that was about half that for TdR. FMAU uptake and S phase showed no significant correlations unless A549, HT29, WiDr, and EMT6 were considered separately (r2 = 0.25). The slope of this line was 0.04 ± 0.001, a value that is only about 4% of the value for TdR uptake.

Comparison between tracer uptake (disintegrations per minute × 103/106 cells) and S-phase fraction. Results are mean ± SD for 2–4 independent measurements. ○ = FLT; × = FMAU; • = TdR.
DISCUSSION
The power of PET imaging depends on the specificity and biochemistry of the tracer as well as the nature of the process targeted in vivo. In the present study, we examined 3 PET tracers of cell proliferation: TdR, FLT, and FMAU. All 3 tracers depend on initial phosphorylation by TK1. We therefore began with an analysis of the relationship between cell proliferation and TK1 activity. Of the 6 cell lines studied, only 4—A549, WiDr, HT29, and EMT6—showed a strong TK1 dependence on proliferation. And it was for these 4 cell lines that tracer uptake could detect changes in proliferation. In KHTn and RIF1, for which proliferation is less dependent on TK1, correlations between tracer uptake and TK1 activity were poor. Perhaps these 2 cell lines depend more on de novo nucleotide synthesis pathways than on the salvage pathway. Clearly, the TK1 dependence of cell proliferation has a profound influence on the ability of TdR or TdR analogs to detect differences in tumor cell proliferation.
We also noted cell line-specific variations in the relationship between TK1 activity and tracer uptake. Some of this variation might reflect alterations in the cell cycle-dependent control of TK1 expression or a loss of cell cycle checkpoint controls in some of these tumor cells. Thus, while A549, EMT6, KHTn, and RIF1 all arrest in the G1 phase in plateau-phase cultures, HT29 and WiDr have relatively larger fractions of S-phase cells and correspondingly larger TK1 activities when in a quiescent growth phase. The small changes in tracer uptake from plateau phase to exponential growth that were seen in WiDr and HT29 cells were due to the relatively high levels of S-phase cells and TK1 activity in these plateau-phase cultures. Normalizing results to plateau-phase levels eliminated most of this variability.
The variability in tracer uptake raises questions as to how best to interpret clinical images. Average or maximum standardized uptake values might be misleading. Specifically, low standardized uptake values might reflect tumor cells with intact cell cycle checkpoint controls or cells with low TK1 values that are independent of proliferation rate. Further study is needed to evaluate how best to interpret these images.
Of the 3 tracers studied, TdR and FLT best tracked changes in proliferation. There were up to 20-fold increases in TdR uptake and up to 10-fold increases in FLT uptake as cells moved from the plateau phase to exponential growth. FLT uptake was about half of TdR uptake. Correlations between FMAU and either TK1 or S-phase fraction were poor, probably because FMAU uptake was only about 2% of TdR levels. The low levels of FMAU uptake likely reflect the fact that FMAU is a poorer substrate for TK than is either TdR or FLT.
CONCLUSION
The complexity of tumor cell biology complicates interpretation of clinical PET observations and requires cautious approaches to interpreting images. However, in cell lines that show a strong TK1 dependence for proliferation, phosphorylation of TdR or FLT can accurately detect changes in TK1 activity and proliferation.
Acknowledgments
This work was supported by grants CA34570 and CA42045 from the National Institutes of Health.
Footnotes
Received Jun. 9, 2003; revision accepted Sep. 8, 2003.
For correspondence or reprints contact: Jeffrey L. Schwartz, PhD, University of Washington Medical Center, Box 356069, Seattle, WA 98195-6069.
E-mail: jschwart{at}u.washington.edu
REFERENCES
In this issue


Jump to section
Related Articles
Cited By...
- Plasma Thymidine Kinase Activity as a Biomarker in Patients with Luminal Metastatic Breast Cancer Treated with Palbociclib within the TREnd Trial
- Assessment of Cellular Proliferation in Tumors by PET Using 18F-ISO-1
- Pharmacodynamic Study Using FLT PET/CT in Patients with Renal Cell Cancer and Other Solid Malignancies Treated with Sunitinib Malate
- Antitumor Activity of Ridaforolimus and Potential Cell-Cycle Determinants of Sensitivity in Sarcoma and Endometrial Cancer Models
- Gastric Cancer Growth Control by BEZ235 In Vivo Does Not Correlate with PI3K/mTOR Target Inhibition but with [18F]FLT Uptake
- Tumor 3'-Deoxy-3'-18F-Fluorothymidine (18F-FLT) Uptake by PET Correlates with Thymidine Kinase 1 Expression: Static and Kinetic Analysis of 18F-FLT PET Studies in Lung Tumors
- Quantitative Analysis of Thymidine Kinase 1 and 5'(3')-Deoxyribonucleotidase mRNA Expression: The Role of Fluorothymidine Uptake
- Different Modes of Transport for 3H-Thymidine, 3H-FLT, and 3H-FMAU in Proliferating and Nonproliferating Human Tumor Cells
- Noninvasive Imaging of Endogenous Neural Stem Cell Mobilization In Vivo Using Positron Emission Tomography
- Radiopharmaceuticals in Preclinical and Clinical Development for Monitoring of Therapy with PET
- Changes in Tumor Metabolism as Readout for Mammalian Target of Rapamycin Kinase Inhibition by Rapamycin in Glioblastoma
- 3'-Deoxy-3'-[18F]Fluorothymidine Positron Emission Tomography Is a Sensitive Method for Imaging the Response of BRAF-Dependent Tumors to MEK Inhibition
- Imaging-Guided Gene Therapy of Experimental Gliomas
- 18F-Fluoro-L-Thymidine and 11C-Methylmethionine as Markers of Increased Transport and Proliferation in Brain Tumors
- Reproducibility of 3'-Deoxy-3'-18F-Fluorothymidine MicroPET Studies in Tumor Xenografts in Mice
- Comparison of 18F-FLT PET and 18F-FDG PET in Esophageal Cancer
- Kinetic Modeling of 3'-Deoxy-3'-Fluorothymidine in Somatic Tumors: Mathematical Studies
- Kinetic Analysis of 3'-Deoxy-3'-Fluorothymidine PET Studies: Validation Studies in Patients with Lung Cancer
- Monitoring Antiproliferative Responses to Kinase Inhibitor Therapy in Mice with 3'-Deoxy-3'-18F-Fluorothymidine PET
- Head and Neck Cancer: Meeting Summary and Research Opportunities