


Abstract
We present a method to measure the regional rate of cellular proliferation using a positron-emitting analog of thymidine (TdR) for human imaging studies. The method is based on the use of 3′-deoxy-3′-18F-fluorothymidine (FLT) to estimate the flux of TdR through the exogenous pathway. The model reflects the retention of FLT-monophosphate (FLTMP), which is generated by the phosphorylation of FLT by thymidine kinase 1 (TK1), the initial step in the exogenous pathway. Methods: A model of FLT kinetics has been designed based on the assumptions of a steady-state synthesis and incorporation of nucleotides into DNA, an equilibration of the free nucleoside in tissue with the plasma level, and the relative rates of FLT and TdR phosphorylation from prior data using direct analysis with in vitro assays. A 2-compartment model with 4 rate constants adequately describes the kinetics of FLT uptake and retention over 120 min and leads to an estimation of the rate of cellular proliferation using the measured FLT blood clearance and the dynamic FLT uptake curve. Results: Noise characteristics of kinetic parameter estimates for 3 tissues were assessed under a range of conditions representative of human cancer patient imaging. The FLT flux in these tissues can be measured with a SE of <5%, and FLT transport can be estimated with a SE of <15%. Abbreviating the data collection to 60 min or neglecting k4, giving a 3-parameter model, results in an unsatisfactory loss of accuracy in the flux constant in tumor simulations. Conclusion: These analyses depict model behavior and provide expected values for the accuracy of parameter estimates from FLT imaging in human patients. Our companion paper describes the performance of the model for human data in patients with lung cancer. Further studies are necessary to determine the fidelity of KFLT (FLT flux) as a proxy for KTDR (thymidine flux), the gold standard for imaging cellular proliferation.
Imaging cellular proliferation to assess the growth in cancer holds great clinical promise. Prior studies using 11C-thymidine for imaging cellular proliferation showed the potential value of TdR PET and demonstrated the ability to assess tumor proliferation in vivo (1–6). The advantage of labeled TdR as a proliferation tracer is that the native compound is incorporated into DNA through the exogenous pathway, for which there is an established body of knowledge based on years of laboratory investigation (7). The short half-life of 11C and the in vivo generation of labeled metabolites have limited its clinical utility. However, analogs of TdR with less catabolism, which are radiolabeled with a longer half-life, may also provide estimates of flux through the exogenous pathway. 3′-Deoxy-3′-18F-fluorothymidine (FLT) is a thymidine analog that is phosphorylated by thymidine kinase 1 (TK1), a rate-controlling enzyme in the salvage pathway. In contrast to thymidine, FLT does not degrade in vivo. While FLT nucleotides are not incorporated into DNA, they are trapped in cells. We propose a model to assess the rate of cellular proliferation by estimating the flux of FLT from blood into phosphorylated nucleotide pools in tumors. Other groups (8,9) have proposed an analysis method based on compartmental modeling using 3 rate parameters. Our analysis for FLT PET differs by generating rate parameters that are based on known biochemistry. We have analyzed model behavior and the accuracy of parameter estimates. Modeling and parameter analysis are presented in this report, with the results from human studies appearing in a companion report (10).
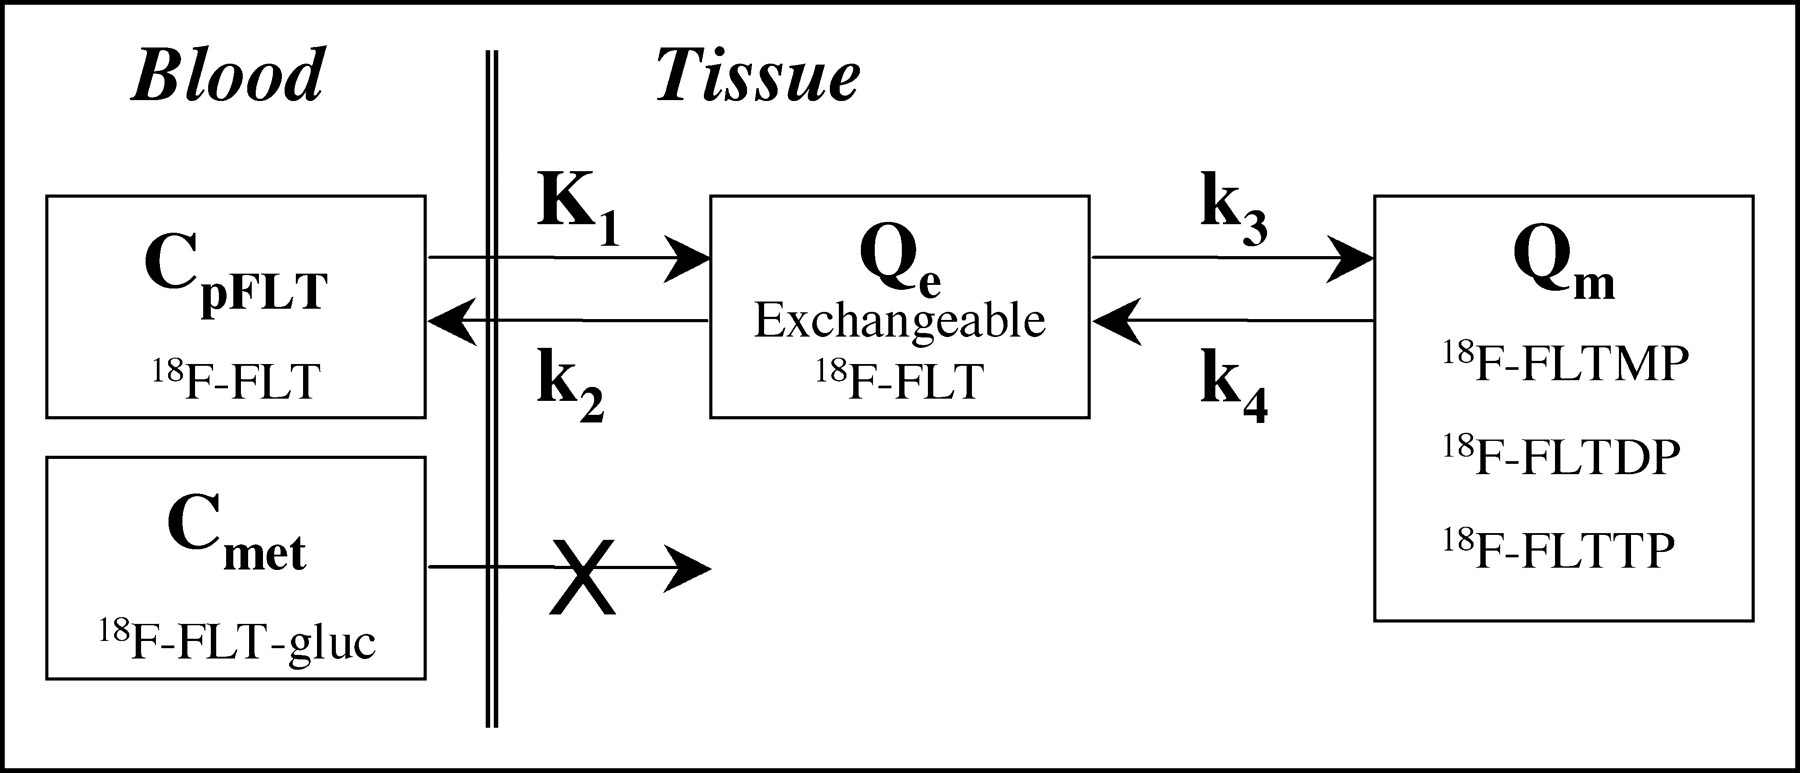
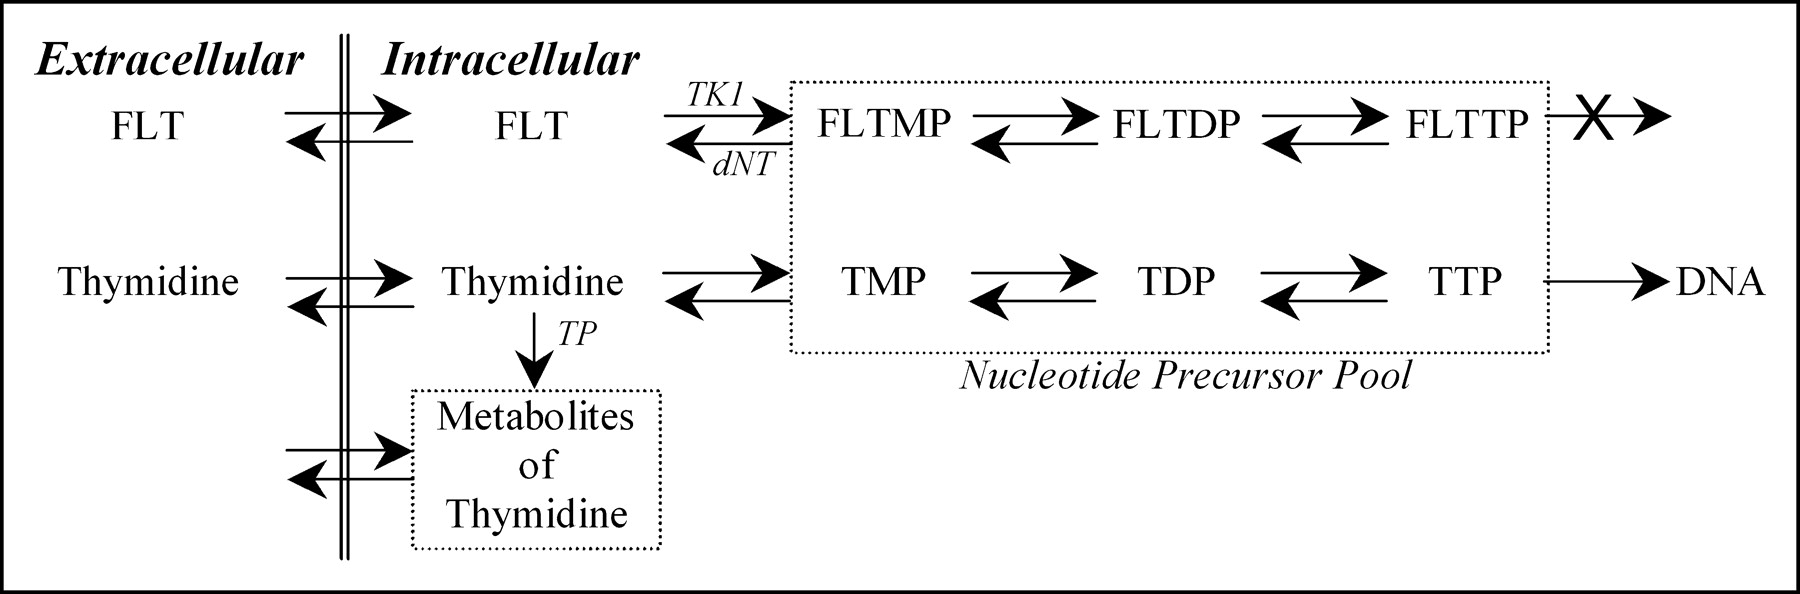
FLT is transported between blood and cells by the same nucleoside transporters as thymidine (11), along with a small amount of facilitated diffusion. Once intracellular, FLT tracks the salvage pathway of DNA synthesis and undergoes the same early fate as thymidine, which is phosphorylation by TK1. FLT directly competes with thymidine for TK1 phosphorylation. TK1 activity is directly linked to cellular biosynthesis, where it has been shown to increase 10-fold during the DNA synthetic (S phase) part of the cell replication cycle (12–14). The phosphorylated product of TK1 metabolism, FLT-monophosphate (FLTMP), is retained in tissues (15) and may continue to be phosphorylated to FLT-diphosphate (FLTDP) and FLT-triphosphate (FLTTP) (Fig. 1). At this point in the pathway to DNA, FLT differs from thymidine. FLTTP is not incorporated into DNA (11) because of the 3′ substituent and its metabolism goes no further in the exogenous pathway. Because FLTTP is not incorporated into DNA, the rate-limiting step for FLT retention is the initial phosphorylation by TK1 (15). Phosphorylated FLT can be dephosphorylated back through the pathway to FLT by 5′-deoxynucleotidase enzymes. However, this occurs at a slow rate relative to TK1 activity (11,16,17). Thus, the retention of FLT nucleotides is a measure of the TK1 activity.

Biochemical fate of FLT is similar to native thymidine but with 2 important distinctions for modeling flux through the DNA salvage pathway: (a) FLTTP is not incorporated into DNA and (b) FLT does not generate significant metabolites during the imaging procedure as does native thymidine. TMP, TDP, and TTP represent mono-, di-, and triphosphates of thymidine. Enzymes identified in pathways are TK1 = thymidine kinase 1; dNT = 5′(3′)-deoxyribonucleotidase; TP = thymidine phosphorylase.
Since TK1 is a control point in the salvage pathway, assessing the uptake and retention of FLT through TK1 enzyme activity provides a direct association with cellular proliferation. The use of FLT to measure flux through the thymidine salvage pathway is similar to the use of the glucose analog FDG to assess the glucose metabolic rate. FLT tracks a control point of metabolism but does not continue on the metabolic pathway to DNA, just as metabolism of FDG does not continue beyond the hexokinase reaction.
MATERIALS AND METHODS
Description of Model
The proposed kinetic model of FLT metabolism is similar in design to our previously validated kinetic model for thymidine uptake in somatic tumors (18,19), but without compartments for labeled metabolites. The schematic and symbols of the FLT model are presented in Figure 2 and Table 1, respectively. The model for FLT requires 2 tissue compartments and is driven by a single input, the FLT blood clearance function. Four rate parameters describe the transfers into and out of each of these compartments.
Kinetic model of FLT metabolism is comprised of an exchangeable tissue compartment (Qe) and a compartment of trapped FLT phosphorylated nucleotides (Qm). Four rate constants describe kinetic transfer rates between the 2 compartments and blood. FLT-gluc = FLT-glucuronide; CpFLT = concentration of FLT in arterial plasma; Cmet = concentration of metabolites in arterial plasma.
Definition of Parameter Abbreviations
FLT and thymidine in plasma share a common transport system reflected by the parameter K1. The exchangeable tissue compartment (Qe) models the initial transfer of FLT from blood into cells entering a common precursor pool shared by FLT, thymidine, and other pyrimidine nucleosides. From this pool FLT exchanges freely between the extracellular volume and blood or it continues to be metabolized. The second compartment (Qm) reflects retention of FLT in the tissue. This compartment includes FLTMP, FLTDP, and FLTTP that are retained in the cell but are not incorporated into DNA. The rate-limiting step for entry into this compartment, represented by k3, is phosphorylation by TK1 to yield FLTMP. In vitro studies have shown that the phosphorylated product FLTMP can be converted back to FLT by 5′(3′)-deoxyribonucleotidase (dNT) (16,17), a mechanism by which FLT can potentially leave the imaging region of interest (ROI). Dephosphorylation can be represented in the model by the rate parameter k4.
FLT is not a substrate for thymidine phosphorylase, the enzyme that breaks the bond between the pyrimidine and deoxyribose. However, FLT is glucoronidated in the liver and then delivered to the blood. FLT-glucuronide is restricted to the vascular space and is cleared by the kidneys. A sizeable fraction of the total plasma activity appears in the form of FLT-glucoronide late in the imaging sequence, so that the total plasma activity during the imaging study becomes a combination of FLT and FLT-glucoronide. No other labeled metabolites of FLT have been observed in human plasma (8,11,20). The proportion of FLT present as the glucuronide in plasma can be assessed by chromatographic analysis. The information is used to derive the metabolite-corrected time course of FLT activity in plasma. The whole blood and plasma activity concentrations have been reported to be statistically identical, showing no partitioning (8,10). The FLT plasma clearance curve provides the input to the compartmental model to characterize FLT tissue uptake. The total blood activity curve is also used in the modeling process to account for the contamination of vascular activity within each PET image region.
The essential features of the model are founded on the biochemical behavior of FLT described here. The application of our model to the estimation of regional cellular proliferation requires some additional assumptions:
The model is applicable to regions of tissue that are homogeneous with respect to blood flow, rates of transport, concentrations of FLT, TdR, and FLTMP, and the synthetic rate of DNA.
FLT and FLTMP are present in tracer amounts and do not perturb flux through the thymidine salvage pathway.
The free FLT in each homogeneous tissue element is present in a single compartment, which assumes that transport is rapid compared with metabolism. The concentrations are those of the precursor pools for either the TK1 reaction or transport (18).
The rate of synthesis of DNA is at steady state. The TdR concentration, the incorporation rate of TdR into DNA, and the concentrations of TdR nucleotides remain constant during the imaging procedure.
The capillary concentrations of FLT and TdR are approximately equal to the arterial plasma concentration (18)—that is, there is no gradient across capillary membranes. This implies that measurements performed on arterial blood samples represent values at the capillary membrane and in the interstitial fluid and, therefore, reflect the concentration available for transport into cells.
An essential premise of the imaging experiment is that FLTMP and other FLT-phosphates are trapped in the tissue for the duration of the imaging study. Grierson et al. (17) observed in a lung carcinoma cell line (A549) that the phosphorylated products are essentially retained in the cell with negligible activity measured in the extracellular fluid. Basic cell studies suggest that phosphorylated intermediates, such as nucleotides, would not be observed in blood (17). Our group has also measured the slow rate of dephosphorylation of FLTMP by dNT (17). Others have characterized the relative rate of phosphorylation by TK1 for TdR and FLT, providing biochemical data for modeling FLT (14,21,22).
Anytime after injection of FLT, the total concentration of FLT in tissue, Ct, is comprised of the sum of the amounts of free FLT in the precursor pool, Qe, and in phosphorylated products of FLT, Qm:
 Eq. 1 where Vp is the fraction of vascular space within the tissue region (mL/g), Cptot is the concentration of radioactivity in the plasma (mBq/mL), and ρ is the tissue-specific gravity (g/mL).
The rate of change of the amount of free FLT in the tissue, dQe/dt, is equal to the difference between the rate of accumulation of FLT by transport into tissue from plasma or from dephosphorylation of FLTMP, the rate of loss of FLT by transfer of intracellular FLT back to the plasma, or phosphorylation by TK1 to provide FLTMP. The following equation applies:
 Eq. 2 where CpFLT is the concentration of FLT in arterial plasma, and K1 (mL/min/g), k2 (min−1), k3 (min−1), and k4 (min−1) are respectively, the rate constants for the transfer of FLT into the cellular compartment; the transfer of unmetabolized FLT from the cellular compartment back into blood; the phosphorylation of FLT by TK1, leading to nucleotides that are retained in the cell; and the dephosphorylation of FLTMP by dNT to FLT, which can then potentially leave the cell.
The initial transfer constant in the model, K1, reflects the net transport of FLT from blood through various barriers into cells. There is negligible protein binding of FLT or TdR in the blood (23). CpFLT is the average capillary concentration of FLT and is assumed to be the FLT concentration in peripheral arterial plasma. A similar assumption that arterial plasma thymidine concentration reflects the capillary concentration was used in the determination of the synthetic rate of DNA from TdR uptake (18). K1 is comprised of blood flow, diffusion into the interstitial space, and nucleoside membrane transport (24–26). In somatic tissues, transport of thymidine into the cell is rapid (27) and K1 reflects primarily blood flow (18,28). Transfer of FLT is similar to the transport of thymidine and involves facilitated diffusion through both equilibrative and concentrative transporters (26,29). Equilibrative transporters, predominantly found in human tumor cell lines, are thought to be the primary process mediating the facilitated influx and efflux of nucleosides (24,29).
FLT can also leave the tissue by way of a similar transport process in the reverse direction, k2 in the model. However, once FLT is in the tissue, it can also be phosphorylated to FLTMP by TK1. This process is represented in the model by transfer from Qe to the compartment Qm. The transfer constant for this phosphorylation reaction is given by k3 and characterizes the rate-limiting step in the uptake and retention of FLT (11,15,30). Qm includes the additional trapped intermediates FLTDP and FLTTP (Fig. 1), but these are not rate-limiting steps. These intermediates may also be dephosphorylated back through the pathway to FLTMP. The rate constant k4 describes the reverse reaction catalyzed by dNT to yield FLT, which then has the possibility of leaving the PET ROI mostly through the same equilibrative transporter or passive diffusion process. The mathematic description of the rate of change of FLT nucleotides as a function of time, dQm/dt, is given by the following formula:
 Eq. 3
Eq. 3
Equations 1–3 provide the basis for the determination of the rate constants K1, k2, k3, and k4. They describe the time course of the total amount of radioactivity in the tissue as a function of time. The total concentration of FLT predicted by the model (Ct) is fitted to the measured concentration of FLT for each time point from the dynamic PET sequence, Ci. A nonlinear least-squares optimization process based on the Levenberg-Marquart approach computes the best-fitting values of the kinetic parameters. This method minimizes the weighted sum of the square error (WSSE) using a weighting function (ω) derived from the total counts of a PET image ROI in a time frame and the duration of the time frame (31):
 Eq. 4
Eq. 4
The FLT flux estimated by the model is given by the product of the transport rates of FLT from blood to tissue and phosphorylation of FLT by TK1 divided by the sum of the rates of efflux from the exchangeable tissue compartment. This FLT model composition is similar to the FDG model proposed by Sokoloff et al. (32) and the TdR model proposed by Mankoff et al. (18). By analogy, the flux constant for the proposed FLT model is calculated using Equation 5:
 Eq. 5
Eq. 5
The model of FLT kinetics described here assumes no local metabolism of FLT other than phosphorylation. Thus, the model would be inappropriate for the liver, where metabolism produces FLT-glucoronide that is able to leave the tissue region and enter the blood. Under these conditions, the assumption that retention is correlated with TK1 activity would not hold, and an alternative model would have to be proposed and validated.
Parameter Ranges and Typical Values
In any compartmental model, it is necessary to establish the range of realistic parameter values expected in typical imaging conditions (Table 2). Of the parameters used to calculate KFLT in Equation 5, the expected values can be estimated from previously published rates. The transport of FLT, K1, can be estimated from the transfer constant of thymidine from blood through several barriers into the tissue. We previously estimated a typical K1 for thymidine in proliferating tissue of 0.20 mL/min/g, with a range of 0.05–0.30 mL/min/g (18). Transport of FLT has been estimated in cell experiments to be approximately 0.08 mL/min/g (15), and in vivo in dogs it ranged from 0.14 to 0.22 mL/min/g (9). Because the 3 tissues examined in this study potentially have great differences in FLT uptake, the parameter ranges are expected to be wider than previous model implementations using thymidine. Therefore, we can expect the range of K1 to be wider for FLT than for TdR, but the initial model parameter should be less than TdR. We therefore use a typical value for K1 of 0.1 mL/min/g as the initial starting parameter, with a range of 0.05–0.5 mL/min/g.
FLT Model Parameters, Expected Ranges, and Starting Values
In our model of FLT kinetics, k2 represents the rate of efflux of FLT from the cellular compartment to the blood. Our initial sensitivity and identifiability assessment showed a high covariance between K1 and k2 for all 3 tissue types. Thus, as in the thymidine model, we combined these parameters in the model as K1, Vd, k3, and k4, where Vd is the volume of distribution for FLT and is defined as K1/k2 (4P or 4-parameter model). We expect free tissue FLT to be less distributed than TdR since, in the TdR model, k3 includes the incorporation into DNA. Therefore, the initial value of Vd for FLT was set at a typical value of 1 mL/g, with a range of 0.1–5 mL/g. The higher limit accounts for the possibility of concentrative transporters yielding K1/k2 ratios greater than unity.
The transfer constant k3 represents the rate-limiting step of FLT retention via the salvage pathway: FLTMP production from FLT by TK1. This is different from the thymidine model, in which the incorporation of thymidine triphosphate (TTP) into DNA is the rate-limiting step along the pathway to DNA synthesis. Based on the in vitro relationship of the Michaelis-Menten constants (Km, Vmax) between TdR and FLT with respect to TK1 activity (21,22), the phosphorylation ratio (PRTK1) of TK1 can be measured and used as a starting point for estimating the relative rate of metabolism of FLT by TK1 (33,34). The PR for TK1 can be calculated from earlier reports as 0.08 (21). From this relationship, the starting value of k3 was set at 0.1 min−1 (range, 0.001–1.0 min−1).
The activity in the metabolic compartment, Qm, includes all 3 FLT nucleotides. FLTDP and FLTTP are not available for extracellular transfer but they add to the activity of the compartment. FLTMP is the product of TK1 activity on FLT in the first few minutes, after which there is progressive production of FLTTP (17). A component of this metabolism, the dephosphorylation of FLTMP by dNT, is defined in our model as k4. It is important since FLT resulting from dephosphorylation can be lost from the tissue region through a metabolic pathway independent of the formation of FLTMP. This loss has been estimated in vitro by monitoring the egress of activity from cells labeled with FLT nucleotides over time (17). Thus, based on the in vitro data, k4 was given the initial value of 0.02 min−1 (range, 0.001–0.200 min−1). Typical values and ranges of K1, Vd, k3, and k4 that were used as the starting condition in the model optimization process are summarized in Table 2.
Model Analysis
Model Input Function.
The FLT plasma clearance curve serves as the input to the model. For use in model analysis and simulations, we estimated a typical FLT plasma clearance curve from patient results. Nine patients with arterial catheters each had 30 arterial blood samples assessed for radioactivity throughout the 120 min of imaging in the following sequence: eight 15-s, two 30-s, three 1-min, three 3-min, five 5- min, and nine 10-min samples. For each blood sample, 0.1 mL plasma was assayed for radioactivity. As reported in our companion paper, there were no statistical differences between blood and plasma for the 120-min imaging period, but the plasma curve showed less sampling variability. The 9 arterial plasma activity curves were peak normalized and time shifted to align the peak of the curves. No curve was shifted more than ±0.5 min. The average activity at each time was generated by interpolating the activity of the nearest time points. The average total blood time-activity curve was then scaled to a 185-MBq injection of FLT used in further model simulations.
Because the catabolism of FLT in the liver produces a metabolite that contributes to blood activity, the total measured activity in blood was not entirely labeled FLT during the imaging period. To assess the proportion of FLT and labeled metabolites in blood over time, an aliquot of plasma from several samples was assayed for FLT content. As previously described (10), the individual curves for FLT fraction versus time after injection were empirically fitted to a monoexponential function. An average curve for FLT blood clearance, accounting for metabolites, was generated to provide the FLT input function (CpFLT) used for further modeling analysis.
The proposed model was evaluated to determine the extent to which the information obtained from a typical imaging study is sufficient to produce a unique solution with identifiable parameters. The model was characterized with respect to parameter sensitivity, identifiability, and susceptibility to noise to establish the most reliable approach for parameter estimation.
Sensitivity Analysis.
Sensitivity analysis measures the degree to which a change in an individual input parameter results in a change in the output of a model. Sensitivity functions for each parameter in the model were generated by determining the change in model output resulting from a 1% deviation in the parameter using the following formula (35):
 Eq. 6 where δTAC(t) is the difference in the model output of the time-activity curves resulting from a ±1% change in the parameter k (δkα/kα = 0.02) at time t, TAC(t) is the activity in the tissue (time-activity curve) predicted by the model at time t. The starting parameter values given in Table 2 are based on our initial analysis of human studies (10). The parameter values used for sensitivity analysis produced a simulated curve representative of an average uptake profile for 3 different representative tissues: marrow, tumor, and muscle.
Transfer of FLT into the tissue, washout of unmetabolized FLT, phosphorylation by TK1 to FLTMP, and dephosphorylation of FLTMP to FLT all influence the curve and each has its maximal influence on the time-activity curve at different times. Some changes are opposite in sign to others, suggesting some capacity for the model to estimate each parameter. The required length of the experimental data collection and analysis may be indicated from the sensitivity functions. When parameter sensitivity to the model solution is not changing for a long duration near the end of the scan, the imaging time may be shortened without sacrificing information.
If each of the sensitivity functions for the parameters are sufficiently different over time, then the parameters are identifiable. To test the ability of the model to estimate parameters independently, we used identifiability analysis of the sensitivity curves to generate a sensitivity matrix as previously described (18,36,37). Each element in the sensitivity matrix represents the covariance of any 2 parameters to produce a change in the output of the model. The sensitivity matrix was inverted and normalized to give the correlation matrix with values that range from −1 to 1. Pairs of parameters within the correlation matrix elements close to ±1 will have estimates that covary considerably and are therefore difficult to estimate independently.
Monte Carlo Error Analysis.
The expected SDs of the rate constants and of the macroparameters (Vd, KFLT) were derived using a Monte Carlo technique (38) and simulated tissue time-activity curves. Poisson noise was added to each simulated time-activity curve based on a level derived from the total counts and the duration of each time frame (31). Briefly, each tissue curve was re-sampled based on the noise characteristics at each time frame, and the optimization process was repeated 200 times. The SD of the tabulated parameter estimations from each run was then determined. The bias and coefficient of variation (COV) of each parameter were computed for each tissue type, which gives an approximation of the parameter error.
Model Accuracy.
To investigate the ability to estimate key parameters of FLT metabolism accurately across the entire expected clinical range, we generated a set of noisy simulated tissue curves. The simulated PET time-activity curves were created from randomly selected parameter values inside the expected ranges typical of a tumor time-activity curve from our lung cancer patients. Each parameter was randomly sampled over a range of values observed in a study of 17 patients (10). For this analysis, 200 simulated tissue curves at high temporal resolution (0.02-min sampling) with known parameters were generated and rebinned to yield activity curves similar to our PET time frames (eight 15-s, four 30-s, six 60-s, two 5-min, and ten 10-min bins). This resulted in simulated curves with flux constants ranging between 0.005 and 0.200 mL/min/g, a range similar to that seen in our initial analysis of patient studies. Poisson noise was then added to the simulated PET curves at levels typical for clinical studies for a 185-MBq injection and a 70-kg subject. The error distribution was based on an estimation of variance in the counts using the activity and duration of each time frame in the simulated PET sequence (31,37). This approach produced a 1%–3% COV for a simulated 10-min imaging frame at 60 min, which was representative of our PET measurements in patients with lung tumors. The curves were optimized using the initial starting parameters in Table 2. The true (simulated input) and estimated parameter values were compared by examining the correlation coefficient for estimated versus true parameter, the percentage bias (the difference in the measurements for estimated vs. true parameter), and the precision (SEE for estimated vs. true parameter divided by the mean true parameter, SEE/mean), which is an approximation of the associated error for each parameter estimate. Several model conditions were examined, including the 4P model with 120 min of simulated data and a reduced dataset of 60 min. An earlier report implemented a model of FLT metabolism based on a 3-parameter model (3P) excluding k4 (k4 = 0) in the optimization process with 60 min of data (8). We examined these alternative model conditions for bias, precision, and associated error (SEE/mean).
RESULTS
Blood Input Functions and Tissue Activity Curves
Figure 3 presents the total FLT blood activity (Cptot) curve for a 185-MBq injection and the metabolite-corrected FLT input function (CpFLT). An example of each type of tissue time-activity curve (Fig. 4) reveals a wide variation in FLT uptake by tissue type. Highly proliferative tissues, such as bone marrow, show rapid and persistent uptake, whereas muscle has a much-reduced uptake.
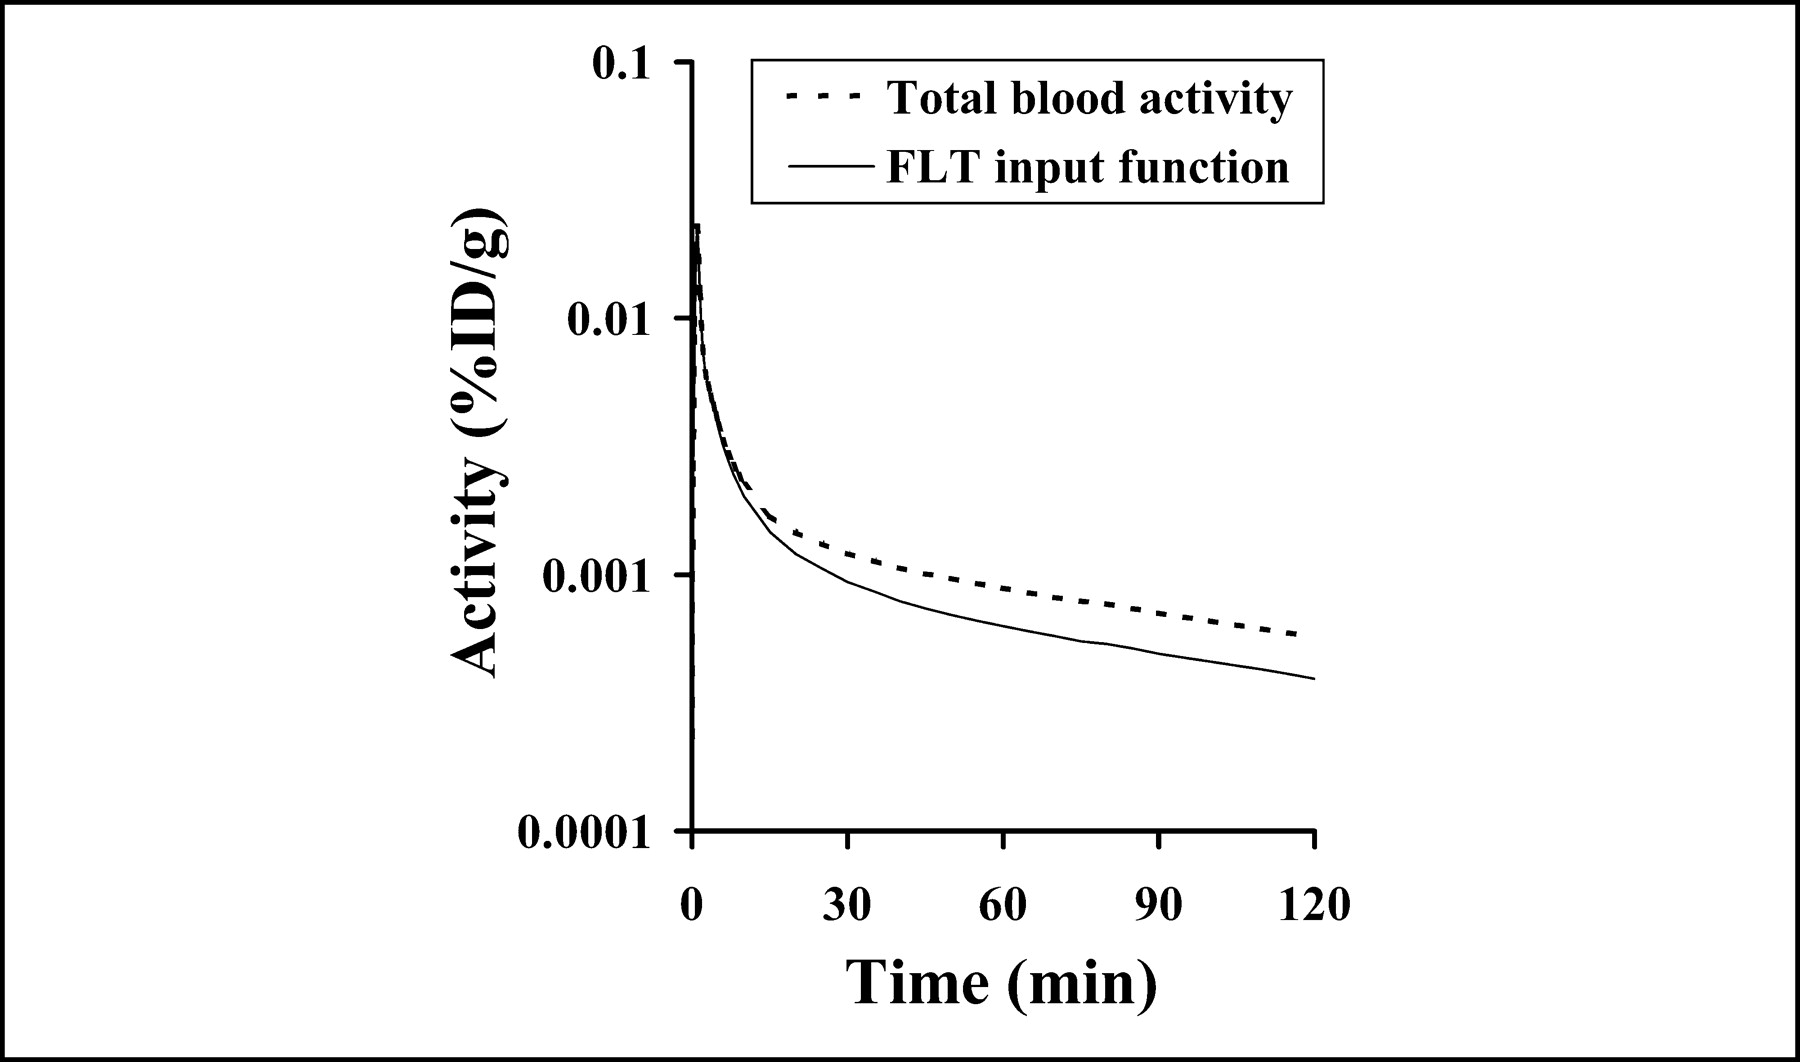
Blood clearance curve (input function) for FLT (solid line) is determined by combining total blood activity (dotted line) over time and fraction of activity associated with FLT. FLT input function applied to model presented in this report is derived from 9 patients with arterial sampling and using an independent assay to determine proportion of activity associated with FLT.
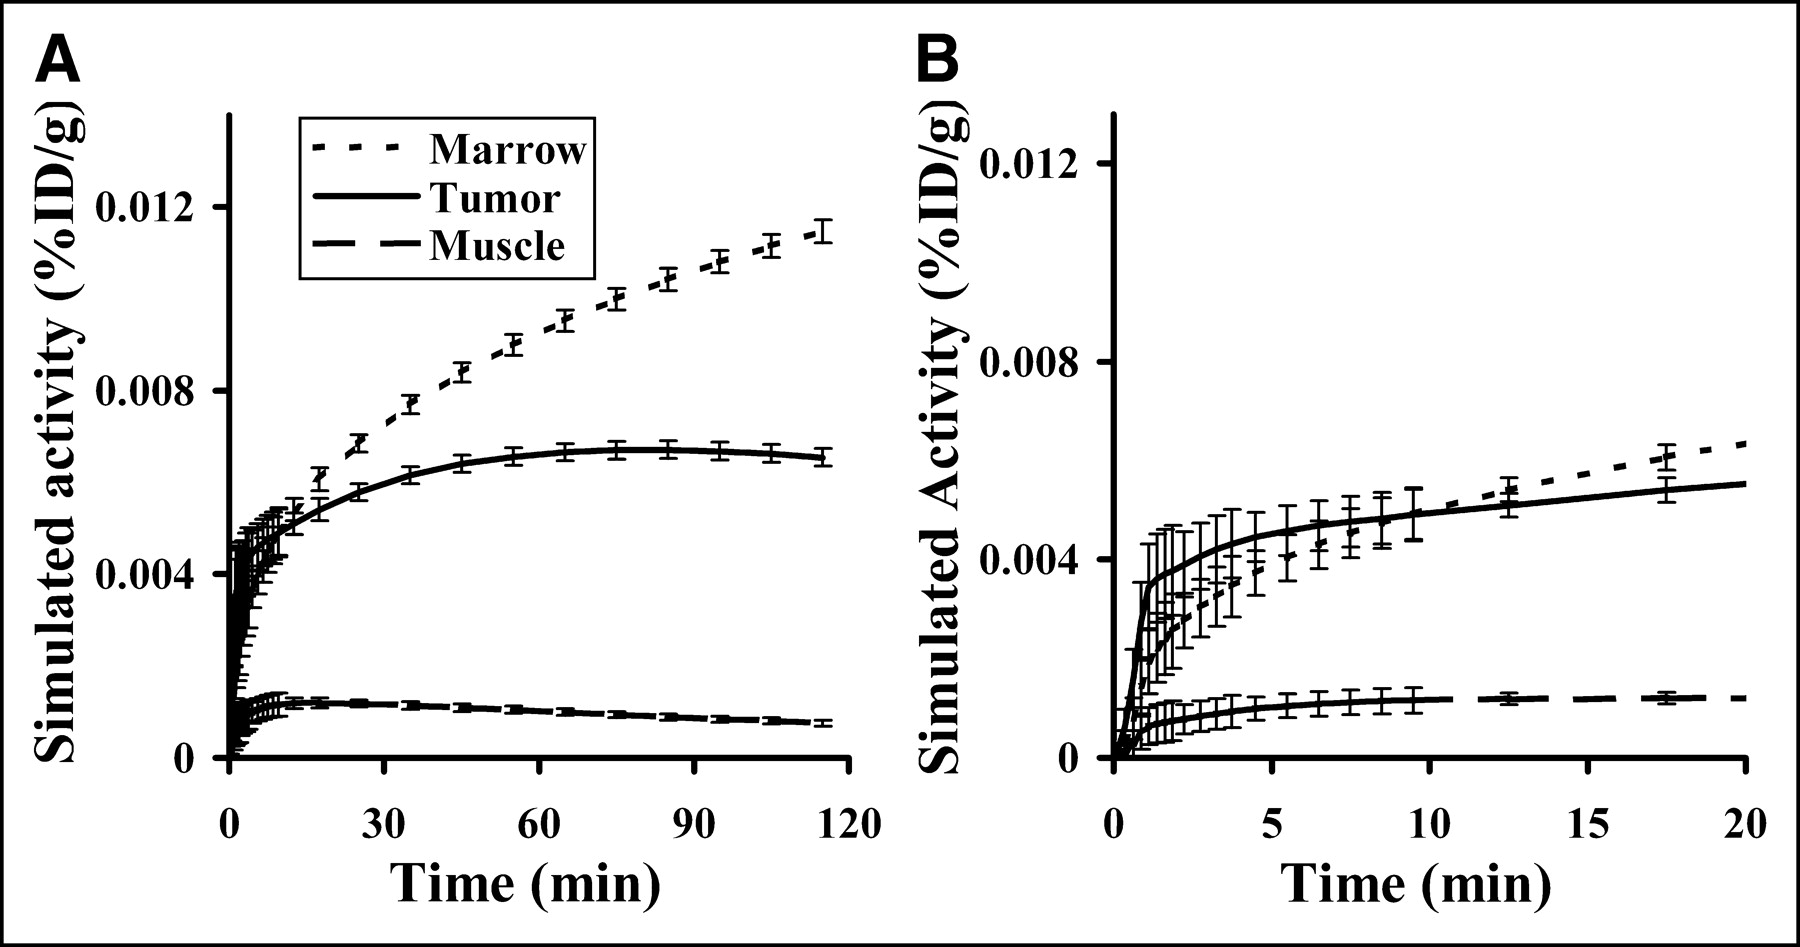
(A) Representative simulated tissue curves for marrow (dotted line), tumor (solid line), and muscle (dashed line) were based on estimated parameter values from lung cancer patients in a companion report (10). The SD at each point is based on errors observed in patient studies. (B) Expansion of curves in A, revealing the simulated error range during first 20 min.
Sensitivity Analysis
The sensitivity of each parameter versus time for marrow, tumor, and muscle is shown in Figure 5. In our analysis of the sensitivity curves, K1 and k2 (data not shown) covariances were essentially mirror images of each other, indicating a high degree of overlapping sensitivity for each parameter. Because of this result, the model was reparameterized to K1, Vd, k3, and k4 (Fig. 5), where Vd = K1/k2. For each parameter the sensitivity curves were qualitatively similar for the 3 test tissues. Marrow blood-to-tissue transfer of FLT, K1, has an apparent greater effect on FLT uptake than phosphorylation, k3, due to a large k3 indicating marrow’s large capacity to phosphorylate FLT and minimal dephosphorylation, k4. The sensitivity of K1 for tumor is similar to thymidine in magnitude and time course, with a large impact on the model output early after injection but diminishing after a few minutes. The individual parameter with the greatest sensitivity during the uptake phase of FLT, shortly after injection and equilibration of blood FLT with tissue, was k3. The low uptake in muscle results in high sensitivity for the initial distribution volume, where FLT enters and exits the tissue with minimal phosphorylation and retention. The curve shape and magnitude of k3 is similar to Vd for tumor and marrow, signifying that these variables may be difficult to estimate independently. All of the curves were relatively stable between 90 and 120 min, suggesting that imaging beyond 90 min adds little to the kinetic analysis, with exception to k4.
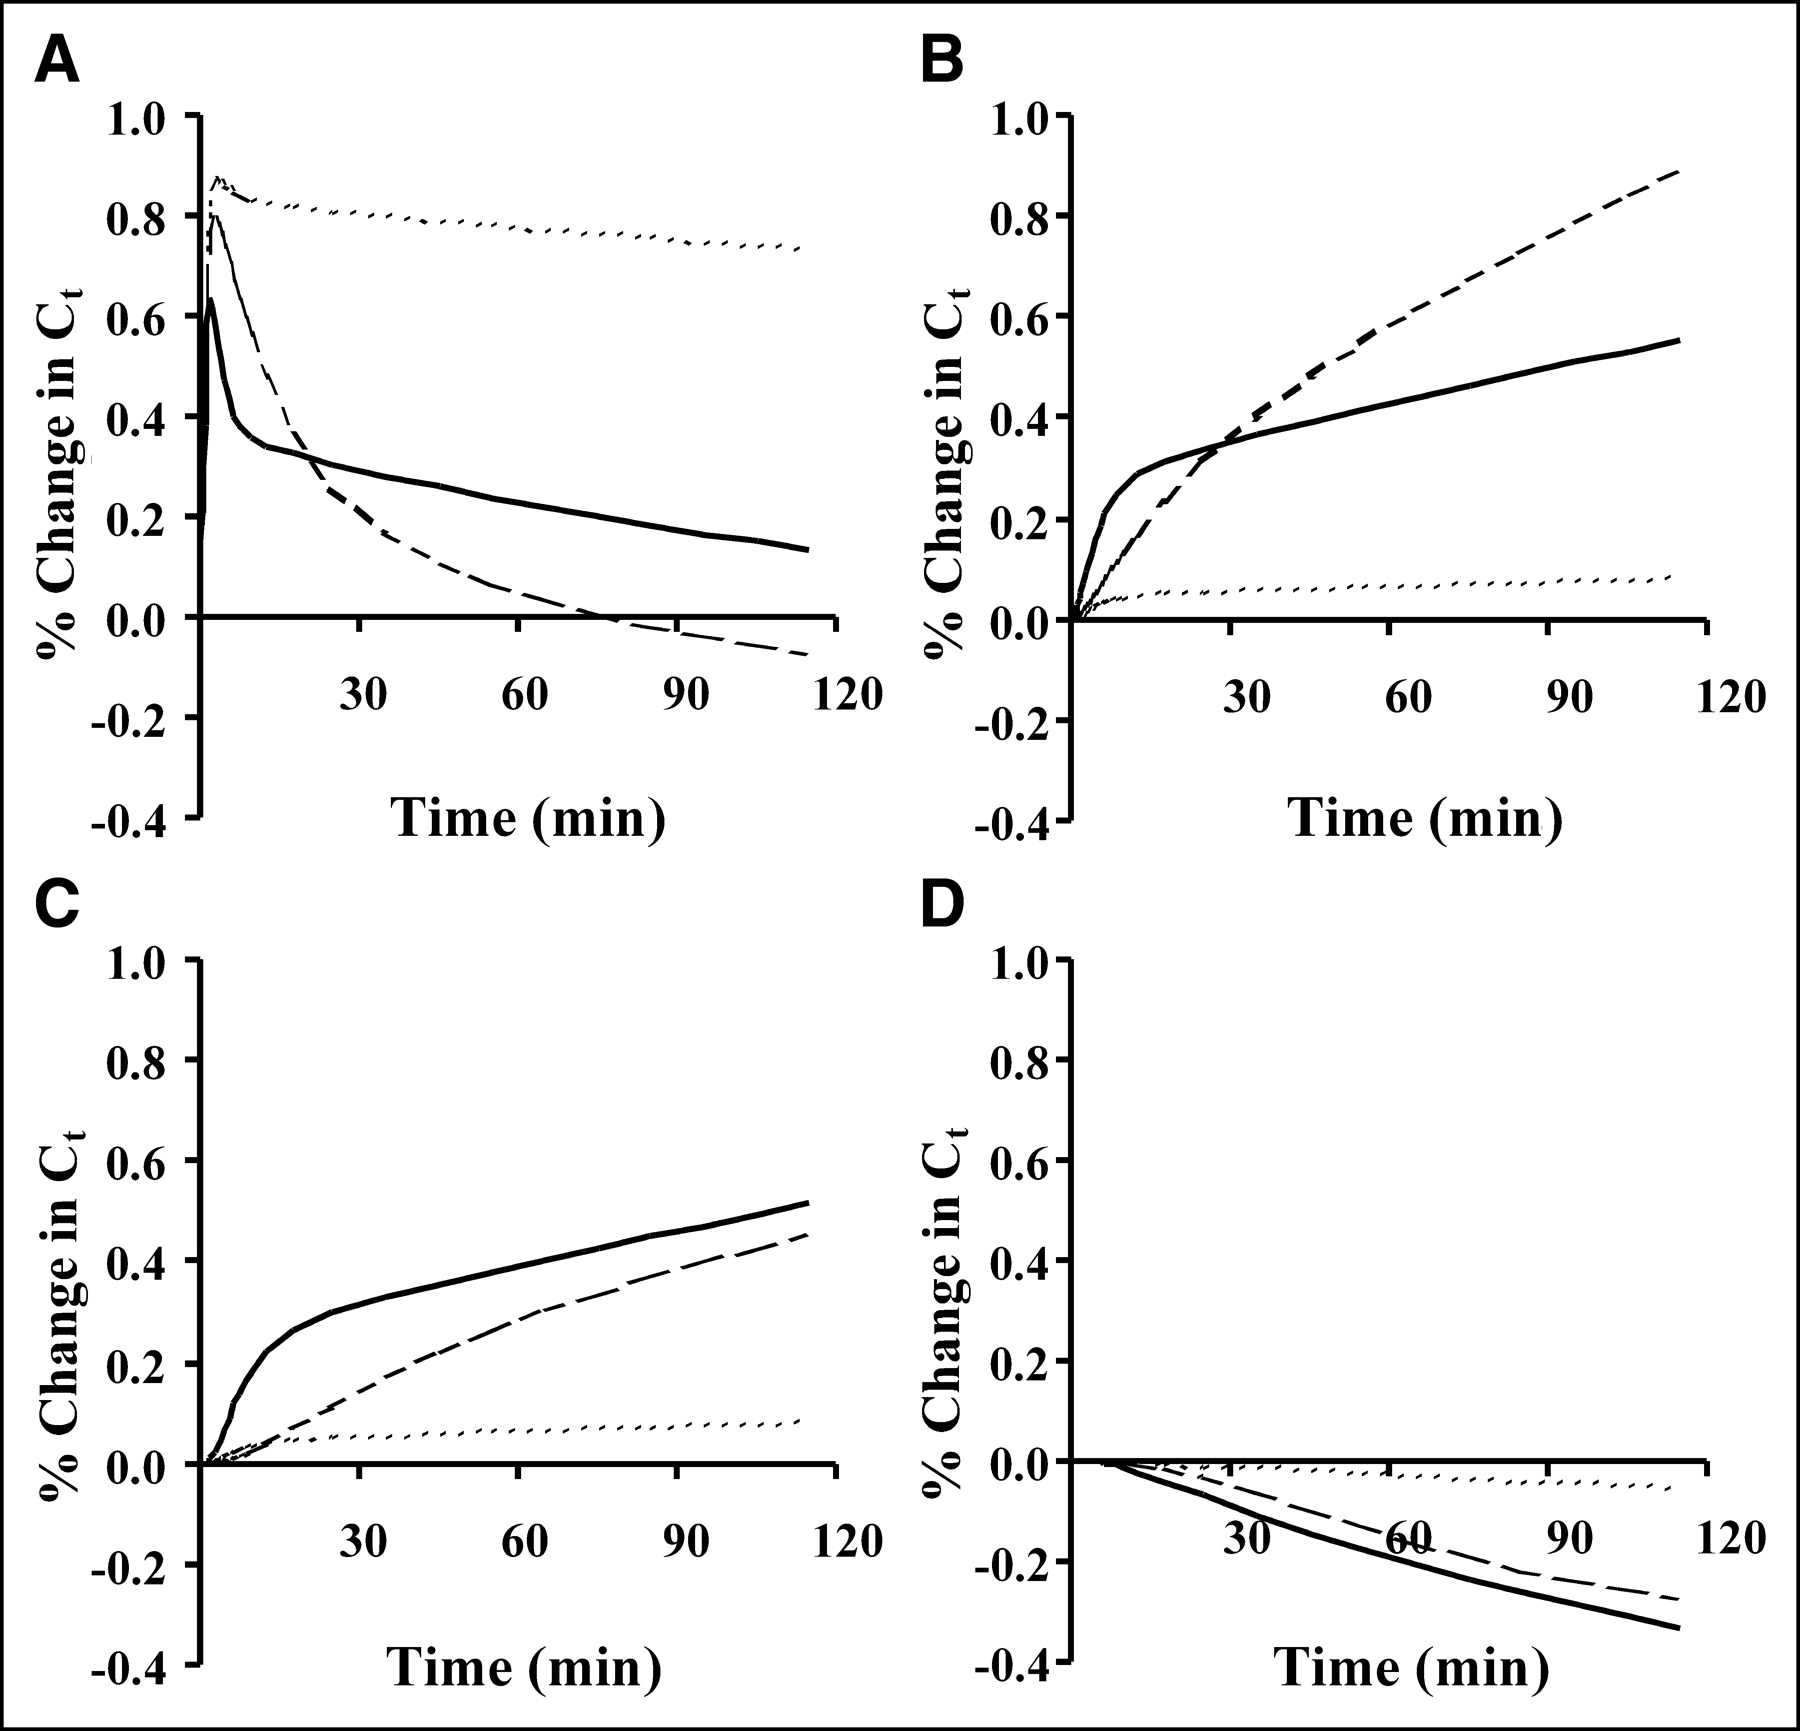
Sensitivity function represents time-dependent percentage change in model solution Ct resulting from ±1% change in parameter value. Sensitivity curves for FLT representative of 3 tissue types (marrow = dotted line, tumor = solid line, muscle = dashed line) are plotted with respect to floating model parameters K1 (A), Vd (B), k3 (C), and k4 (D). A 1% change in Ct would indicate a sensitivity function of 1 as defined in Equation 6.
Correlation Matrix and Parameter Identifiability
Correlation matrices for each tissue type are presented in Table 3. There is a high level of covariance (correlation coefficient, ±1) between k3 and Vd for the 3 tissue types. Similarly, K1 and Vd are highly correlated for marrow. This suggests that it will be difficult to obtain independent estimates of k3 and Vd.
Covariance Matrices for 3 Tissues
The results for simulations of the effect of noise on parameter estimation using the Monte Carlo approach for the 3 tissues are summarized in Table 4. In the presence of statistical noise typical for PET there is a bias and COV of <5% for the estimate of KFLT in moderate or highly proliferative tissue (tumor or marrow). The transport constant K1 showed a COV of <15% for these measurements in marrow and tumor. However, the COV is greater in muscle than in tumor or marrow that reflects the low level of FLT uptake in nonproliferating tissues.
Monte Carlo Analysis: Bias and COV
Model Accuracy and Precision
The accuracy of parameter estimates over the clinical range for tumor is shown in Figure 6 and is summarized in Table 5. The results of the simulation showed that the estimation of FLT flux is accurate over a wide clinical range using image noise similar to actual human PET data. The correlation coefficients for estimated versus true parameter values for K1 and KFLT are r = 0.94 and 0.99, respectively, reflecting robust estimates. Correlation values were lower for k3 (r = 0.73) and Vd (r = 0.30), indicating less robust estimation as predicted by the sensitivity and identifiability analysis. The bias in the estimate was 2% for K1 and about −2% for KFLT, indicating a reliable estimation process. The precision of the estimates (SEE/mean) over the expected range was good for KFLT (4%) and modest for K1 (13%) but was considerably poorer for Vd, k3, and k4.

Comparisons of estimated vs. “true” parameters K1 (A), Vd (B), k3 (C), k4 (D), and KFLT (E) are plotted for simulated data. The 200 simulated curves represented in plots were generated by randomly varying parameters over a clinically expected range and then adding Poisson noise to each curve based on noise profiles typical in patient studies. Curves were fit by the model optimization process, and the true parameter was compared with the estimated parameter. Estimated value is plotted vs. true value. True value is parameter value used to generate simulated curves.
Parameter Accuracy Over Range of Values
Examination of the 4P model with 60 min of data revealed associated errors (SEE/mean) greater than 80% in the estimation of k4, whereas the error in KFLT was about 10%. Eliminating k4 from the optimization process and using 60 min of data resulted in bias estimates for KFLT of approximately −30% and a SEE/mean of about 20%. Clearly, FLT imaging is capable of more accuracy with 90 min of data.
DISCUSSION
The rate of cellular proliferation is an important feature identifying the growth characteristics of tumors. PET with 18F-FLT provides a noninvasive method of estimating the rate of cellular proliferation. Our model for FLT kinetics provides an assay of the TK1 enzyme activity of the pyrimidine salvage pathway, which is the rate-limiting step for FLT retention. The model flux parameter KFLT is predicted to be an accurate index of cellular growth.
The model shows good sensitivity and precision for estimating K1 and KFLT but has difficulty reliably estimating k3 and Vd (k2) independently, similar to what we found for 11C-thymidine (18,37). Monte Carlo error analysis for marrow shows a large COV for parameters other than K1 and KFLT, including k4.
Simulations using a noise level typical of untreated lung cancer in human PET FLT time-activity curves showed accurate estimates of K1 and KFLT with little bias and SEs of <15% over a realistic range of values. In a prior report assessing the change in cellular proliferation, treatment responders had a 40%–50% decrease in the analogous parameter for 11C-thymidine, KTDR (3). This suggests that applying KFLT as a measure of proliferation has the potential for sufficient precision to be useful in measuring therapy response, where anticipated changes in KFLT will likely exceed the errors in the parameter estimate.
The model had difficulty estimating loss of labeled nucleotides (k4), even with 120 min of data, which is similar to FDG (39). Although estimates of k4 are not as accurate as other model parameters, it accounts for the effect of label lost from the tissue for the best possible determination of KFLT. The ability to estimate small k4 values with 60 min of data is limited, with errors of >80%.
Estimation of k4 in the 4P model may be important for interpreting FLT metabolism (KFLT)—especially in tumors, where therapy may have an effect on nucleotide reutilization. The simulations suggested that longer imaging times may be helpful to reduce the bias and associated error (SEE/mean) in estimation of KFLT. Eliminating k4 in lung tumor simulations leads to a bias in the KFLT estimate (underestimated by approximately 30%). This bias could mask a biologic response to therapy, as estimated by a 3P model or a nonmodeling approach, emphasizing the need to assess possible changes in the k4 estimate over the course of treatment. For the 60-min dataset, the k4 estimate had a large error; however, the resulting KFLT estimate had errors of approximately 10% with little bias and was half of the KFLT error using a 3P model.
Marrow showed less bias in the KFLT estimate than in tumor simulations. It is important to note that simulations based on data from untreated lung cancer patients may not represent other pathologic disease, such as cancer of the breast or colon, where the uptake behavior may be closer to marrow than lung cancer. Examination of full-length datasets in a variety of cancers will be necessary to guide future studies using FLT and determine the trade-off between the improved accuracy in parameter estimation with longer imaging times versus the practical need to minimize the time of clinical imaging studies. Our results, using model parameters appropriate for lung cancer, suggest that shortening the imaging time from 90 to 60 min may result in increasing the error in the flux estimate from approximately 5% to approximately 10%, and this would decrease the potential for FLT to measure response to cytostatic therapy.
CONCLUSION
Our model adequately describes moderately and highly proliferative tissue (tumor and marrow) kinetics for 18F-FLT. The FLT flux in these tissues can be measured with a SE of <5%, and FLT transport can be estimated with a SE of <15%. Our companion paper (10) describes the performance of the model for human data in patients with lung cancer and compares KFLT estimates to an in vitro assay of proliferation in tumor samples using Ki-67 immunohistochemistry analysis. Further studies are necessary to determine the fidelity of KFLT as a proxy for KTDR (thymidine flux), the gold standard for imaging cellular proliferation.
Acknowledgments
This work was supported by National Institutes of Health grants CA42045, CA80907, and RR17229. The authors thank Drs. Jeanne Link and Finbarr O’Sullivan for their helpful comments.
Footnotes
Received Jun. 14, 2004; revision accepted Sep. 13, 2004.
For correspondence or reprints contact: Mark Muzi, MS, University of Washington Medical Center, Box 356465, 1959 N.E. Pacific St., Seattle, WA 98195-6465.
E-mail: muzi{at}u.washington.edu
REFERENCES
In this issue


Jump to section
Related Articles
Cited By...
- Total-Body Perfusion Imaging with [11C]-Butanol
- Principles of Tracer Kinetic Analysis in Oncology, Part II: Examples and Future Directions
- Principles of Tracer Kinetic Analysis in Oncology, Part I: Principles and Overview of Methodology
- Structural and Practical Identifiability of Dual-input Kinetic Modeling in Dynamic PET of Liver Inflammation
- FLT PET/CT imaging of metastatic prostate cancer patients treated with pTVG-HP DNA vaccine and pembrolizumab
- Parametric Method Performance for Dynamic 3'-Deoxy-3'-18F-Fluorothymidine PET/CT in Epidermal Growth Factor Receptor-Mutated Non-Small Cell Lung Carcinoma Patients Before and During Therapy
- Multicenter Clinical Trials Using 18F-FDG PET to Measure Early Response to Oncologic Therapy: Effects of Injection-to-Acquisition Time Variability on Required Sample Size
- Molecular Imaging to Plan Radiotherapy and Evaluate Its Efficacy
- A Monte Carlo Study of the Dependence of Early Frame Sampling on Uncertainty and Bias in Pharmacokinetic Parameters from Dynamic PET
- 3'-Deoxy-3'-[18F]Fluorothymidine Positron Emission Tomography Imaging of Thymidine Kinase 1 Activity After 5-Fluorouracil Treatment in a Mouse Tumor Model
- Kinetic Analysis of 18F-FLT PET in Lung Tumors
- [18F]-3'Deoxy-3'-Fluorothymidine Positron Emission Tomography and Breast Cancer Response to Docetaxel
- Discriminant Analysis of 18F-Fluorothymidine Kinetic Parameters to Predict Survival in Patients with Recurrent High-Grade Glioma
- Tumor 3'-Deoxy-3'-18F-Fluorothymidine (18F-FLT) Uptake by PET Correlates with Thymidine Kinase 1 Expression: Static and Kinetic Analysis of 18F-FLT PET Studies in Lung Tumors
- The future of imaging: developing the tools for monitoring response to therapy in oncology: the 2009 Sir James MacKenzie Davidson Memorial lecture
- Biodistribution and Uptake of 3'-Deoxy-3'-Fluorothymidine in ENT1-Knockout Mice and in an ENT1-Knockdown Tumor Model
- Kinetics of 3'-Deoxy-3'-18F-Fluorothymidine During Treatment Monitoring of Recurrent High-Grade Glioma
- Kinetic Analysis of 18F-Fluoride PET Images of Breast Cancer Bone Metastases
- Imaging of Cyclosporine Inhibition of P-Glycoprotein Activity Using 11C-Verapamil in the Brain: Studies of Healthy Humans
- Kinetic Analysis of 3'-Deoxy-3'-18F-Fluorothymidine (18F-FLT) in Head and Neck Cancer Patients Before and Early After Initiation of Chemoradiation Therapy
- Radiopharmaceuticals in Preclinical and Clinical Development for Monitoring of Therapy with PET
- Kinetic Modeling of 3'-Deoxy-3'-18F-Fluorothymidine for Quantitative Cell Proliferation Imaging in Subcutaneous Tumor Models in Mice
- Proliferation Imaging to Measure Early Cancer Response to Targeted Therapy
- In Vivo Characterization of Proliferation for Discriminating Cancer from Pancreatic Pseudotumors
- Analysis and Reproducibility of 3'-Deoxy-3'-[18F]Fluorothymidine Positron Emission Tomography Imaging in Patients with Non-Small Cell Lung Cancer
- Imaging of Cell Proliferation: Status and Prospects
- Imaging Bone and Soft Tissue Tumors with the Proliferation Marker [18F]Fluorodeoxythymidine
- Dynamic Small-Animal PET Imaging of Tumor Proliferation with 3'-Deoxy-3'-18F-Fluorothymidine in a Genetically Engineered Mouse Model of High-Grade Gliomas
- Tumor-Specific Positron Emission Tomography Imaging in Patients: [18F] Fluorodeoxyglucose and Beyond
- Kinetic Analysis of 3'-Deoxy-3'-18F-Fluorothymidine in Patients with Gliomas
- The Progress and Promise of Molecular Imaging Probes in Oncologic Drug Development
- Reproducibility of 3'-Deoxy-3'-18F-Fluorothymidine MicroPET Studies in Tumor Xenografts in Mice
- Kinetic Analysis of 3'-Deoxy-3'-Fluorothymidine PET Studies: Validation Studies in Patients with Lung Cancer