


Abstract
3′-Deoxy-3′-fluorothymidine (FLT), a thymidine analog, is under investigation for monitoring cellular proliferation in gliomas, a potential measure of disease progression and response to therapy. Uptake may result from retention in the biosynthetic pathway or leakage via the disrupted blood–tumor barrier. Visual analysis or static measures of 18F-FLT uptake are problematic as transport and retention cannot be distinguished. Methods: Twelve patients with primary brain tumors were imaged for 90 min of dynamic 18F-FLT PET with arterial blood sampling. Total blood activity was corrected for labeled metabolites to provide an FLT input function. A 2-tissue compartment, 4-rate-constant model was used to determine blood-to-tissue transport (K1) and metabolic flux (KFLT). Modeling results were compared with MR images of blood–brain barrier (BBB) breakdown revealed by gadolinium (Gd) contrast enhancement. Parametric image maps of K1 and KFLT were produced by a mixture analysis approach. Results: Similar to prior work with 11C-thymidine, identifiability analysis showed that K1 (transport) and KFLT (flux) could be estimated independently for sufficiently high K1 values. However, estimation of KFLT was less robust at low K1 values, particularly those close to normal brain. K1 was higher for MRI contrast-enhancing (CE) tumors (0.053 ± 0.029 mL/g/min) than noncontrast-enhancing (NCE) tumors (0.005 ± 0.002 mL/g/min; P < 0.02), and KFLT was higher for high-grade tumors (0.018 ± 0.008 mL/g/min, n = 9) than low-grade tumors (0.003 ± 0.003 mL/g/min, n = 3; P < 0.01). The flux in NCE tumors was indistinguishable from contralateral normal brain (0.002 ± 0.001 mL/g/min). For CE tumors, K1 was higher than KFLT. Parametric images matched region-of-interest estimates of transport and flux. However, no patient has 18F-FLT uptake outside of the volume of increased permeability defined by MRI T1+Gd enhancement. Conclusion: Modeling analysis of 18F-FLT PET data yielded robust estimates of K1 and KFLT for enhancing tumors with sufficiently high K1 and provides a clearer understanding of the relationship between transport and retention of 18F-FLT in gliomas. In tumors that show breakdown of the BBB, transport dominates 18F-FLT uptake. Transport across the BBB and modest rates of 18F-FLT phosphorylation appear to limit the assessment of cellular proliferation using 18F-FLT to highly proliferative tumors with significant BBB breakdown.
PET of cellular proliferation may provide a convenient and early measure of therapeutic response in cancer patients (1–4). Radiolabeled thymidine (2-11C-thymidine [TdR]) is the most direct indicator of proliferation by PET (5,6). It is rapidly incorporated into DNA through the exogenous (salvage) pathway for pyrimidines. Quantitative estimates of TdR uptake in tumors treated with chemotherapy exhibit larger and more consistent decreases after therapy compared with decreases in FDG (3). However, static imaging of TdR does not accurately reflect proliferation because labeled metabolites, especially 11C-CO2 in the brain, contaminate the images (6). Accurate interpretation of TdR uptake to determine the rate of DNA synthesis requires rapid arterial sampling, extensive plasma metabolite analysis, and mathematic modeling of the PET data. This is particularly true of brain tumors, where the normal blood–brain barrier (BBB) limits TdR transport (1,4,7).
Recently, 3′-deoxy-3′-18F-fluorothymidine (FLT), a TdR analog, has been developed as an alternative to TdR for imaging proliferation (5,8). 18F-FLT offers the advantages of a longer-lived label with high specificity for thymidine kinase 1 (TK1) in the cytosol and few labeled metabolites. TK1 is highly regulated during the cell cycle and is highly expressed during S phase. Further FLT tissue metabolism produces phosphorylated products (nucleotides), which are retained in cells at a rate proportional to TK1 activity (9). FLT is not significantly incorporated into DNA because it lacks the 3′-hydroxyl, which is essential for chain propagation. 18F-FLT labels the intracellular nucleotide pool and is subject to retrograde metabolism (9). FLT anabolism primarily occurs in the liver to produce a glucuronide conjugate, which is exported to the blood and cleared by the kidneys (10). 18F-FLT-glucuronide appears to be the only observed metabolite contaminating the blood pool (10).
We have previously described a 2-tissue compartment, 4-rate constant model (2C) for 18F-FLT that has been validated for somatic tissues and successfully applied to patient studies (11,12). However, because the intact BBB restricts the transport of modified pyrimidine nucleotides such as FLT (7,13), and tumor growth or therapy can disrupt the BBB (14), further analysis was necessary to demonstrate that the model could distinguish between increased transport across a damaged BBB and increased retention of 18F-FLT in proliferating tumor tissue.
MATERIALS AND METHODS
Patients
All tumors were graded by the World Health Organization (WHO) scheme. Twelve patients were included in the analysis (8 male, 4 female; mean age, 47 y; range, 19–67 y): 4 with glioblastoma multiforme (WHO grade IV), 1 with gliosarcoma (WHO grade IV), 1 with anaplastic pleomorphic xanthoastrocytoma (WHO grade III), 2 with anaplastic astrocytoma (WHO grade III), 1 with oligodendroglioma (WHO grade III), and 3 with oligodendroglioma (WHO grade II) listed in Table 1. Histopathology was performed on tissue specimens recovered at biopsy (n = 5) or resection (n = 7) before 18F-FLT PET. All patients had contrast-enhanced (CE) MRI within 30 d of PET. Six patients had prior radiation and chemotherapy, whereas 4 received prior radiotherapy only, 1 had prior chemotherapy only, and 1 had no treatment before PET. These protocols were approved by the University of Washington Human Subjects and Radiation Safety committees and the Radioactive Drug Research Committee. Patients were tested for hemotologic, renal, and liver function before and after PET and provided signed informed consent.
Patient Clinical Data
Radiosynthesis
FLT was prepared by the method of either Grierson et al. (8) or Blocher et al. (15). The specific activity was >7.4 GBq/μmol at injection, and the radiochemical purity was >98%. Before release and administration of each dose, quality tests for endotoxins, pH, and chemical or radiochemical purity were completed. U.S. Pharmacopeia (USP) sterility testing was performed on samples of each batch. 18F-FLT was administered by intravenous injection of a 10-mL solution of isotonic saline containing <10% (v/v) ethanol USP. The injected dose was based on the patient's weight (2.59 MBq/kg), with a 185-MBq maximum, an amount that is as low as reasonably achievable and still permits the acquisition of dynamic images for kinetic analysis.
Imaging Procedure
The PET studies were performed on an Advance PET tomograph (GE Healthcare) providing 35 image planes over a 15-cm axial field of view with a 4.25-mm spacing (16). While a 25-min transmission scan with a 68Ge rotating sector source was underway, intravenous and intraarterial lines were introduced for isotope injection and arterial sampling. Arterial samples of 1 mL were obtained using an automated blood sampler (17) at 8 × 15 s, 2 × 30 s, 5 × 1 min, 1 × 2 min, and 16 × 5 min. Images were acquired in 3-dimensional (3D) mode with a dynamic sequence: 10 × 10 s, 4 × 20 s, 3 × 40 s, 3 × 1 min, 5 × 2 min, 4 × 3 min, and 12 × 5 min time frames for a total of 90 min. After correction for scattered and random coincidences, images were reconstructed by the method of 3D reprojection (18) with 6-mm Hanning, 4.5-mm radial, and 6-mm smoothing filters, resulting in an approximately isotropic image resolution of 6 mm.
Blood Sampling and Metabolite Analysis
For each arterial blood sample, 0.2 mL plasma were assayed for radioactivity using a COBRA γ-counter (Packard Instruments). Because FLT has negligible serum protein binding (19), all of the activity associated with 18F-FLT in blood was assumed to be available for tissue uptake. An aliquot (0.4 mL) of the plasma from 8 arterial samples (5, 10, 15, 20, 30, 45, 60, and 90 min) was assayed for the relative amount of FLT and FLT-glucuronide as described previously (11,20). The fraction of total activity present as FLT in each blood sample was fitted to a monoexponential curve to provide a continuous function describing the fraction of plasma activity associated with FLT (11). The fractional FLT curve was applied to each total blood activity curve to give a metabolite-corrected input function for further modeling analysis of each patient dataset.
Image Processing
MRI was performed with a 1.5-T Signa (GE Healthcare) with a standard head coil. The protocol for all subjects included a T1-weighted sequence acquired in the transverse plane before and after administration of intravenous gadolinium (Gd). MR images were coregistered to summed PET images with a method based on mutual information criteria (11).
Regions of interest (ROIs) for tumor and contralateral (C/L) brain regions (brain, gray and white matter) were identified on MRI T1+Gd or T2-weighted images and 18F-FLT images summed between 30 and 60 min, an interval when transport of the radiotracer from blood to tissue is predominantly unidirectional. The ROIs from contiguous slices were combined to create volumes of interest (VOIs) for each tissue type by means of Alice image-processing software (Perceptive Informatics, Inc.). Tumor regions were placed on all planes containing portions of the lesion as indicated from the MRI T1+Gd or 18F-FLT images.
Quantitative Analysis
Compartmental Modeling.
The previously described 2C kinetic model for FLT kinetics is illustrated in Figure 1 (12). Similar to the kinetic assumptions of the TdR model in brain tumors (21), FLT transport into the brain is influenced by blood flow and the BBB (13). Details of the FLT model have been reported previously (12).
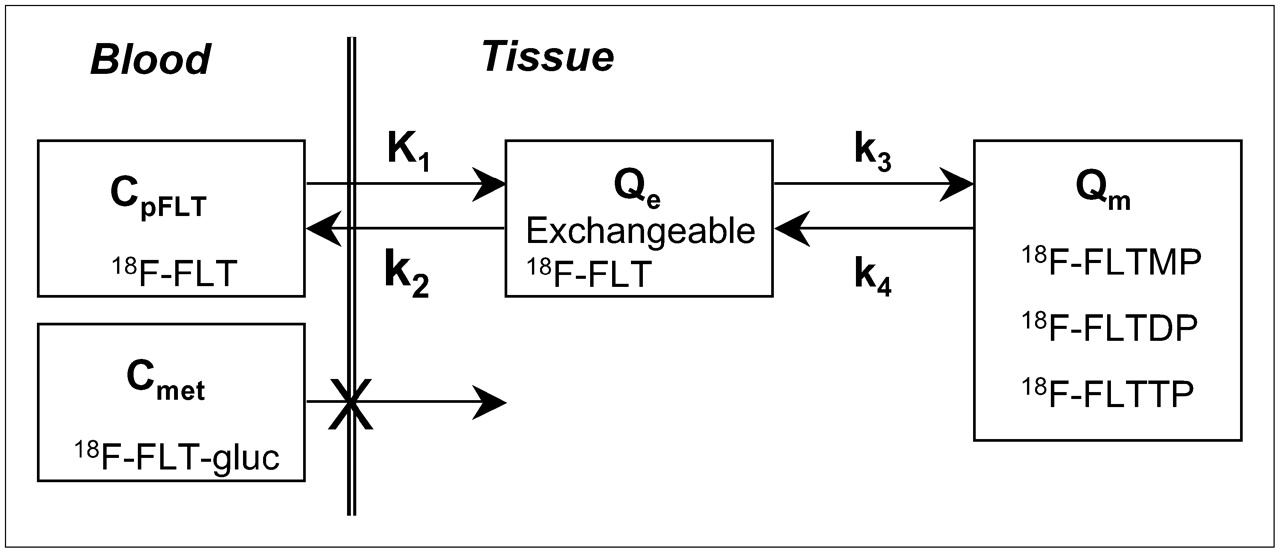
Kinetic model of FLT metabolism is comprised of an exchangeable tissue compartment (Qe) and a compartment of trapped FLT nucleotides (Qm). Four rate constants (K1–k4) describe kinetic transfer rates between the 2 compartments and blood. FLTMP = FLT-monophosphate; FLTDP = FLT-diphosphate; FLTTP = FLT-triphosphate; FLT-gluc = FLT-glucuronide; CpFLT = concentration of FLT in arterial plasma; Cmet = concentration of metabolites in arterial plasma.
The transfer from blood into tissue across the BBB is represented by K1, whereas the return of FLT from tissue representing nonphosphorylated FLT back to blood is represented by k2. The metabolic trapping of FLT through phosphorylation is represented by k3 and is the rate-limiting step for the intracellular trapping of FLT in tissue (12). Unlike TdR, which can be trapped irreversibly in DNA, there is some evidence that nucleotides of FLT can leave the imaging region either by dephosphorylation and subsequent efflux or via nucleotide transporters (9,22). The loss of image signal through these processes is described by k4 (12).
Metabolic flux, KFLT, is estimated from parameters derived by fitting the FLT input function and the total blood activity curve to the tissue time–activity curve data. The flux constant is determined by the product of the rate constants (12,23): Eq. 1where Vd is the early distribution volume for the reversible compartment, given by K1/k2, similar to prior reports (12,21). The key parameters for describing 18F-FLT uptake in tissue are the blood–tissue transport rate, K1, and the metabolic flux constant, KFLT.
Model Starting Parameters.
In our previous FLT tissue model (11), early analyses suggested that it was difficult to estimate K1 and k2 independently. Hence, the model was reparameterized using K1 and K1/k2 as floating variables, which has been an effective method for handling K1–k2 covariance (6,12,21). The individual rate constants, K1, K1/k2, k3, and k4, and the regional Vb, the fraction of vascular activity in the tissue VOI, were estimated during parameter optimization.
Starting parameters for FLT were based on FLT kinetic assessment of lung tumors (11) and TdR in gliomas (4). Prior studies in somatic tumors (11) have shown that estimates of the transport rate for FLT are lower than those for TdR (6). A lower K1 for FLT relative to TdR is expected, as cellular TdR transporters do not effectively transport analogs modified at the 3′ position (24,25). Phosphorylation of FLT by TK1 (k3) is also anticipated to be lower than that for TdR, reflecting the differences in activity of TK1 for each substrate (26,27). Dephosphorylation of FLT-monophosphate, represented by k4 as estimated in lung tumors and muscle (11), is anticipated to occur at a similar level for gliomas and brain tissue. Thus, the initial model conditions were adjusted from the TdR starting points to reflect the less reactive behavior of FLT (Table 2).
FLT Model Parameters, Expected Ranges, and Starting Values
For each time frame of the dynamic imaging sequence, the average Bq/mL within the VOI was used for compartmental analysis in the 2C model (Fig. 1). The regional VOI activity curves, the metabolite-corrected arterial input curve, and the total arterial activity curve were fitted to the FLT compartmental model using the weighted Levenberg–Marquart least-squares minimization algorithm as implemented in a software package designed for PET data analysis (PMOD version 2.65; PMOD group, Zurich, Switzerland). In the optimization process, the residuals were weighted by the inverse variance of the total counting rate in each frame of data, based on the SD of the total uncorrected counts and the duration of the time frame (28). Model parameters were estimated by minimizing the weighted residual sum of the square error (WRRS) between the model solution and the PET measurement.
Model Characteristics.
The proposed model was evaluated to determine the extent to which the information obtained from a typical imaging study is sufficient to produce a unique solution with identifiable parameters. To establish the most reliable approach for parameter estimation, the brain FLT model was characterized with respect to (a) parameter sensitivity, the degree to which a change in an individual input parameter results in a change in the output; (b) parameter identifiability, the ability of the model to estimate parameters independently; (c) susceptibility to noise, as determined by Monte Carlo error analysis; and (d) model accuracy, the ability to estimate key parameters accurately across the expected range of values. These methods have been described (6,12,21) and are not repeated here.
Parametric Image Analysis.
Parametric image maps of each rate constant were generated by mixture analysis (28,29). Mixture analysis applies the same biologically based model with identical floating parameters and blood input functions used in the analysis of tissue time–activity curves to the dynamic series of images for the production of regional parametric maps. The VOIs used to generate tissue time–activity curves were applied to the parametric images to determine the extent of FLT flux relative to Gd enhancement on MR images, as well as the precision and bias of the parametric image values relative to modeling analysis of tissue time–activity curves.
Model-Independent Analysis.
Simple, model-independent estimates of 18F-FLT uptake were assessed by the standard uptake value (SUV) determined from images obtained between 30 and 60 min after injection and by a modified graphical analysis (GA) (30), which corrects for blood metabolites. The GA determination of flux may be valid for a short interval after injection, when the assumption of unidirectional transfer of FLT from blood to tissue is applicable (31). Because of the restricted transport of FLT, tissue pools of precursor require a greater time to stabilize with respect to blood delivery. Therefore, 30 and 60 min were chosen as the time boundaries for the linear fit in GA after examination of linearity in CE brain tumor regions. This is a different time range than that determined for lung tumors (15–50 min), where initial transport of FLT into lung tumors is greater (11). The method also assumes that phosphorylated FLT nucleotides are completely retained in the tissue, an assumption that has yet to be validated in vivo and is not supported by cell culture experiments (9).
Statistical Analysis
The comparisons between 18F-FLT PET uptake parameters or model estimations were made using standard parametric statistical tests (Pearson correlation, paired Student t test). Statistical analyses were performed using the statistical software JMP (SAS Institute).
RESULTS
Blood Activity Curves
Arterial FLT blood activity curves were similar in magnitude and profile to those observed in lung cancer patients (11,20). The proportion of total blood activity associated with FLT showed an average of 73% at 90 min (range, 93%–61%; n = 12 patients).
Sensitivity Analysis
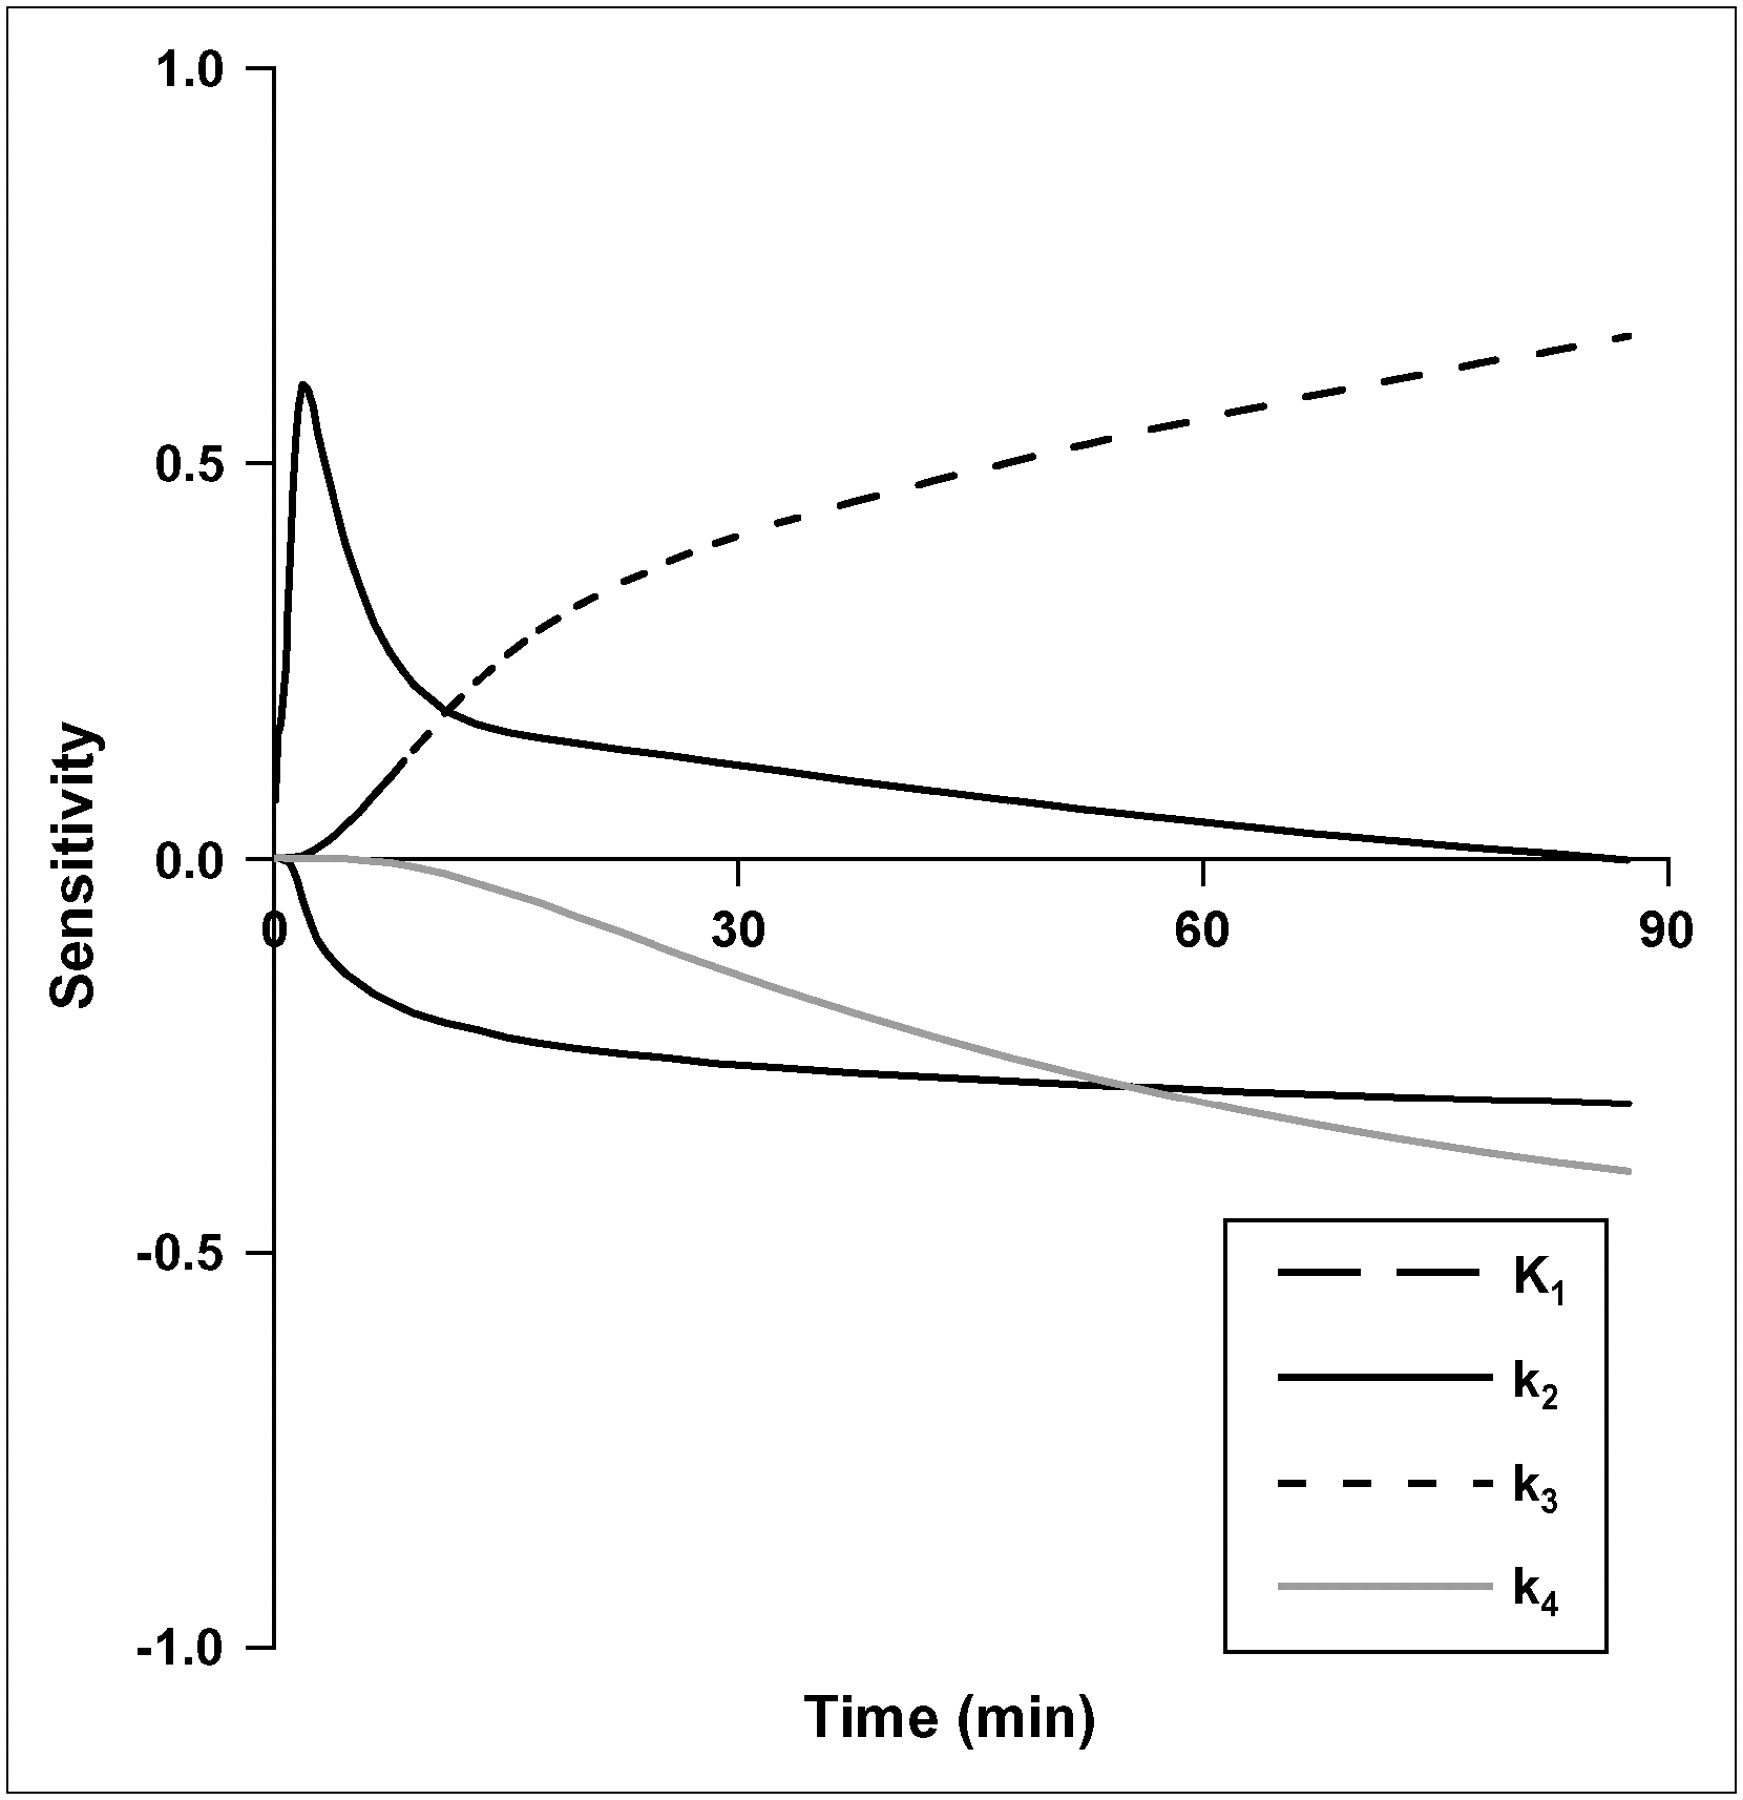
Parameter sensitivity for other brain regions (gray and white matter) and noncontrast-enhancing (NCE) tumors were similar to C/L brain. In CE tumors, K1 has a greater contribution to 18F-FLT uptake than phosphorylation, k3. The sensitivity of K1 for CE tumor is similar to TdR in magnitude and time course (21), with a large impact on early model output that diminishes after 10 min. The k3 phosphorylation rate had the greatest sensitivity of any individual rate constant during the prolonged 18F-FLT uptake phase after blood–tissue equilibration (Fig. 2).

Sensitivity curves for brain parameters in FLT model. Sensitivity of each parameter is degree to which the model output is altered by 1% change in a model parameter.
Correlation Matrix
Identifiability analysis of glioma time–activity curves showed that individual parameters covaried, but K1 is quite robust and estimated independently (Table 3). There was a high level of covariance between k3 and Vd for CE gliomas, indicating it is difficult to obtain independent estimates of k3 and Vd.
Parameter Correlation Matrix for CE Tumors
Monte Carlo Error
The results for 250 simulations on the effect of noise on parameter estimation using the Monte Carlo approach for C/L brain and CE glioma time–activity curves are summarized in Table 4. C/L brain and NCE tumors showed a similar level of variation. In the presence of statistical noise typical for 18F-FLT PET of gliomas (∼2% time–activity curve coefficient of variation [COV] at 60 min), there was a SE of <10% for the estimate of KFLT and K1 for CE tumors. The other parameters (Vd, k3, k4) had larger COV values and were less robust. The COV was greater in brain and NCE tumors (∼7% time–activity curve COV at 60 min) than that in CE tumors, reflecting the low level of 18F-FLT transport and uptake in a nonproliferating tissue with restricted access at the BBB.
Errors in FLT Parameter Estimation Resulting from Introduction of Noise into Simulated Data*
Model Accuracy
The accuracy of parameter estimates over a wide parameter range for brain is summarized in Table 5. The results of the simulation showed that the estimation of K1 is accurate over a wide clinical range using added noise typical of human CE tumor. The correlation coefficients for estimated versus true parameter values for K1 and KFLT are 0.98 and 0.99, respectively, reflecting an accurate estimation process under the error conditions imposed. Correlation values were lower for k3 (r = 0.75) and Vd (r = 0.76), indicating less robust estimation as predicted by the sensitivity and identifiability analysis. The bias in the estimate was <2% for K1 and for KFLT. The precision of the estimates (SEE/mean) over the expected range was acceptable for KFLT (4%) and K1 (12%) but was considerably poorer for Vd, k3, and k4.
Correlation Between Estimated and Actual Values for Simulated Data Generated Over Expected Clinical Range of Parameters*
Patient Imaging
Three examples of FLT patient image sets appear in Figure 3, including the coregistered MRI T1+Gd, FDG SUV, and FLT SUV from 30 to 60 min after injection, parametric images of transport and metabolic flux, as well as tissue time–activity curves. They demonstrate the anticipated variation in 18F-FLT uptake between tumor and brain with (Figs. 3A and 3C) and without (Fig. 3B) BBB breakdown. Nonproliferative, normal regions in the brain showed rapid early uptake and washout that mirrored the shape of the blood time–activity curve but was much lower in magnitude. In all cases, little retention was observed in normal brain. CE high-grade brain tumors (Fig. 3A) showed rapid early uptake with persistent retention. The 18F-FLT uptake pattern in NCE brain tumors was virtually identical to normal brain, presumably because of restricted access of 18F-FLT at the BBB.

Three patients representing different aspects of FLT metabolism were investigated for 18F-FLT uptake. (A) A 44-y-old woman with recurrent grade III anaplastic astrocytoma with BBB breakdown treated previously by radiotherapy (59 Gy). (B) A 56-y-old man with right parietal grade II oligodendroglioma with intact BBB treated previously by surgical resection followed by chemotherapy (procarbazine-lomustine-vincristine). (C) A 46-y-old man with recurrent grade II oligodendroglioma with BBB breakdown treated with radiotherapy (54 Gy) and chemotherapy (temozolomide) before PET. Surgery and therapy occurred at least 2 y before PET for all 3 patients. Coregistered images are as follows: MRI T1+Gd; FDG SUV summed 30–60 min; FLT SUV summed 30–60 min; parametric map of transport, K1; parametric image of metabolic flux, KFLT. TAC = time–activity curve.
Parameter Estimates
The mean and range of FLT model parameter estimates for CE and NCE tumors and gray and white matter are presented in Table 6. Model optimization results show that FLT is not retained to any significant degree in patients with an intact BBB or in C/L brain regions. K1 and KFLT (Figs. 4A and 4B) were both significantly larger in CE (K1 mean, 0.053 mL/g/min, n = 9; KFLT mean, 0.018 mL/g/min, n = 9) tumors than in NCE tumors (NCE K1 mean, 0.005 mL/g/min, n = 3, P < 0.02; NCE KFLT mean, 0.001 mL/g/min, n = 3, P < 0.005). In CE tumors, which exhibited uptake and retention of 18F-FLT, the transport parameter K1 and KFLT were closely correlated (r = 0.91, n = 9), suggesting that uptake of 18F-FLT is dominated by transport (Figs. 4C and 4D). Interestingly, 1 CE patient diagnosed with a previously treated low-grade oligodendroglioma with BBB breakdown (Fig. 3C) not only showed transport-dominated uptake (K1 = 0.017 mL/g/min) much larger than KFLT (0.007 mL/g/min) but also had an estimated KFLT value nearly as low as brain and much lower than high-grade gliomas. For comparison, TdR parameters reported previously for a similar set of glioma patients appear in Table 7 along with comparable FLT values.

(A and B) 18F-FLT transport (A) and retention (B) parameter values plotted for NCE and CE glioma patients (n = 12). ▴, Low-grade gliomas; ○, high-grade tumors. (C) In plot of flux vs. transport parameter values (n = 12), correlation is quite linear for tumor, but well under the line of identity, which may indicate effect of limited access of 18F-FLT to brain and tumor regions. (D) Same data as plotted in C with an expanded scale near the origin.
Average FLT Model Parameters in Human Brain and Tumor Regions
Comparison Between TdR Parameters Reported Previously and FLT in This Study
The close correlation between K1 and KFLT in patient studies prompted concern that the 2 might not be distinguishable over the range of parameters observed in glioma patients. Therefore, we performed additional modeling simulations using the 2C model with various rates of initial transport (K1 = 0.01, 0.025, and 0.050 mL/g/min), no phosphorylation (k3 = 0) producing no flux, and added noise equivalent to 2% COV at 60 min on 200 datasets for each K1 level. Although flux was zero in the simulated curves (k3 = 0), when noise was added at a level typical of FLT brain imaging, the model-estimated average flux levels were 0.004, 0.008, and 0.011 mL/g/min for the range of K1 values used in the simulations. These flux values overlap with the range of flux values observed in the patient studies for normal brain or low-grade gliomas and suggest that it will be difficult to estimate flux independent of transport at lower levels of metabolic flux.
K1 is higher for MRI CE tumors than for NCE tumors (P < 0.02) and KFLT is higher in high-grade tumors (mean, 0.018; n = 9) than that in lower-grade tumors (mean, 0.003; n = 3, P < 0.01). For CE tumors, we observed a finite rate of late label loss, with an average estimate for k4 of 0.025 min−1 (range, 0.017–0.032 min−1; n = 9). Consistent with this finding, a characteristic late downward curvature was observed in the GA plot for most CE gliomas. As previous reports have shown, ignoring k4 can lead to significant underestimation of flux (11,31). KFLT values estimated from compartmental modeling analysis were correlated with GA KFLT-GA (r = 0.84) and FLT maximum SUV (r = 0.71) and also highly correlated with K1 (r = 0.94).
Mixture Analysis
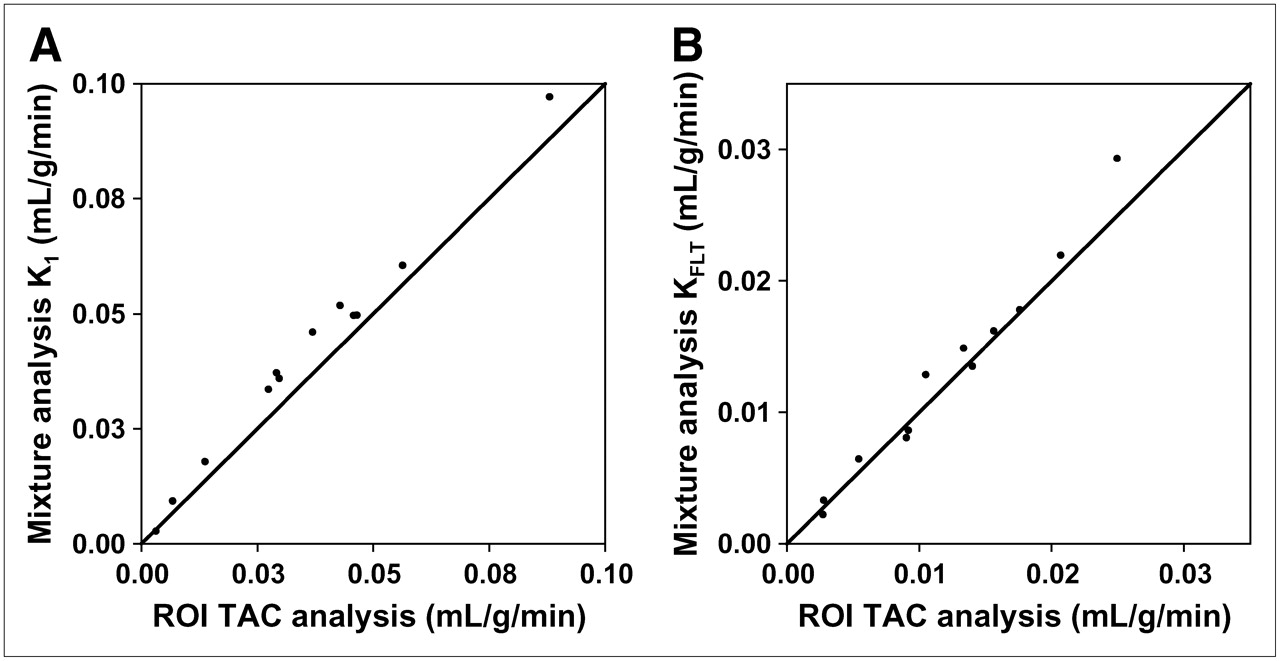
Mixture analysis–derived image maps of parameters were matched to ROI analysis for K1 (r = 0.98, SEE/mean = 5.9%, n = 10) and KFLT (r = 0.99, SEE/mean = 8.9%, n = 12) (Fig. 5). Parametric images from the mixture analysis method did not reveal significant transport (K1) or flux (KFLT) outside of the regions of contrast enhancement. Examples of patient parametric images of transport and metabolic flux appear in Figure 3.

Parametric images generated by mixture analysis modeling results were highly correlated with conventional ROI modeling parameters for identical tissue regions for both transport (A) and retention (B). TAC = time–activity curve.
DISCUSSION
18F-FLT PET may offer a noninvasive method for quantitating cellular proliferation in gliomas and may be useful for predicting disease progression and response to therapy. However, low tracer access to the brain and tumor tissue may limit the ability to infer proliferation from 18F-FLT retention. The purpose of the present study was to evaluate critically a compartmental model for quantitating 18F-FLT uptake and retention in glioma-bearing patients as an extension of previous modeling for somatic tumors (11). Kinetic analysis of 18F-FLT imaging was performed to estimate the extent to which 18F-FLT uptake was due to BBB breakdown versus tracer retention related to phosphorylation by TK1 and, therefore, tumor growth.
Our results indicate that accurate assessment of proliferation in brain by 18F-FLT imaging requires analysis of uptake kinetics to separate transport effects from tissue retention due to metabolic trapping of FLT nucleotides. This process involves an assay of the FLT fraction in blood, as blood clearance varied widely among the patients. It is likely that the blood metabolite FLT-glucuronide does not enter normal cells (10) but may flow through the disrupted BBB into and out of the interstitial space during the imaging procedure. We assume the kinetics of this interaction and resulting tissue activity in normal and tumor regions can be accounted for by the vascular parameter Vb. Limited transit of FLT-glucuronide to and from the interstitial space is unlikely to affect model behavior, given the small quantity of the labeled metabolite present late in the imaging study.
As demonstrated in a patient with a recurrent pretreated low-grade oligodendroglioma with significant contrast enhancement (Fig. 3C), simple measures of tracer uptake, such as SUV, can be misleading when total 18F-FLT uptake is due in large part to transport across the BBB and not to trapping of FLT after phosphorylation by TK1. In addition, low transport can limit uptake even in proliferative tumors. Another patient (Table 1, patient. 2) with a grade III astrocytoma (determined by biopsy that showed 10% MIB-1 staining) had no contrast enhancement on MRI T1+Gd images. 18F-FLT uptake was similar to the low levels observed in normal brain. Simple measures of uptake that do not fully account for 18F-FLT transport, uptake, and loss from tissues can lead to incorrect interpretation of summed uptake images.
Transport impediments may pose a difficulty, however, in using FLT to assess residual viable brain tumor after therapy. In this case, transport may be transiently high because of treatment effects, and flux may be low in successfully treated tumors. The estimated KFLT would then be mistakenly higher than the actual flux rate and could lead to a conclusion of residual tumor instead of successful treatment. One potential application of FLT may be for brain tumors with high initial K1 and KFLT. After treatment, these patients may show an early reduction in KFLT due to decreased proliferation. This hypothesis would need to be tested in serial 18F-FLT imaging studies over the course of therapy.
Compartmental modeling provides separate estimates of both transport and flux (trapping) to account for 18F-FLT uptake. Simulations suggest that the transport parameter can be estimated with <15% COV and metabolic flux with <5% COV. However, at the extremes of transport, modeling estimates of metabolic flux may be less accurate. For values of K1 close to that of normal brain and characteristic of NCE brain tumors, transport limits uptake and the flux cannot be measured independent of transport. Flux values for normal brain fall within the error of model estimates and reflect restricted access of FLT across the BBB. This also appears to be true for NCE or minimally CE brain tumors. Thus, FLT may be less useful in assessing proliferation in NCE tumors regardless of histopathology grading.
18F-FLT PET may also have difficulty in differentiating residual proliferating tumor from BBB breakdown in regions that are not highly proliferating. At the extreme of high K1 and low KFLT, estimates of KFLT are imprecise. In fact, simulations with high transport and no phosphorylation (k3 = 0) produced model estimates of flux that were nonzero. This may limit the applicability of FLT in circumstances of low flux, such as would be expected in radionecrosis. This is distinct from TdR imaging, where both flux and transport could be estimated over a wider range (21). The differences in model behavior result from differences in model transport (K1) and the retention or trapping (k3) rate, which are both higher for TdR than for the FLT analog.
We examined the relationship between 18F-FLT transport and metabolic flux using parametric image maps, which removes operator dependency in defining the ROI for kinetic analysis and allows visualization of the distribution of parameter values. Parametric image creation using mixture analysis produced regional maps of FLT kinetic parameters that were well correlated with time–activity curve parameter estimates of K1 and KFLT (Fig. 5) and coincided with areas of CE on MRI T1+Gd images. As expected, patients without tumor enhancement on T1+Gd images showed uptake of FLT similar to the low levels observed in normal brain, which lends credence to the interpretation of K1 as transport across the BBB. Additionally, parametric image maps of overall flux and transport visually coincided with the extent of Gd contrast enhancement, suggesting the large influence of transport on FLT distribution in the brain.
We observed both qualitative and quantitative differences in results for FLT and TdR brain tumor imaging. For TdR, both flux and transport could be estimated over a wider range. The differences in model behavior for FLT versus TdR result from differences in the transport rate (K1) and the retention or trapping rate (k3), which are both higher for TdR than for FLT. FLT may not be transported by the same system as TdR. The saturable active nucleoside transport system for TdR at the BBB has significantly reduced transport for deoxynucleoside analogs with substitutions at the 3′ position (24,25). Reports have suggested that the observed concentration gradient across the BBB after injection of 18F-FLT involves an active efflux transporter pumping FLT out from the brain (13). It is interesting to note that when this barrier has been disrupted as in CE gliomas, TdR and FLT have similar transport values (Table 7). The average metabolic flux of FLT in this study relative to the average flux of TdR reported previously (4) (KFLT/KTdR; Table 7) for high-grade gliomas (0.56) and C/L brain (0.23) was in agreement with the TK1 phosphorylation ratio (PR) for FLT relative to TdR (PR = 0.3) (26,27). It was also comparable with the relative incorporation rate of FLT to TdR for cultured glioma cells in vitro (0.64) (32). These biologic factors underlie observed differences in transport and retention of these proliferation tracers.
One potential explanation for low transport and retention of 18F-FLT reported recently is competition with high levels of endogenous TdR, thus lowering the uptake of tracers such as FLT and TdR that use the exogenous pathway (33). Cellular assay studies on endogenous and exogenous TdR use reported that both pathways are used to a similar extent in tumor and normal cell lines (34), suggesting that reliance on the endogenous pathway does not restrict access to the exogenous pathway.
Low uptake of 18F-FLT could be due to predominant reliance on the de novo—versus the salvage—TdR pathways for incorporation into DNA. In a series of primary glioma and brain tissue specimens, Bardot et al. (35) observed a shift to the de novo pathway through a reduction in the ratio of TK to TdR synthase (TS) but that higher TK/TS ratios measured between normal brain and low-grade gliomas were statistically identical. This suggests that low 18F-FLT transport and retention in low-grade gliomas are not due to a predominant de novo synthesis of pyrimidines.
The simulation results show significant error in the estimation of the shape parameters (k2, k3, and k4). A recent study on 18F-FLT in brain tumors (36) reported values of k3 for brain and gliomas, similar to ours, and concluded that the data do not support the hypothesis that estimation of glioma proliferation by 18F-FLT is accurate. Model simulations suggest that estimates of this parameter do not possess the precision required with small numbers of patients to evaluate this relationship. The model estimation error for k3 was approximately 50% for high-resolution simulations (2% COV at 60 min). Brain or NCE tumor tissue activity curves possess larger errors (7% COV at 60 min), which most likely would result in a much greater error in estimating k3. Considering the variability in the estimation process, it is not surprising that k3 in tumor could not be differentiated from C/L brain.
An assessment of 18F-FLT uptake as an indicator of cell proliferation requires an independent measure of growth—for example, the determination of histopathologic proliferation markers such as Ki-67. A number of reports have found high correlations of Ki-67 with several measures of 18F-FLT uptake (reviewed by Mankoff et al. (2)). Individual rate parameters such as k3 are less robust than overall flux, which correlates to a modest degree (Spearman ρ = 0.70, n = 12) with pathologic grade. However, it is well known that the degree of BBB disruption tends to be higher in more proliferative tumors; therefore, this correlation may arise on the basis of transport.
CONCLUSION
The use of 18F-FLT imaging to assess cellular proliferation in brain requires an analysis of dynamic FLT metabolism to separate transport effects from tissue retention of metabolically trapped FLT nucleotides. With compartmental modeling techniques, the FLT flux in CE brain tumors can be measured with a SE of <5% and 18F-FLT transport can be estimated with a SE of <15%.
Normal brain and NCE tumors with an intact BBB have very limited transport and cannot be adequately assessed for cellular proliferation by 18F-FLT. In addition, problems interpreting images are encountered for patients with high K1 and low KFLT, as might be encountered in radionecrosis. 18F-FLT may not be useful for NCE gliomas regardless of histopathologic grading or proliferation state. 18F-FLT PET may also have difficulty in differentiating residual proliferating brain tumor from BBB breakdown in regions that are not highly proliferating. 18F-FLT brain imaging might have potential use in managing gliomas with initially high K1 and high KFLT for evaluation of early response to new therapies. In that case, it is likely that an early posttreatment decline in KFLT would be observed before a change in K1.
Acknowledgments
We greatly appreciate the assistance of Pam Pham for assistance in all patient imaging and reconstruction procedures. This work is supported by National Cancer Institute grants CA42045 and S10 RR17229.
Footnotes
-
COPYRIGHT © 2006 by the Society of Nuclear Medicine, Inc.
References
- Received for publication May 11, 2006.
- Accepted for publication July 25, 2006.


Jump to section
Related Articles
Cited By...
- Mapping 18F-FDG Kinetics Together with Patient-Specific Bootstrap Assessment of Uncertainties: An Illustration with Data from a PET/CT Scanner with a Long Axial Field of View
- Monitoring Response to Transarterial Chemoembolization in Hepatocellular Carcinoma Using 18F-Fluorothymidine PET
- Structural and Practical Identifiability of Dual-input Kinetic Modeling in Dynamic PET of Liver Inflammation
- Repeatability of 18F-FLT PET in a Multicenter Study of Patients with High-Grade Glioma
- uPAR as a Glioma Imaging Target
- Multimodality Brain Tumor Imaging: MR Imaging, PET, and PET/MR Imaging
- Evaluation of the Genisys4, a Bench-Top Preclinical PET Scanner
- 3'-Deoxy-3'-18F-Fluorothymidine PET-Derived Proliferative Volume Predicts Overall Survival in High-Grade Glioma Patients
- PET/MRI for Neurologic Applications
- PET Imaging of Tumor Growth: Not as Easy as It Looks
- Discriminant Analysis of 18F-Fluorothymidine Kinetic Parameters to Predict Survival in Patients with Recurrent High-Grade Glioma
- Tumor 3'-Deoxy-3'-18F-Fluorothymidine (18F-FLT) Uptake by PET Correlates with Thymidine Kinase 1 Expression: Static and Kinetic Analysis of 18F-FLT PET Studies in Lung Tumors
- The future of imaging: developing the tools for monitoring response to therapy in oncology: the 2009 Sir James MacKenzie Davidson Memorial lecture
- Imaging of Cyclosporine Inhibition of P-Glycoprotein Activity Using 11C-Verapamil in the Brain: Studies of Healthy Humans
- Radiopharmaceuticals in Preclinical and Clinical Development for Monitoring of Therapy with PET
- Kinetic Modeling of 3'-Deoxy-3'-18F-Fluorothymidine for Quantitative Cell Proliferation Imaging in Subcutaneous Tumor Models in Mice
- Imaging of Cell Proliferation: Status and Prospects
- Glioma Proliferation as Assessed by 3'-Fluoro-3'-Deoxy-L-Thymidine Positron Emission Tomography in Patients with Newly Diagnosed High-Grade Glioma
- Dynamic Small-Animal PET Imaging of Tumor Proliferation with 3'-Deoxy-3'-18F-Fluorothymidine in a Genetically Engineered Mouse Model of High-Grade Gliomas
- Tumor-Specific Positron Emission Tomography Imaging in Patients: [18F] Fluorodeoxyglucose and Beyond