


Abstract
3′-deoxy-3′-18F-fluorothymidine (18F-FLT) is used as a biomarker of cell proliferation. We investigated the kinetics of 18F-FLT during treatment of malignant glioma with bevacizumab and irinotecan. Methods: Fifteen patients with recurrent high-grade brain tumors (2 grade III, 13 grade IV) were studied at baseline (study 1 [S1]), after 1 course of therapy (2 wk, study 2 [S2]), and at the end of therapy (6 wk, study 3 [S3]). 18F-FLT (1.5 MBq/kg) was administered intravenously, and dynamic PET was performed for 1 h. Curves representing blood clearance and tumor uptake were derived from factor images and summed frames with thresholding techniques or with a fixed cube. The standard 18F-FLT model was used to estimate the rate constants. 18F-FLT uptake was measured at 2 time points (early standardized uptake value [SUVearly] and late SUV [SUVlate]). Results: Parameters appeared similar for curves derived from factor images and summed frames; the steepest drop occurred between S1 and S2 for transport, influx, SUVearly, and SUVlate. Three groups were distinguished on the basis of clinical outcome: patients who died within 6 mo (group 1 [G1], n = 4), survived 6–12 mo (group 2 [G2], n = 6), and survived more than 1 y (group 3 [G3], n = 5). None of the rate constants was significantly different between the groups. Long-term survivors (G3) showed a significantly different SUV change (in percentage) between S1 and S3, whereas short-term survivors (G1 and G2) did not. Conclusion: Overall, the relative SUV change from S1 to S3 predicted a favorable clinical outcome, whereas the SUV change from S1 to S2 did not. Long-term survivors (G3) showed a significant drop in SUV from S1 to S2 and from S1 to S3. Significant correlations were found between SUV and both the rate constant and the influx rate. The correlation coefficient between SUVlate and influx rate was 0.91, permitting response monitoring by the measurement of 18F-FLT uptake changes.
- 18F-FLT (3′-deoxy-3′-18F-fluorothymidine)
- positron emission tomography
- malignant brain tumor
- kinetic modeling
- factor analysis
- therapy monitoring
The imaging of cell proliferation has emerged as an avenue of monitoring neoplastic disease. 3′-deoxy-3′-fluorothymidine (FLT) labeled with 18F has provided a noninvasive way of studying cell proliferation. Although 18F-FLT is not incorporated into DNA, it is phosphorylated by thymidine kinase-1 and trapped inside the cytosol. Phosphorylated 18F-FLT appears suitable for imaging with PET (1,2) and represents thymidine incorporation into DNA, as has been demonstrated in various tumor models including 2 glioma cell lines (3). The clinical application of 18F-FLT in brain gliomas has been reported (4,5). The kinetic model has been described elsewhere (6).
Various tracers have been used to monitor therapy. For PET and glioma, results have been reported for 18F-FDG, 11C-methionine, 18F-tyrosine, and others (7–11).
The National Cancer Institute trial on recurrent glioma using PET and 18F-FLT showed that the influx rate Ki and phosphorylation rate k3 reached statistical significance in separating recurrent glioma (n = 15) from radiation necrosis (n = 4) (12). It also reported that estimates of the standardized uptake value (SUV) or visual analysis were not able to distinguish these entities. In addition, the authors of this report found that 18F-FLT performed better than 18F-FDG.
In a previous study (5), the percentage change in 18F-FLT uptake was used to categorize patients as responders (SUV decrease > 25%) or nonresponders. In the current study, we investigated the kinetics of 18F-FLT of recurrent high-grade brain tumors during treatment. These parameters provide more information than did the 18F-FLT uptake alone, and our hypothesis is that they contain predictive information. In addition, we evaluated the effect of different analysis methods and compared their results. A volume of interest (VOI) was defined to generate the input curve and another to derive the output curve. Two types of VOI were used of variable or fixed size and defined on parametric or composite images. These methods can be automated easily and are suitable quantification techniques for routine clinical applications.
The tracer kinetics were investigated with compartmental modeling. In this study, the absolute value of parameters, and their relative change, was evaluated, and the different analysis techniques were compared. In addition, 18F-FLT uptake was measured at early and late time points and expressed as SUV. The final results were correlated to clinical outcome and survival.
MATERIALS AND METHODS
Patients
Twenty patients with recurrent glioma were prospectively enrolled. Nine were included from our previous study (5), and 11 were newly enrolled. All patients underwent dynamic 18F-FLT studies at baseline and during therapy, after which, 4 patients had to be removed because of technical issues (2 had severe head motion during the study, 1 had an incomplete study, and the other had an infiltrated dose [inadequate bolus with activity remaining in the arm]). One patient had a complete response to therapy; no tumor could be delineated in the 18F-FLT PET study after treatment, and kinetic modeling failed.
The final study population consisted of 15 patients (6 men and 9 women; average age, 53 y; age range, 26–77 y). The study was approved by our Institutional Review Board, and all patients signed an informed consent form. Histopathology revealed 13 grade IV tumors (glioblastoma multiforme) and 2 grade III tumors (anaplastic astrocytoma and anaplastic mixed glioma). Each patient underwent 3 studies: at baseline (study 1 [S1]), after 1 course of therapy (average interval, 16 ± 6 d; study 2 [S2]), and after 3 courses of therapy (average interval, 30 ± 8 d; study 3 [S3]). For every patient, the most active tumor (i.e., highest 18F-FLT uptake) at baseline was selected. Therapy consisted of biweekly cycles of bevacizumab (10 mg/kg) and irinotecan (125 or 350 mg/m2). Table 1 shows the population data, grade, number of treatments, and pathology of the malignant gliomas.
Population Data
Image Acquisition
18F-FLT was synthesized by a modification of a previously reported procedure (13). A 1.5 MBq/kg (0.04 mCi/kg) dose of 18F-labeled FLT was administered. PET was performed using an ECAT HR+ system (CTI/Siemens). A transmission scan (2-dimensional mode) of 5-min duration was acquired first. 18F-FLT was administered intravenously, and a dynamic acquisition (3-dimensional mode) was started simultaneously. Twenty-three frames (8 × 15, 2 × 30, 2 × 60, and 11 × 300 s) were acquired. The images were reconstructed with iterative techniques as described elsewhere (14). The following parameters were used: maximum a posteriori for the transmission scan and ordered-subset expectation maximization for the emission scan, corrections for attenuation and scatter, and a gaussian kernel of 5 mm in full width at half maximum as a postreconstruction smoothing filter. The final reconstructed volume set had a matrix size of 128 × 128 and consisted of 63 planes. The voxel size was 2.06 × 2.06 × 2.425 mm, using a zoom of 2.5 in the axial planes.
Processing
Factor analysis was performed on the volume set of reconstructed images as described elsewhere (15). Briefly, factor analysis evaluates temporal changes in dynamic datasets and generates functional images of the vessels, tumor, brain structures, bone marrow, and the like. Rebinning produced a dataset with 4.1 × 4.1 × 4.9 mm voxels that was used for further processing. For our application, factor analysis generated 3 factors and corresponding factor images, which are the associated spatial distribution of a factor. Factor 1 represents the large vessels and factor 2 the tumors in the brain. For every patient, studies were available at 3 time points (S1, S2, and S3). For the blood curve, VOIs were generated using a 50% threshold of the maximum voxel in the transverse sinuses. These VOIs for the input function were generated completely automatically with our processing modules. For the brain tumor, VOIs were derived from factor images (F2) or summation of frames between 45 and 60 min (Sum), using simple thresholding techniques. The effect of varying isocontours (55%−75%) was investigated. In this threshold method, both the shape and the size of the VOI varied between studies. In another analysis, a cube of 5 × 5 × 5 voxels (10 × 10 × 12 mm = 1.2 cm3) was generated and positioned around the voxel with maximum tumor uptake on the factor images (F2-cube) or summed frames (Sum-cube). In this cube analysis, the shape of the VOI is constant across studies, but the location is related to the maximum count in the tumor.
Compartmental Model
The kinetic model for 18F-FLT is based on the original work of Shields et al. (1). Our implementation for the brain was published elsewhere (6). Briefly, the model assumes a transport step of 18F-FLT from the vascular to the tissue space. There is no partitioning in the vascular space, and plasma and whole-blood activity concentrations are the same (16). In the tissue space, there is an exchangeable compartment (with intact 18F-FLT) and a compartment with phosphorylated 18F-FLT (mono-, di-, and triphosphate 18F-FLT). 18F-FLT is metabolized by the liver to 18F-FLT–glucoronide, which is present only in the vascular space—that is, not transported into the brain-tissue compartment. Metabolites were corrected by subtracting a metabolite fraction from the vascular curve. This fraction was calculated as 0.42 × (1−exp[−0.029 × time]) as explained in our earlier publication (6). Kinetic modeling yields the 4 rate constants (k1, k2, k3, and k4) between compartments. The blood volume fraction in tissue Vb was estimated as a fifth parameter. The influx rate constant Ki was calculated as k1k3(k2 + k3)−1 and the volume of distribution Vd as k1(k2 + k3)−1. Metabolite correction of the blood curve to yield the input function was performed as described previously (6). A recovery coefficient of 0.7 was chosen to convert the image-based blood time–activity curve to the input function. Because the tumors, compared with the image resolution, are relatively large the recovery coefficient of the output function was set to unity.
Outcome Analysis
Of the 15 patients studied, 4 died within 4 mo (group 1 [G1]) and 6 died between 6 and 12 mo (group 2 [G2]). The remaining 5 survived for more than 1 y (group 3 [G3]). The overall survival time and time between initial diagnosis and current study treatment are given in Table 1. The median survival was 94 d for G1, 331 d for G2, and 542 d for G3. The patient with the complete response (no 18F-FLT uptake after treatment) had an overall survival of 1,054 d.
Statistical Analysis
Results are presented as the mean ± SD. The Student t test was used to compare the kinetic parameters and 18F-FLT uptake. For small sample sizes (n < 10), the Wilcoxon Mann–Whitney U test (2-sample rank test) was applied. Pearson correlation was used to study the relationship between subgroups.
RESULTS
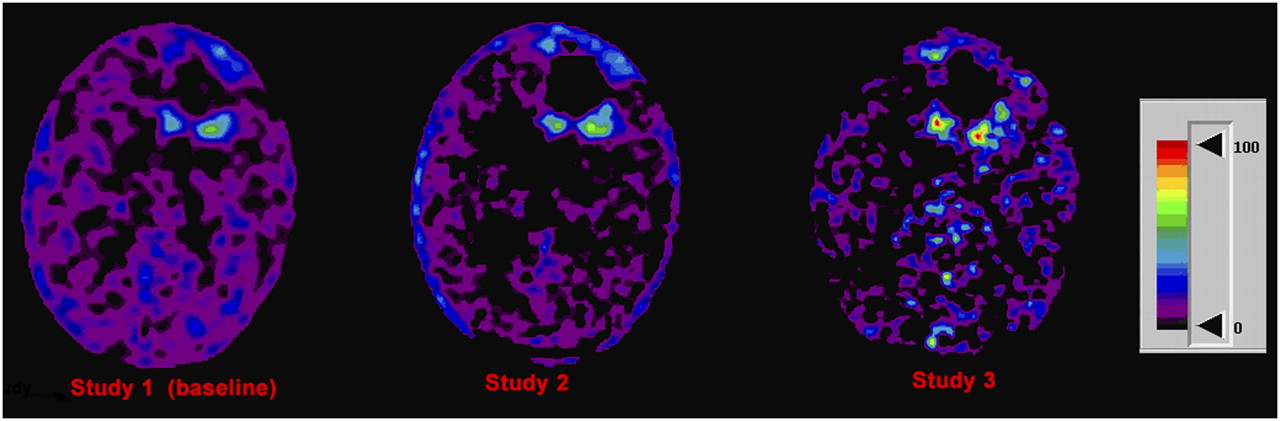
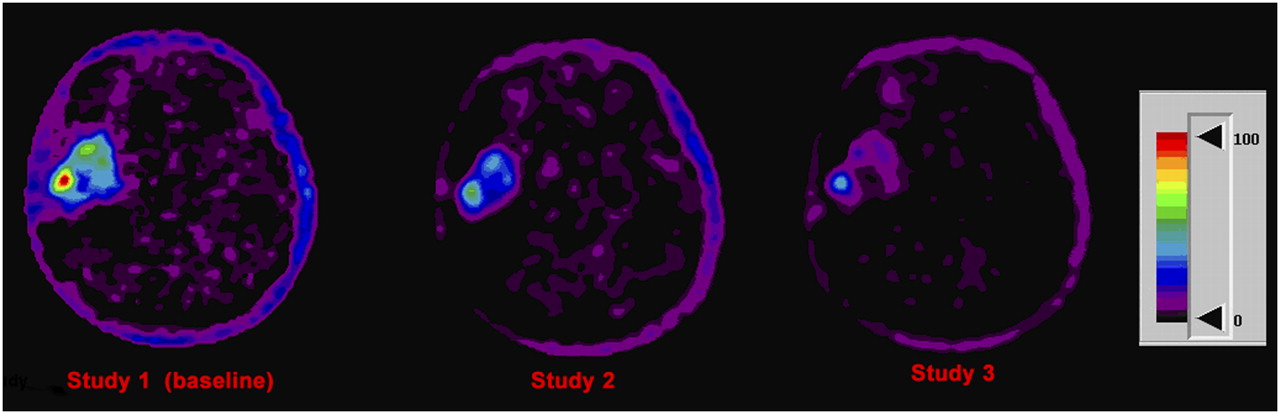
In Figure 1, for each of the 3 studies a representative factor slice is shown for a short-term survivor (G1). Figure 2 shows an example for a long-term survivor (G3).

Representative factor images from patient 2 of G1. Note increasing intensity (proportional to 18F-FLT influx rate) from S1 to S3. Images are displayed using same color scale (shown in arbitrary units).

Representative factor images from patient 13 of G3. Note decreasing 18F-FLT influx rate from S1 to S3. Images are displayed using same color scale (in arbitrary units).
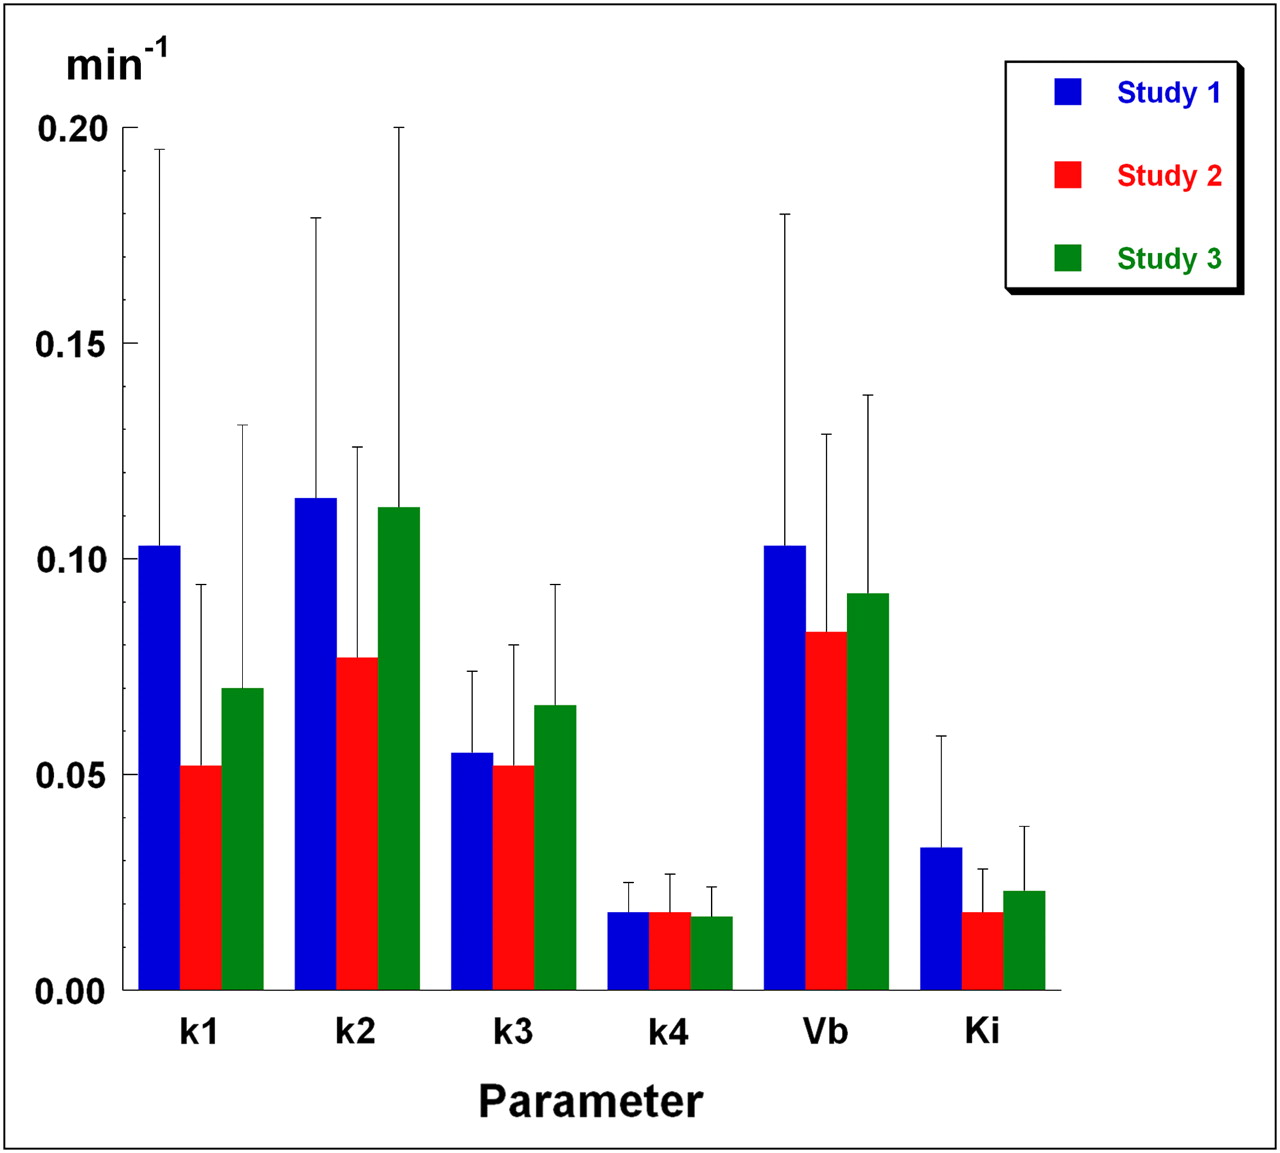
Comparison of the varying thresholds of the tumor VOI delineated on the factor images (F2, threshold 55%−75%) showed similar results for the parameter values of k1, Ki, Vb, early SUV (SUVearly), and late SUV (SUVlate). The correlation coefficients of these parameters between thresholding methods were high and ranged from 0.91 to 0.99 both for the entire set (n = 45) and for the 3 study sets (S1, S2, and S3; n = 15 each). Intermediate correlations (0.7 < r < 0.9) were found for k2 and Vd, whereas k3 and k4 showed poor correlations (r < 0.6). Figure 3 shows the average results of all patients for the 3 sets of studies, using tumor VOIs delineated on summed frames (Sum-75%). Results in Figure 3 suggest a trend for k1, but no significantly different results were obtained for the absolute value of the parameters tested. The study after the first course of treatment (S2) generally shows lower parameter values, with a tendency to rebound at S3, except for k4. Considering the absolute values of the entire population, no statistical differences were found for the micro- or macroparameters between time points S1, S2, and S3 for any of the analysis methods (F2-55%−75%, Sum-75%, F2-cube, or Sum-cube).

Average results per study (S1–S3) for rate constants (k1–k4), Vb, and Ki. Bars denote SD. VOIs are delineated with threshold of 75% on summed images from 45 to 60 min. n = 15 for each column. None of shown parameters demonstrates significant differences for mean between S1, S2, or S3. Dimension of k1–k4 and Ki is min−1, whereas Vb is fraction (unitless).
Subsequently, the relative parameter change defined as (S1−S2)/S1 or (S1−S3)/S1 (i.e., fraction of change) was evaluated. In Figure 4, box plots are shown depicting the relative changes between S1 and S2 (left panel) and between S1 and S3 (right panel). Figure 4 shows narrow plots for k1 at an early time point, with large variability later for G1 and G2. G3, on the other hand, shows consistently small variability between S1 and S3 for all 3 parameters. The variability of k3 is large (except of G3 for S1→S3), signifying large fluctuations in phosphorylation rate during therapy.
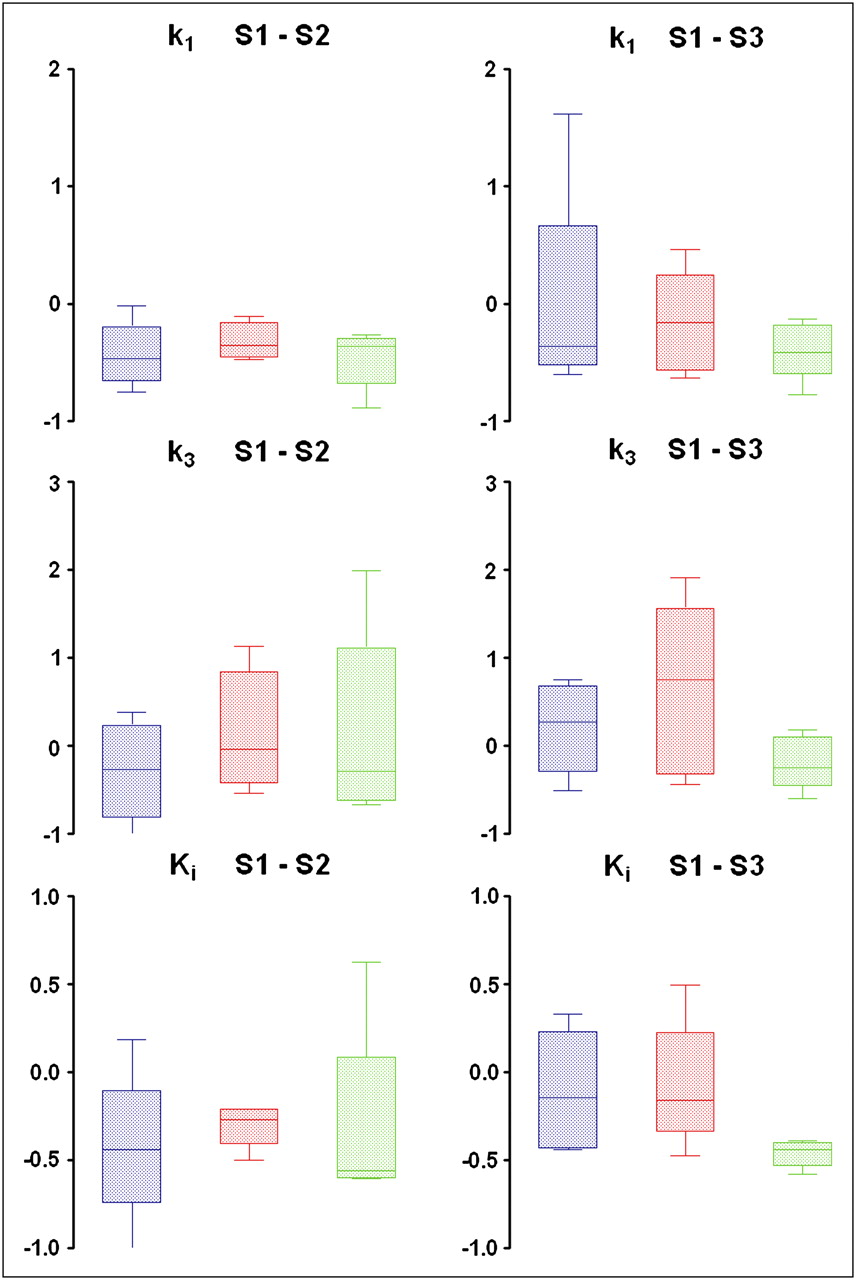
Box plots of relative changes for parameters k1, k3, and Ki. On left, relative changes between S1 and S2 are shown; on right, fractional changes between S1 and S3 are shown. Note small variability in k1 for S1→S2 for all 3 groups. Variability for G3 (green) remains small for S1→S3 for all 3 parameters shown. For k3, wide variability in relative changes exists, except for G3 between baseline and end of therapy. blue = G1; red = G2; green = G3.
Table 2 shows the population mean using the factor images with varying threshold and the summed images with 75% threshold. Inspection of the cube VOIs showed a similar pattern. None of the parameter values showed significant differences between the 4 methods analyzed: threshold VOI or cube VOI on factor or summed images. When we compared the tumor volume (in voxels), VOIs obtained with a threshold of 70% on the factor images (F2-70%) fitted best with a threshold of 75% on the summed images (Sum-75%), and linear regression analysis furnished a slope of 1.050 and intercept of 0.077 (r = 0.87). Figure 5 shows the scatter diagram for Ki for a variable VOI (F2-70%) versus a fixed VOI (Sum-cube).
Kinetic Modeling Parameters (Mean ± SD) for Various Analysis Methods

Comparison of Ki obtained with method F2-70% (y-axis) vs. Sum-cube (cube around maximum tumor voxel of frames summed from 45 to 60 min, x-axis).
The same techniques were used to measure the SUV, either threshold VOIs or a fixed cube, on the factor or summed images. 18F-FLT uptake reaches a maximum around 10–20 min (4,6); therefore, we calculated SUVearly (from 10 to 25 min) and SUVlate (from 50 to 60 min). The average value for SUVearly was 0.83 and for SUVlate 0.85. Both have a high correlation coefficient, compared with Ki (0.86 and 0.90, respectively).
A scatter plot of SUVlate versus Ki for the 3 studies is shown in Figure 6. The parameters at each time point, S1–S3, show an excellent correlation and similar slopes; none of the regression parameters was significantly different. The range of the parameters shows a decrease, both for Ki and SUVlate, when proceeding from the baseline study S1 to either S2 or S3.

Scatter diagram of influx rate constant Ki vs. 18F-FLT uptake SUVlate for 3 studies analyzed with cube VOI around tumor on 45- to 60-min summed image. Correlation coefficients were 0.89 for S1 (P < 0.001), 0.88 for S2 (P < 0.001), and 0.92 for S3 (P < 0.001).
Tumor Kinetics and Survival
The kinetic parameters were compared with clinical outcome, and patients were grouped arbitrarily into 6-mo survival periods. Four patients with glioblastoma died within 4 mo of the 18F-FLT study (G1), 6 patients survived 6–12 mo after therapy (G2), and the remaining 5 survived more than 1 y (G3). Detailed inspection of the absolute values of the various parameters did not reveal any statistically significant differences between patient groups or studies. However, analyzing the relative or fractional change between studies—that is, from S1 to S2 (ΔS1→S2) or from S1 to S3 (ΔS1→S3)—revealed several significant differences. For the factor-derived tumor VOI (F2-70%), significant differences were found for k1, Ki, SUVearly, and SUVlate in G2 for ΔS1→S2 and in G2 and G3 for both ΔS1→S2 and ΔS1→S3. For the Sum-75%, tumor VOI significant differences in Ki and SUV were found only for G3 for both ΔS1→S2 and ΔS1→S3. More significant differences were found for the cubes positioned around the maximum tumor uptake than for the variable VOIs. For F2-cube, parameters Vb, Ki, Vd, and SUV showed a significant relative change in G3 for both ΔS1→S2 and ΔS1→S3. The same was true for Sum-cube. In addition, this latter cube VOI found significant differences in G2 for Ki and Vd both for ΔS1→S2 and for ΔS1→S3. Combining G1 and G2 (n = 10) and comparing these parameters with G3 (n = 5) yielded the same statistically significant differences as before. Thus, most significant relative changes between studies were found with a cube of 5 × 5 × 5 voxels around the tumor maximum. Using a variable tumor VOI reduced the number of significant changes, and in general, only relative changes in Ki and SUV remained statistically significant. SUV changes were always significantly different for G3, both for early and for late time points (Fig. 7).

Average relative change in 18F-FLT uptake SUVearly (top, blue) and SUVlate (bottom, red) from S1→S2 and S1→S3 with method F2-cube. Three groups of patients are shown: G1 (survival, <6 mo), G2 (survival, 6–12 mo), and G3 (survival, >12 mo). Results are normalized to baseline study (SUV = 1); bars denote SD. Significant differences (P < 0.01) are denoted with an asterisk and were found for G3 both for SUVearly and SUVlate.
Results with regard to SUV changes of more than 25%, which was the criterion used to define a responder in our earlier study (5), revealed that G3 had a 100% sensitivity both for ΔS1→S2 and for ΔS1→S3. These relative changes were statistically significant (P < 0.01).
DISCUSSION
In this study, the kinetics of 18F-FLT in malignant brain tumors were investigated at baseline and during treatment and stratified to clinical outcome. Our analysis is completely image-based and virtually operator-independent. The input function was derived automatically from factor images of the transverse sinuses; no user interaction was required. The tumor VOIs were derived with thresholding techniques or defined as a cube around the voxel with maximum 18F-FLT uptake. In earlier work, we have demonstrated that factor analysis can reliably generate input and output functions (17–22). In another study, we have shown that a general 3-compartment model is adequate for describing the 18F-FLT kinetics of malignant brain tumors. As shown by Shields et al., the 18F-FLT model is a noninvasive way for evaluating cellular proliferation (2). 18F-FLT influx rate is a representation of thymidine flux or incorporation rate into DNA (1), as was demonstrated by Chen et al. (4,5) and by Ullrich et al., who found that 18F-FLT uptake correlated with in vivo proliferation rate in newly diagnosed high-grade gliomas (11).
In this study, we used a total dynamic acquisition time of 1 h. This acquisition time is 15 min shorter than that in our study of 2007 (16). The mathematic studies of Muzi et al. (16) have shown that the errors (defined as SEE/mean) increase when the acquisition duration is decreased from 120 to 60 min. For k1, the increase is from 13% to 15% and for Ki from 4% to 9%, which are still acceptable. The error for k4 is 42%, whereas the other parameters have already more than 55% errors for the 2-h scan.
Another approach would be to set k4 to zero to minimize errors in the parameter estimates. Although k4 is small, it cannot be neglected as we have shown in earlier work (2,16). Muzi et al. came to a similar conclusion in their mathematic studies (16).
The subdivision into groups G1, G2, and G3 was based on survival—that is, average survival of 3.4, 10.2, and 18.5 mo, respectively. In general, the largest relative change in parameters was seen between baseline and 2 wk of therapy (ΔS1→S2), as shown in Figures 3 and 7. Thereafter, the trend reveals that the changes persist for G3, whereas G1 returns to normal. These changes between baseline and end of therapy monitoring (ΔS1→S3) revealed significant differences for Vb and Vd, and for Ki, SUVearly, and SUVlate, for the analysis methods using a cube (fixed-volume VOI). When thresholding techniques with variable-volume tumor VOIs were used, the number of significant changes decreased for Ki, SUVearly, and SUVlate and mainly for G3, suggesting that a persistently decreased 18F-FLT uptake in the tumor was a predictor for longer survival (Fig. 7).
Other reported studies (2,16) have shown that transport to the cells is fast and primarily determined by perfusion, whereas the phosphorylation reaction (k3) is the rate-limiting step, determining uptake and retention of 18F-FLT in somatic tissue (16). This finding suggests that simple semiquantitative analysis (SUV) is sufficient for clinical applications, as was shown here (Fig. 6) for the different patient groups (G1, G2, and G3) and time points (S1, S2, and S3). This observation is not supported by the work of the Cologne group, who claims that the association between Ki and uptake is tumor grade–dependent and does not apply within 1 World Health Organization grade (11). In an earlier study from this group (8), a significant correlation was found between 18F-FLT uptake and both k1 and k3, suggesting that the 18F-FLT uptake is related to a combination of factors. As shown in Figure 6, we found an excellent correlation between 18F-FLT uptake and influx rate Ki (containing both k1 and k3). Contrary to the studies of the Cologne group, we corrected the input function for metabolites. In addition, we enrolled only patients with recurrent glioma. The correlations between k1 and SUV were always high (r > 0.7), but between k3 and SUV, we found a correlation coefficient of 0.6–0.7 for the baseline study (S1) only. The later studies S2 and S3 did not show any relationship (r < 0.2).
Other investigators have used 11C-methionine for evaluating response to therapy. Galldiks et al. (23) reported that 11C-methionine was able to measure a response after 3 cycles of temozolomide, offering a method to measure biologic activity. Jacobs et al. (8) compared 11C-methionine directly with 18F-FLT and indicated that the 2 tracers have an uptake that is not related. 11C-methionine has a high sensitivity and specificity for glioma. These authors suggested that 18F-FLT helps differentiate low- from high-grade tumors and yields complementary information. Ceyssens et al. (24), on the other hand, argue that interindividual 11C-methionine uptake does not permit individual grading. They conclude that the clinical use of 11C-methionine is limited to recurrence detection, biopsy guidance, and radiation therapy target delineation. In our study, we found significant changes in 18F-FLT uptake and influx rate in a subgroup of long-term survivors after 1 course of therapy.
In the National Cancer Institute trial, 18F-FLT was able to separate recurrence from radionecrosis (12). Parameters Ki and k3 reached statistical significance. These authors emphasized that simple blood–brain barrier breakdown might increase transport without affecting the influx (retention in the salvage pathway). This finding is not consistent with what we reported earlier (5). 18F-FLT uptake was measurable in stable patients with recurrent glioma, who had an intact blood–brain barrier, because they had no contrast enhancement on gadolinium-enhanced T1-weighted MRI (4).
Limitations of this study are the small numbers of patients per subgroup. On the other hand, all tumors were recurrent and high-grade, minimizing heterogeneity. Despite the small number of patients, robust effects were found for the relative change of parameters between S1 and S2 (ΔS1→S2) that were statistically significant. If the decreased uptake of 18F-FLT persists between S2 and S3, the patient is likely to have a good prognosis and will survive longer (G3 in Fig. 7).
CONCLUSION
18F-FLT kinetics were investigated during treatment of recurrent high-grade brain tumors. The standard 3-compartment model with corrections for Vb, metabolites, and partial volume was used to estimate kinetic parameters. Several analysis methods, including variable versus fixed tumor VOI (defined on factor vs. summed images), were compared. A cube with a fixed volume of 1.2 cm3 defined on the summed images from 45 to 60 min after 18F-FLT injection yielded the highest number of significant differences between the subgroups. The largest change of kinetic parameters occurred between baseline and 2 wk of treatment. Significant changes were found for Vb, Ki, Vd, SUVearly, and SUVlate. After stratification to overall survival, the patients with the best prognosis showed a change at 2 wk of treatment that persisted at 6 wk, whereas the patients with short survival times (G1) returned to baseline values at 6 wk. High correlations were found between 18F-FLT uptake in tumor (SUV) and influx rate constant (Ki), indicating that in clinical practice simple uptake measurements are sufficient for therapy monitoring and predicting short- and long-term survival.
Footnotes
-
Guest Editor: Wolf-Dieter Heiss, Max-Planck-Institut für Neurologische Forschung
-
COPYRIGHT © 2010 by the Society of Nuclear Medicine, Inc.
References
- Received for publication July 13, 2009.
- Accepted for publication January 26, 2010.


Jump to section
Related Articles
Cited By...
- Repeatability of 18F-FLT PET in a Multicenter Study of Patients with High-Grade Glioma
- Lessons From Anti-Vascular Endothelial Growth Factor and Anti-Vascular Endothelial Growth Factor Receptor Trials in Patients With Glioblastoma
- A Monte Carlo Study of the Dependence of Early Frame Sampling on Uncertainty and Bias in Pharmacokinetic Parameters from Dynamic PET
- Correlation of 18F-FLT Uptake with Tumor Grade and Ki-67 Immunohistochemistry in Patients with Newly Diagnosed and Recurrent Gliomas
- 3'-Deoxy-3'-18F-Fluorothymidine PET-Derived Proliferative Volume Predicts Overall Survival in High-Grade Glioma Patients
- PET/MRI for Neurologic Applications
- 3'-Deoxy-3'-18F-Fluorothymidine PET and MRI for Early Survival Predictions in Patients with Recurrent Malignant Glioma Treated with Bevacizumab
- Discriminant Analysis of 18F-Fluorothymidine Kinetic Parameters to Predict Survival in Patients with Recurrent High-Grade Glioma