


Abstract
18F-3′-Deoxy-3′-fluorothymidine (18F-FLT) is a PET tracer that accumulates in proliferating tissues. The current study was undertaken to determine whether equilibrative nucleoside transporter 1 (ENT1) is important for 18F-FLT uptake in normal tissues and tumors. Methods: ENT1-knockout (ENT1−/−) mice were generated and compared with wild-type (ENT1+/+) mice using small-animal 18F-FLT PET. In addition, ENT1+/+ mice were also injected with the ENT1 inhibitor nitrobenzylmercaptopurine ribonucleoside phosphate (NBMPR-P) at 1 h before radiotracer injection, followed by 18F-FLT small-animal PET. Tissues of interest were analyzed for thymidine kinase 1 and nucleoside transporters by immunoblotting and immunohistochemistry, respectively, and plasma thymidine levels were analyzed by liquid chromatography–mass spectrometry. Human lung carcinoma A549 cells were stably transfected with pSUPER-producing short-hairpin RNA against human ENT1 (hENT1) or a scrambled sequence with no homology to mammalian genes (A549-pSUPER-hENT1 and A549-pSUPER-SC, respectively). Cultured transfected cells were characterized for hENT1 transcript levels and 18F-FLT uptake using real-time polymerase chain reaction and 3H-FLT uptake assays, respectively. Transfected A549 cells were grown as xenograft tumors in NIH-III mice, which were analyzed by 18F-FLT small-animal PET. Results: Compared with noninjected ENT1+/+ mice, ENT1+/+ mice injected with NBMPR-P and ENT1−/− mice displayed a reduced percentage injected dose per gram (%ID/g) for 18F-FLT in the blood (84 and 81%, respectively) and an increased %ID/g for 18F-FLT in the spleen (188 and 469%, respectively) and bone marrow (266 and 453%, respectively). ENT1−/− mice displayed 1.65-fold greater plasma thymidine levels than did ENT1+/+ mice. Spleen tissue from ENT1+/+ and ENT1−/− mice displayed similar thymidine kinase 1 protein levels and significant concentrative nucleoside transporter 1 and 3 staining. Compared with A549-pSUPER-SC cells, A549-pSUPER-hENT1 cells displayed 0.45-fold hENT1 transcript levels and 0.68-fold 3H-FLT uptake. Compared with A549-pSUPER-SC xenograft tumors, A549-pSUPER-hENT1 xenograft tumors displayed 0.76-fold %ID/g values (ex vivo γ-counts) and 0.65-fold maximum standardized uptake values (PET image analysis) for 18F-FLT uptake at 1 h after tracer injection. Conclusion: Loss of ENT1 activity significantly affected 18F-FLT biodistribution in mice and 18F-FLT uptake in xenograft tumors, suggesting that nucleoside transporters are important mediators of 18F-FLT uptake in normal and transformed cells.
The PET tracer 18F-3′-deoxy-3′-fluorothymidine (18F-FLT) is used to indirectly monitor tissue proliferation (1). 18F-FLT is a permeant for 4 different human nucleoside transporters (hNTs) including human equilibrative nucleoside transporter 1 (hENT1), hENT2, human concentrative nucleoside transport 1 (hCNT1), and hCNT3 (2). hENTs facilitate the bidirectional movement of 18F-FLT across membranes, whereas hCNTs are symporters that mediate the influx of 18F-FLT and cations (3). On cellular entry, 18F-FLT is selectively phosphorylated by the cell cycle–regulated thymidine kinase 1 (TK1) (4). TK1 expression is greatest during the late G1/S phase, which allows proliferating cells to generate greater levels of 18F-FLT monophosphate (5). Phosphorylated 18F-FLT is trapped inside cells because hNTs cannot transport nucleotides, and most cells do not possess nucleotide-specific, outwardly directed transporters.
Although 18F-FLT phosphorylation by the cell cycle–regulated TK1 is considered to be the key regulator of 18F-FLT uptake, several clinical trials have found no correlation between 18F-FLT uptake and proliferation markers in tumors (6–8), suggesting that other cellular proteins may significantly influence 18F-FLT uptake. We previously reported that the specific inhibition of hENT1 by nitrobenzylmercaptopurine ribonucleoside (NBMPR) caused at least 50% inhibition of mediated 18F-FLT uptake in 6 different cultured cell lines (2). To determine whether ENT1 significantly affected 18F-FLT biodistribution, ENT1-knockout mice (ENT1−/− mice) and wild-type mice (ENT1+/+ mice) injected with NBMPR phosphate (NBMPR-P) were analyzed using 18F-FLT small-animal PET. To determine whether hENT1 significantly affected 18F-FLT uptake in a tumor model, 18F-FLT small-animal PET was performed on mice bearing xenograft tumors comprising the lung carcinoma A549 cell line that had been stably transfected with short-hairpin RNA (shRNA) against hENT1. The results suggest that ENT1 significantly affects 18F-FLT uptake in normal and transformed tissues.
MATERIALS AND METHODS
Radiotracers
18F-FLT was radiosynthesized at the Edmonton PET Center according to the procedure of Machulla et al. (9) using a TracerLab-FX automated synthesis unit (GE Healthcare) and 5′-O-(4,4′-dimethoxytrityl)-2,3′-anhydrothymidine as a precursor (ABX GmbH). 18F-FLT specific activity was approximately 65 TBq/mmol. 3H-FLT was purchased from Moravek Biochemicals, Inc., and had a specific activity of 174 GBq/mmol.
Cell Culture
Human lung carcinoma A549 cells, which were obtained from the American Type Culture Collection, were cultured in RPMI 1640 medium with 10% fetal bovine serum. To knock down hENT1 in A549 cells, the pSUPER.neo plus green fluorescence protein vector (Oligoengine) was stably transfected into A549 cells according to the manufacturer's instructions. The pSUPER vector was modified to express shRNA against nucleotides 1535–1553 of hENT1 mRNA (pSUPER-hENT1) or a random scrambled sequence with no homology to mammalian genes (pSUPER-SC).
A549 cells were transfected with either pSUPER-SC or pSUPER-hENT1 using the FuGENE 6 Transfection Regent (Roche Applied Science) according to the manufacturer's instructions, and at 24 h after transfection, cells were grown in medium containing 350 μg of geneticin per milliliter for at least 2 wk to select for transfected cells. Individual geneticin-resistant cells were obtained by limited dilution and expanded. Cell colonies with green fluorescence protein were tested for hENT1 levels using NBMPR binding assays (10). A549 cells transfected with pSUPER-hENT1 with the smallest amount of NBMPR binding were designated A549-pSUPER-hENT1, and A549 cells transfected with pSUPER-SC with unchanged levels of NBMPR binding sites (compared with that of untransfected A549 cells) were designated A549-pSUPER-SC.
Animal Models
Animal work in this study was approved by the Cross Cancer Institute Animal Care Committee. For all small-animal PET experiments, female mice of at least 10 wk of age were used and experiments were performed at least 3 times. Heterozygote ENT1+/− mice were obtained from Lexicon Pharmaceuticals, Inc., and subsequently bred to generate the ENT1−/− strain (mouse ENT1 [mENT1]-m1-cec). ENT1−/− mice have a retroviral vector insert between exons 2 and 3 of the mENT1 locus. The retroviral insert contained a splice acceptor and splice donor sequence that created a fusion transcript that altered ENT1 function. The heterozygotes, generated in C57B16 albino mice, were subsequently back-crossed with FVB/N mice for 6 generations; FVB/N mice (ENT1+/+ mice) were, therefore, used as controls.
Xenograft tumors were established in 9 isoflurane-anesthetized NIH-III mice (Charles River Laboratories) by injecting 3 × 10⁶ A549-pSUPER-SC and A549-pSUPER-hENT1 cells (resuspended in RPMI plus 10% fetal bovine serum and Matrigel [BD Biosciences]) above the left and right thighs, respectively. After 3–6 wk, when tumors had reached approximately 250 mm3 in volume, 5 mice were used for imaging experiments and 4 mice were used for analysis of tumor TK1 protein levels.
Real-Time Quantitative Reverse-Transcriptase Polymerase Chain Reaction (RT-PCR)
TaqMan (Applied Biosystems) real-time RT-PCR of mENT1, hENT1, TK1, and glyceraldehyde-3-phosphate dehydrogenase (GAPDH) was performed as previously described (2). Probes and primer for mENT1 and TK1 were purchased as kits from Applied Biosystems, and probes and primers for hENT1 and GAPDH were as previously described (2). Relative quantification of RNA was determined using the ΔΔCT method, using GAPDH to control for RNA-loading differences (11).
Small-Animal PET
For biodistribution experiments, 10 ENT1+/+, 6 ENT1−/−, and 5 ENT1+/− mice were anesthetized with isoflurane and injected with 100 μL of saline containing 2–10 MBq of 18F-FLT via the jugular or lateral tail vein. Four ENT1+/+ mice were given an intraperitoneal injection of 15 mg of NBMPR-P per kilogram at 1 h before imaging—an amount sufficient to inhibit mENT1 with no observed animal toxicity (12).
For each imaging experiment, 1 or 2 mice were anesthetized with isoflurane, placed in a microPET R4 scanner (Siemens Medical Solutions), and dynamically imaged (60-min emission scans) using microPET Manager software (version 2.1.5.0; Siemens Medical Solutions). For PET scans involving tumor-bearing NIH-III mice, catheters were placed in the lateral tail veins and 60-min emission scans were started 15 s before 18F-FLT injection. After imaging, mice were euthanized, and tissues of interest were collected, weighed, and analyzed for radioactivity using a Wizard 3″ 1480 automatic γ-counter (Perkin Elmer).
PET Image Analysis
PET images were analyzed using ROVER software (version 2.0.21; ABX GmbH). Masks for defining 3-dimensional regions of interest (ROIs) were set, and the ROIs were defined by applying a threshold. ROI time–activity curves were generated for subsequent data analysis. Standardized uptake values ([activity per mL of tissue]/[injected activity per body weight], g/mL) were calculated for each ROI.
Tracer kinetics were analyzed using a 3-compartment model as previously validated for 18F-FLT (13). Volumes of interest were defined in each mouse for both tumors and the blood input function. ROIs for the blood input function were drawn over the heart. A threshold of 80% maximum over the heart was used to obtain ROIs between 5 and 15 mm3, and the previously described volume-correction factor was applied (14). The model is described by 4 kinetic parameters (K1, k2, k3, and k4) and the fractional blood volume (fbv), which accounts for the nonzero vascular space within the tumor ROI. The analysis was performed by fitting the measured tumor time–activity curves with a 2-exponential model of the general form:
TK1 Immunoblotting
Spleen and tumor tissues were excised from euthanized mice and immediately frozen in liquid nitrogen. At a later date, spleen tissues were pulverized using a mortar and pestle containing liquid nitrogen and resuspended in 100 μL of lysis buffer (10 mM Tris HCl, pH 7.5; 150 mM NaCl; 1% Nonidet P-40; 1% deoxycholate; 2 mM ethylenediaminetetraacetic acid; 0.1% sodium dodecyl sulfate, and protease inhibitors). Spleen samples were incubated at 4°C for 60 min, followed by centrifugation at 15,000g for 10 min, and supernatants were frozen at −80°C and used later for TK1 immunoblotting. Tumor samples were also pulverized using a mortar and pestle containing liquid nitrogen and resuspended in 1 mL of swelling buffer (1 mM ZnCl2, 10 mM Tris-HCl, 0.3 mM phenylmethylsulfonyl fluoride, and 0.5 mM dithiothreitol) containing protease inhibitors. Tumor resuspensions were passed through a 21-gauge needle at least 15 times, and cell lysates were centrifuged at 13,500g for 30 min at 4°C. The supernatants were placed in a −80°C freezer and used later for TK1 immunoblots. Protein content in supernatants was determined using the Bio-Rad protein assay kit (Bio-Rad).
The immunoblotting procedure was as previously described, with the following modifications (15). Spleen and tumor samples were heated to 95°C for 5 min, loaded at 200 and 20 μg of protein per lane, respectively, and subjected to electrophoresis on 12% polyacrylamide gels. Primary antibodies were mouse TK1 and β-actin (1 in 500 and 5,000 dilution, respectively), and secondary antibodies were goat antimouse IgG antibodies conjugated with horseradish peroxidase (1 in 15,000 dilution).
Immunoblot films were scanned, and digital images were analyzed with MetaMorph Offline software (version 7.6.4.0; MDS Analytic Technologies) to determine relative levels of TK1. TK1 band intensities were divided by those of β-actin to determine normalized TK1 protein levels.
Mouse Nucleoside Transporter (NT) Immunohistochemistry
The immunohistochemistry procedure was performed as previously described (16). Rabbit antibodies were generated against mouse concentrative nucleoside transporter 1 (mCNT1) and mCNT3 using mCNT peptides corresponding to amino acids 30–55 and 61–84, respectively, and primary antibodies were added at 60 and 57 μg/mL, respectively. Negative controls were obtained by omitting primary antibodies from the procedure.
Liquid Chromatography–Mass Spectrometry (LC-MS)
Plasma thymidine levels in 3 ENT1+/+ and ENT1−/− mice were analyzed with LC-MS as previously described (17). Alkalinized plasma samples were passed through Extract-Clean anion-exchange solid-phase extraction columns (Grace Davison Discovery Science), and LC-MS was performed using a 150 × 3 mm Platinum C18-EPS 3-μm column (Grace Davison Discovery Science) on an Agilent 1100 system (Agilent Technologies). Samples were ionized using atmospheric pressure chemical ionization in an Agilent 1946D mass spectrometer (Agilent Technologies). Data acquisition and analysis were performed using Agilent ChemStation (version 10.02) software.
3H-FLT Uptake in Cultured Cells
Uptake assays were performed as previously described (10). Briefly, A549 cells were inoculated in 24-well plates at 105 cells per well and incubated for 24 h at 37°C. Cells were then washed once with phosphate-buffered saline, followed by incubation for 60 min at 37°C with 100 nM 3H-FLT in Dulbecco's modified Eagle's medium plus 10% calf serum. Cells were washed 3 times with phosphate-buffered saline and incubated with 0.5 M KOH for 60 min. Cell lysates were analyzed for radioactivity using liquid scintillation counting.
Statistical Analysis
Statistical analysis was performed using Excel (version 2003; Microsoft) or Prism (version 4.03; GraphPad Software). Unpaired t tests were used for all data except xenograft tumor data, which used paired t tests for tumors in the same mouse. Data were presented as mean ± SEM and considered statistically significant if the P value was less than 0.05.
RESULTS
Characterization of ENT1 Transcript Levels in ENT1−/− Mice
Tissues of interest from ENT1+/+ and ENT1−/− mice were analyzed for ENT1 transcript levels using TaqMan real-time quantitative RT-PCR. Supplemental Figure 1 (supplemental materials are available online only at http://jnm.snmjournals.org) displays a representative real-time RT-PCR experiment with no detectable mENT1 transcripts in ENT1−/− mouse spleen but significant mENT1 transcripts detectable in ENT1+/+ mouse spleen. In all 10 tissues analyzed, ENT1−/− mice displayed no detectable mENT1 transcripts, whereas ENT1+/+ mice displayed various levels of mENT1 transcripts (results not shown).
18F-FLT PET with ENT1-Altered Mice
To determine how ENT1 affects 18F-FLT biodistribution, ENT1+/+, ENT1−/−, and ENT1+/− mice were analyzed with 18F-FLT PET (Fig. 1). Four ENT1+/+ mice were injected with 15 mg of NBMPR-P per kilogram at 1 h before imaging to determine whether pharmacologic inhibition of ENT1 affected 18F-FLT biodistribution in wild-type mice (Fig. 1).

18F-FLT PET maximum-intensity-projection images of noninjected ENT1+/+ mice, ENT1+/+ mice injected with 15 mg of NBMPR-P per kilogram at 1 h before imaging, and ENT1−/− mice. Images were summations of radioactivity over 10 min from approximately 50 to approximately 60 min after radiotracer injection. Max = maximum.
When comparing 18F-FLT biodistribution in ENT1−/− and ENT1+/+ mice at 1 h after 18F-FLT injection, ENT1−/− mice displayed significant (P < 0.05; 19%–36%) decreases in percentage injected dose per gram (%ID/g) in the blood, heart, kidney, liver, lungs, and brain (Table 1). Conversely, ENT1−/− mice displayed significant (P < 0.05; 2.8- to 4.6-fold) increases in 18F-FLT uptake (%ID/g) in bone, bone marrow, and spleen that were visible on the PET images (Fig. 1). When 18F-FLT uptake was normalized to blood levels (%ID/g [tissue]/%ID/g [blood]), only the bone, bone marrow, and spleen in ENT1−/− mice displayed significant (P < 0.05) differences (3.1- to 5.9-fold increases) in 18F-FLT uptake.
18F-FLT Biodistribution in Mice with Various ENT1 Activities 1 Hour After 18F-FLT Injection
Similar to ENT1−/− mice, at 1 h before imaging ENT1+/+ mice injected with NBMPR-P, compared with untreated ENT1+/+ mice, displayed significant (P < 0.05; 16%–30%) decreases in 18F-FLT uptake (%ID/g) for the blood, brain, and liver and significant (P < 0.05; 1.5- to 2.7-fold) increases in 18F-FLT uptake (%ID/g) for bone, bone marrow, and spleen (Table 1). The data suggest that the inhibition of ENT1 by NBMPR-P altered 18F-FLT biodistribution in a similar manner in both ENT1+/+ and ENT1−/− mice. ENT1+/− mice were several months older and were slightly larger than the other mice, causing the ENT1+/− mice to have reduced %ID/g 18F-FLT uptake. To compensate for the larger size of the ENT1+/− mice, 18F-FLT uptake values for all mice were normalized using (%ID/g [tissue])/(%ID/g [blood]) values. Compared with ENT1+/+ mice, ENT1+/− mice displayed significant (P < 0.05; 1.1- to 1.3-fold) increases in normalized 18F-FLT uptake for colon and bone (Table 1). In general, reducing ENT1 activity significantly affected 18F-FLT biodistribution in various tissues, and the ENT1−/− mice, compared with ENT1+/+ mice, displayed the largest changes in 18F-FLT biodistribution.
TK1 Immunoblots of Mouse Spleens
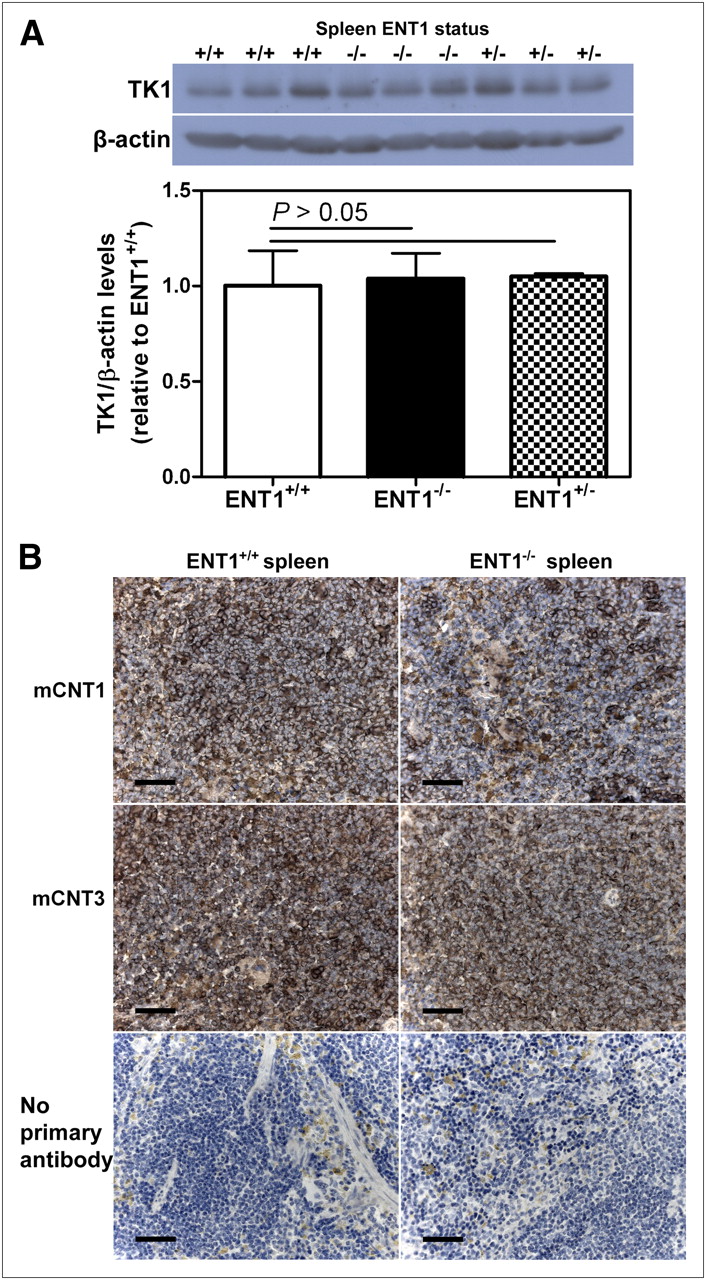
Spleen tissues from ENT1+/+, ENT1−/−, and ENT1+/− mice were excised and analyzed for TK1 (and β-actin as a control) by immunoblotting to determine whether there were differences in spleen TK1 protein levels between groups of mice. Although spleen TK1 levels varied for each mouse, no significant differences were observed when comparing standardized TK1 levels (TK1/β-actin band intensities) from ENT1+/+, ENT1−/−, and ENT1+/− mice (P > 0.05, Fig. 2A).

Characterization of TK1 and mCNT levels in ENT1-altered mice. (A) Immunoblot of TK1 and β-actin in spleens of ENT1+/+, ENT1−/−, and ENT1+/− mice. Bars represent mean ± SEM from 3 different mice in each group. (B) ENT1+/+ and ENT1−/− mice were euthanized and spleens were excised and characterized for mCNT1 and mCNT3 levels using immunohistochemistry. Scale bars represent 50-μm lengths.
NT Immunohistochemistry of Mouse Spleens
Spleen tissues from ENT1+/+ and ENT1−/− mice were excised and analyzed using immunohistochemistry to determine whether mCNTs were present. mCNT1 and mCNT3 were both observed, and mCNT1 and mCNT3 staining was slightly stronger in ENT1+/+ mice (Fig. 2B).
Thymidine Levels in Mouse Plasma
To determine whether there were differences in plasma thymidine levels between ENT1+/+ and ENT1−/− mice that may have influenced 18F-FLT biodistribution, mice were euthanized and plasma samples were collected and analyzed for thymidine using LC-MS. ENT1−/− mice displayed significantly greater plasma thymidine levels (1.65-fold, P < 0.005) than ENT1+/+ mice (Fig. 3).
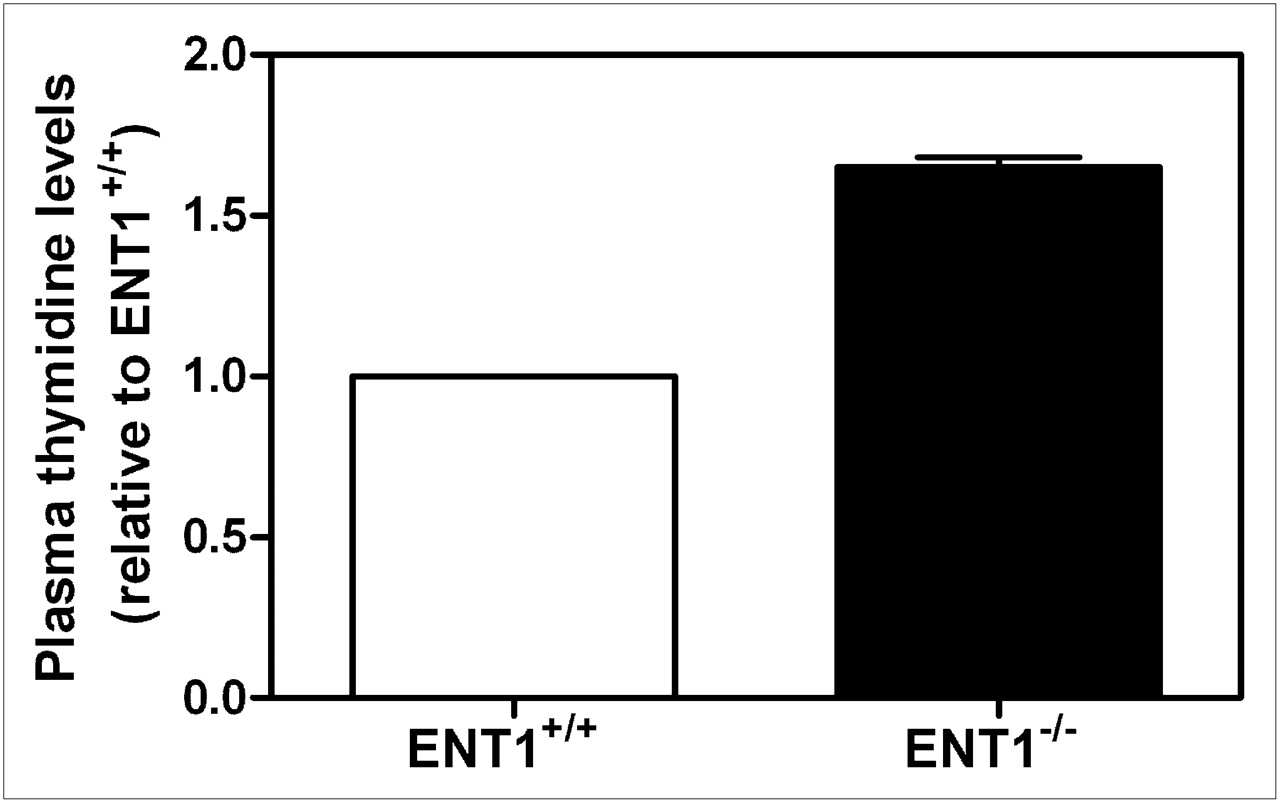
LC-MS analysis of plasma thymidine levels in ENT1+/+ and ENT1−/− mice. Mean values ± SEM for plasma thymidine levels from 3 mice from each strain are shown.
In Vitro Characterization of Transfected A549 Cells
To determine how altered ENT1 levels affected 18F-FLT uptake in a tumor model, A549 cells were stably transfected with pSUPER-encoding shRNA, with a scrambled sequence (A549-pSUPER-SC), or shRNA targeted against hENT1 (A549-pSUPER-hENT1). The resulting A549-derived cell lines were analyzed for TK1 and hENT1 transcript levels using quantitative real-time RT-PCR (Fig. 4A). TK1 transcript expression was not significantly different between A549-pSUPER-SC and A549-pSUPER-hENT1 cells, whereas hENT1 transcript expression in A549-pSUPER-hENT1 cells was significantly lower (55% decrease, P < 0.0005) than that in A549-pSUPER-SC cells.
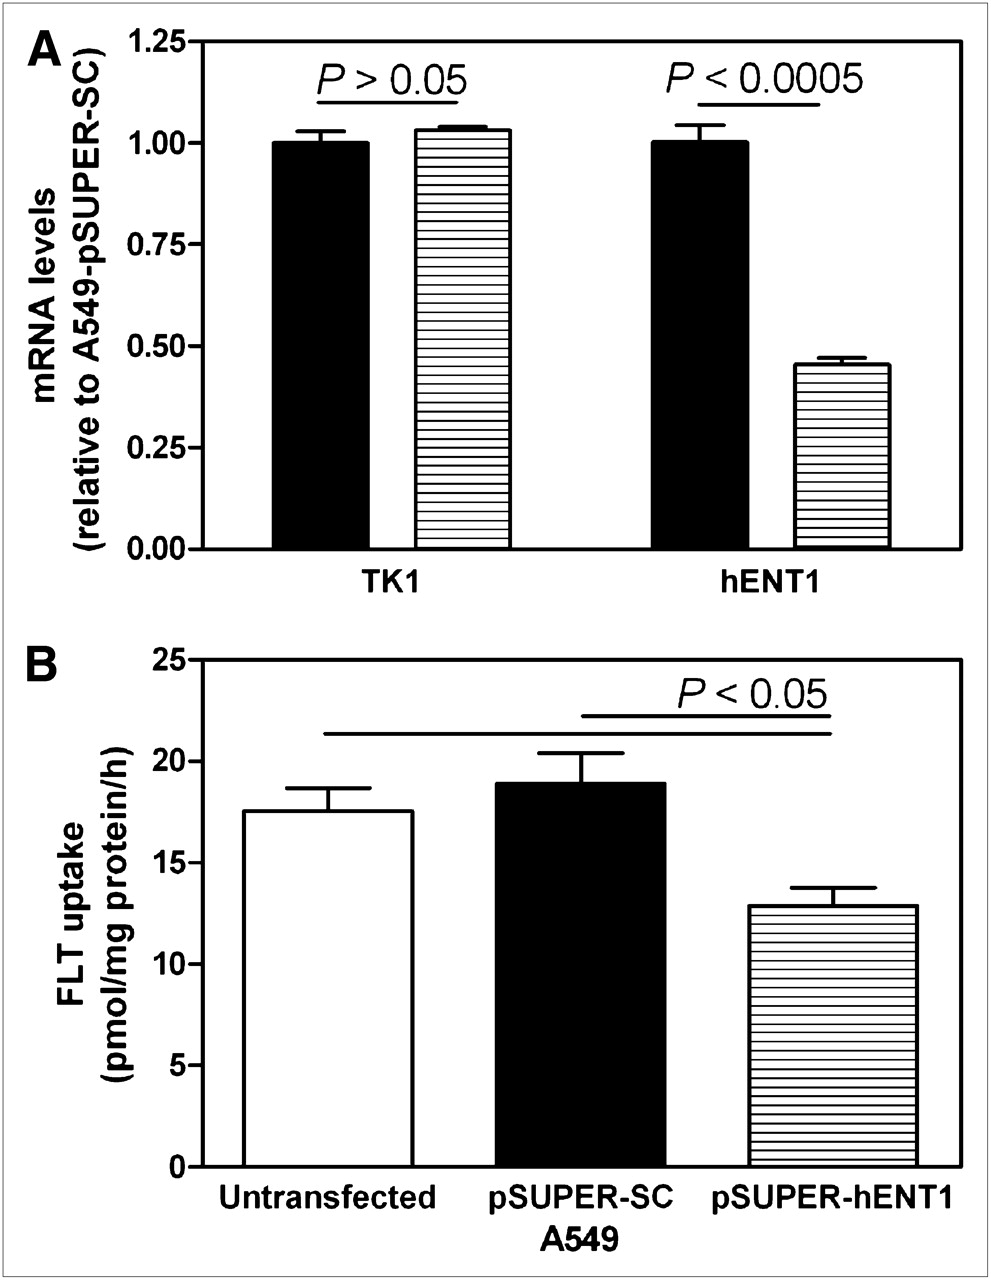
Characterization of cultured A549 (white bars), A549-pSUPER-SC (black bars), and A549-pSUPER-hENT1 (hatched bars) cells by quantification of TK1 and hENT1 transcript levels (A) and 3H-FLT uptake (B). Bars represent mean ± SEM from at least 3 different experiments (each performed in triplicate). mRNA = messenger RNA.
Cultured A549, A549-pSUPER-SC, and A549-pSUPER-hENT1 cells were compared for 3H-FLT uptake capacity. Untransfected A549 and A549-pSUPER-SC cells displayed similar levels of 3H-FLT uptake (P > 0.05), whereas A549-pSUPER-hENT1 cells displayed significantly lower 3H-FLT uptake than A549-pSUPER-SC cells (0.68-fold, P < 0.05, Fig. 4B).
In Vivo Characterization of Transfected A549 Cells
To determine whether reduced hENT1 levels in tumors led to reduced 18F-FLT uptake, A549-pSUPER-SC and A549-pSUPER-hENT1 xenograft tumors were compared for 18F-FLT uptake using small-animal PET. Figure 5A provides a representative summarized maximum-intensity-projection 18F-FLT PET image of a single mouse 60 min after injection, with significantly greater 18F-FLT uptake in the A549-pSUPER-SC tumor than in the A549-pSUPER-hENT1 tumor. Average tumor 18F-FLT standardized uptake values from 5 different mice were plotted over time to generate time–activity curves. The average 18F-FLT maximum standardized uptake value was significantly larger for A549-pSUPER-SC tumors than for A549-pSUPER-hENT1 tumors (0.82 ± 0.15 and 0.53 ± 0.12, respectively; P < 0.01, Fig. 5B). Tumor 18F-FLT %ID/g values were determined by ex vivo γ-counting and produced similar results (4.9 ± 0.43 and 3.7 ± 0.26 for A549-pSUPER-SC and A549-pSUPER-hENT1 tumors, respectively; P < 0.05).

18F-FLT uptake in A549-pSUPER-hENT1 and A549-pSUPER-SC xenograft tumors. (A) 18F-FLT PET maximum-intensity-projection image of a NIH-III mouse bearing A549-pSUPER-SC and A549-pSUPER-hENT1 tumors near left and right thighs, respectively. Image is summation of radioactivity from 0 to 60 min after tracer injection. (B) Time–activity curves of tumor standardized uptake values from 5 different mice were generated from dynamic 18F-FLT PET images and plotted over time. Each symbol represents mean ± SEM. SUV = standardized uptake value.
Kinetic analyses of A549-pSUPER-SC and A549-pSUPER-hENT1 xenograft tumors were performed with data obtained from dynamic small-animal 18F-FLT PET experiments using a previously described 3-compartment model (13). Apparent K1, k2, k3, and k4 values—representing 18F-FLT transport from blood to tissue, 18F-FLT efflux from tissue to blood, 18F-FLT phosphorylation, and 18F-FLT dephosphorylation, respectively—are shown in Table 2. Compared with A549-pSUPER-SC tumors, A549-pSUPER-hENT1 tumors displayed 0.64-fold K1 values (P < 0.05). Surprisingly, A549-pSUPER-hENT1 tumors displayed significantly greater k3 values (1.5-fold, P < 0.05) than did A549-pSUPER-SC tumors. No significant differences in TK1 protein level were observed between A549-pSUPER-SC and A549-pSUPER-hENT1 tumors (Supplemental Fig. 2), suggesting that the k3 parameter in the described 3-compartment model may not have been completely dependent on TK1 activity and differences in 18F-FLT uptake between A549-pSUPER-SC and A549-pSUPER-hENT1 tumors were not caused by differences in TK1 activity.
Average 18F-FLT Apparent Kinetic Values from 5 A549-pSUPER-SC and 5 A549-pSUPER-hENT1 Tumors in NIH-III Mice Using 3-Compartment Model
DISCUSSION
18F-FLT is considered a PET proliferation tracer because phosphorylation of 18F-FLT by cell cycle–regulated TK1 traps 18F-FLT within cells and allows cellular 18F-FLT accumulation (1). However, 18F-FLT must cross plasma membranes before it may be phosphorylated by TK1, suggesting that permeation of 18F-FLT across plasma membranes is also an important step for cellular 18F-FLT accumulation. Previous studies with cultured cells have demonstrated that hNTs play an important role in 18F-FLT uptake (2,10). The current study demonstrated the importance of NTs, in particular ENT1, in 18F-FLT biodistribution and tumor uptake using in vivo models.
ENT1−/− mice, compared with ENT1+/+ mice, had slightly altered levels of CNT1 and CNT3 staining in the spleen (Fig. 2B), suggesting that differences in 18F-FLT biodistribution in the 2 strains of mice may have been caused by both the functional deletion of ENT1 and the altered expression of other NTs. To determine the role of ENT1 in the biodistribution of 18F-FLT, ENT1+/+ mice were injected with 15 mg of NBMPR-P per kilogram—which is rapidly metabolized to NBMPR, a potent inhibitor of ENT1 (12,18)—and then underwent 18F-FLT small-animal PET. Compared with ENT1+/+ mice, both ENT1−/− mice and NBMPR-P–treated ENT1+/+ mice displayed decreased circulating 18F-FLT levels and increased 18F-FLT uptake in the spleen and bone marrow at 1 h after radiotracer injection (Table 1; Fig. 1).
The 18F-FLT biodistribution in ENT1−/− mice was similar to that in rats injected with thymidine phosphorylase—which displayed increased 18F-FLT accumulation in the bone marrow and spleen (19)—suggesting that ENT1−/− mice, compared with ENT1+/+ mice, may have had decreased circulating thymidine levels. However, LC-MS analysis of plasma thymidine levels showed that ENT1−/− mice, compared with ENT1+/+ mice, displayed a 1.65-fold increase in plasma thymidine level (Fig. 3). The increased plasma thymidine levels in ENT1−/− mice (∼1,250 ng/mL or 5 μM thymidine) may have decreased the amount of unoccupied NTs and TK1 available for interacting with 18F-FLT, potentially explaining the reduced levels of 18F-FLT uptake in various tissues.
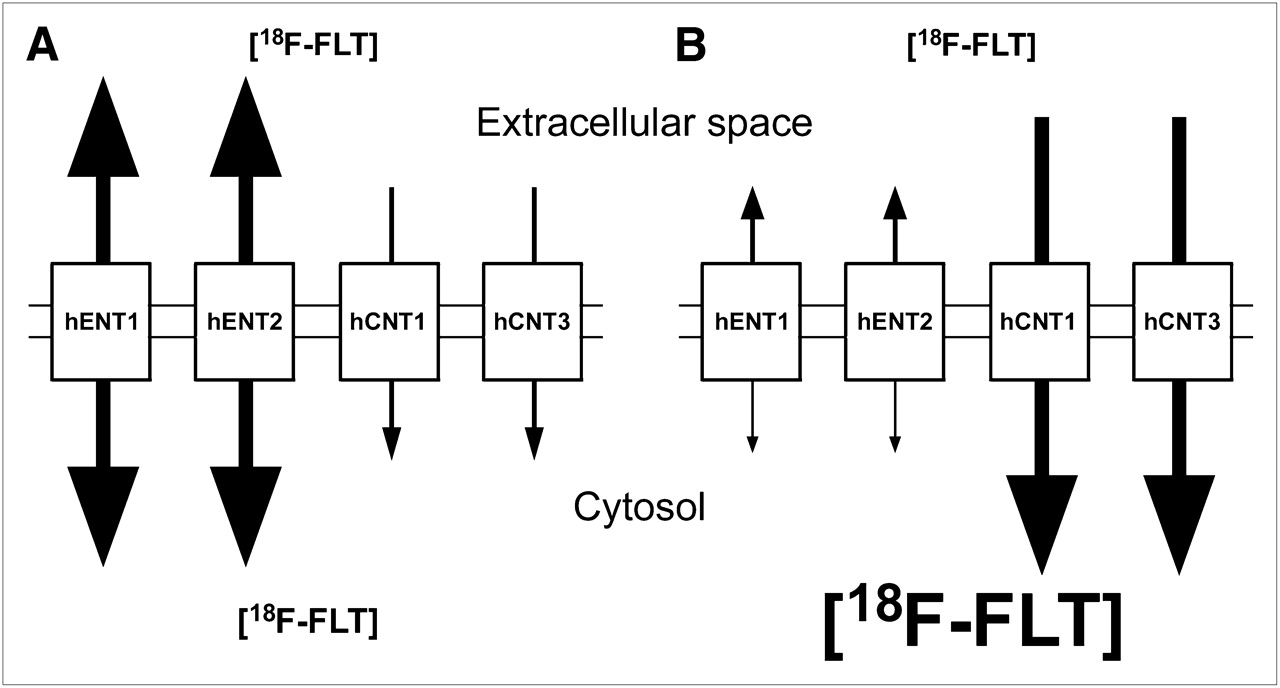
Previous studies with cultured cells have demonstrated that the inhibition of ENT1 decreased 3H-FLT uptake (2,10), which was the opposite of what was demonstrated in the spleen and bone marrow tissues of ENT1−/− mice when compared with ENT1+/+ mice. Because no difference in spleen TK1 protein levels was evident between the 2 strains of mice (Fig. 2A) and circulating thymidine levels were higher in ENT1−/− than in ENT1+/+ mice (Fig. 3), the data suggest that the increased 18F-FLT accumulation in these tissues was caused by increased CNT-to-ENT transport ratios. CNTs can only transport 18F-FLT into cells, whereas ENTs can transport 18F-FLT both into and out of cells. If 18F-FLT influx mediated by CNTs was greater than 18F-FLT efflux mediated by ENTs, 18F-FLT could accumulate within cells without 18F-FLT phosphorylation by TK1 (Fig. 6). Although many cultured cell lines have significantly greater levels of ENTs than CNTs (2,10), cultured human renal cells (hRPTC1) displayed significant amounts of CNT-dependent uridine uptake and approximately 1.4-fold increased uridine uptake when incubated with dilazep (hENT1 and hENT2 inhibitor), suggesting that inhibition of ENTs may increase nucleoside uptake if significant levels of CNTs are present (20). Mouse spleens displayed significant levels of CNTs (Fig. 2), which supports this hypothesis. Furthermore, human bone marrow has high hCNT3 transcript expression (21), suggesting that focal uptake of 18F-FLT in human bone marrow may be primarily caused by relatively high hCNT transport activity.

Models of 18F-FLT uptake mediated by hNTs in absence of TK1. (A) Cells with large hENT-to-hCNT transport activity ratios allow equilibration of 18F-FLT across plasma membranes, with relatively little intracellular 18F-FLT accumulation. (B) Cells with large hCNT-to-hENT transport activity ratios allow concentration of 18F-FLT inside cells.
Cultured A549-pSUPER-hENT1 cells, compared with A549-pSUPER-SC cells, displayed 0.45-fold hENT1 transcript levels and 0.68-fold 3H-FLT uptake (Figs. 4A and 4B). Cultured A549 cells express low levels of hCNT1 and hCNT3 transcripts, compared with those of hENT1 and hENT2, potentially explaining why reducing ENT1 activity caused a decrease in 3H-FLT uptake (2).
Although many clinical trials have shown correlations between 18F-FLT uptake and proliferation markers in tumors (22–24), other studies have not been able to reproduce such correlations (6–8). Differences in tumor hNT levels may explain such discrepancies because hNT transcript and protein levels differ significantly among tumors for many cancer types, with some tumors displaying no detectable hENT1 protein (25–27). Additionally, some therapeutic agents inhibit hENT1 or hENT2 activities, including dipyridamole (28,29) and various protein kinase inhibitors (30). The use of such agents before 18F-FLT PET may alter 18F-FLT biodistribution or affect tumor uptake of 18F-FLT, suggesting that patients’ therapy regimens should be known before analyses of 18F-FLT PET scans.
Nuclear medicine and PET technologies have increasingly been described as having the potential to serve as imaging biomarkers in predicting and assaying treatment response and characterizing the most appropriate treatment plans. The data presented in this paper demonstrate the importance of understanding the fundamental molecular biologic processes that underpin many of the new PET-labeled radiopharmaceuticals that are currently being tested in animal, preclinical, and phase 1 clinical studies.
CONCLUSION
ENT1−/− mice, when compared with ENT1+/+ mice, have significantly altered 18F-FLT biodistribution, with decreased circulating 18F-FLT levels and increased 18F-FLT uptake in the spleen and bone marrow, at 1 h after tracer injection. hENT1-knockdown A549 xenograft tumors displayed significantly lower 18F-FLT accumulation than did control A549 xenograft tumors, indicating that ENT1 is an important mediator of 18F-FLT uptake in the tested tumor model. The data also indicated that inhibition of ENT1 activity in cells could decrease (e.g., for cells with high ENT/CNT transport activity) or increase (e.g., for cells with high CNT/ENT transport activity) 18F-FLT uptake, depending on the presence and levels of other NTs in cells.
Acknowledgments
We thank Dan McGinn and Gail Hipperson for their expertise with handling the animals, Lorelei Johnson for performing immunohistochemistry work, Piyush Kumar and John Wilson for assistance with obtaining 18F-FLT for experiments, and Terence Riauka for assistance using the small-animal PET scanner. This work was supported by grants from the Alberta Cancer Research Institute (ACB-RIP 23114), Canadian Cancer Society Research Institute (CCSR1 16232), and Canadian Institutes of Health Research (CIHR MOP 12394) and a graduate studentship award from the Alberta Heritage Foundation for Medical Research (AHFMR). James Young is an AHFMR Scientist.
- © 2010 by Society of Nuclear Medicine
REFERENCES
- Received for publication February 16, 2010.
- Accepted for publication June 14, 2010.


Jump to section
Related Articles
Cited By...
- Antiretroviral Penetration and Drug Transporter Concentrations in the Spleens of Three Preclinical Animal Models and Humans
- Variability of Proliferation and Diffusion in Different Lung Cancer Models as Measured by 3'-Deoxy-3'-18F-Fluorothymidine PET and Diffusion-Weighted MR Imaging
- Role of the Transporter Regulator Protein (RS1) in the Modulation of Concentrative Nucleoside Transporters (CNTs) in Epithelia
- [18F]FLT-PET Imaging Does Not Always "Light Up" Proliferating Tumor Cells
- [18F]-3'Deoxy-3'-Fluorothymidine Positron Emission Tomography and Breast Cancer Response to Docetaxel
- Tumor 3'-Deoxy-3'-18F-Fluorothymidine (18F-FLT) Uptake by PET Correlates with Thymidine Kinase 1 Expression: Static and Kinetic Analysis of 18F-FLT PET Studies in Lung Tumors
- Cardiac PET: A Versatile, Quantitative Measurement Tool for Heart Failure Management