


Abstract
18F-FDG PET has gained acceptance for staging of esophageal cancer. However, FDG is not tumor specific and false-positive results may occur by accumulation of FDG in benign tissue. The tracer 18F-fluoro-3′-deoxy-3′-l-fluorothymidine (18F-FLT) might not have these drawbacks. The aim of this study was to investigate the feasibility of 18F-FLT PET for the detection and staging of esophageal cancer and to compare 18F-FLT PET with 18F-FDG PET. Furthermore, the correlation between 18F-FLT and 18F-FDG uptake and proliferation of the tumor was investigated. Methods: Ten patients with biopsy-proven cancer of the esophagus or gastroesophageal junction were staged with CT, endoscopic ultrasonography, and ultrasound of the neck. In addition, all patients underwent a whole-body 18F-FLT PET and 18F-FDG PET. Standardized uptake values were compared with proliferation expressed by Ki-67 positivity. Results: 18F-FDG PET was able to detect all esophageal cancers, whereas 18F-FLT PET visualized the tumor in 8 of 10 patients. Both 18F-FDG PET and 18F-FLT PET detected lymph node metastases in 2 of 8 patients. 18F-FDG PET detected 1 cervical lymph node that was missed on 18F-FLT PET, whereas 18F-FDG PET showed uptake in benign lesions in 2 patients. The uptake of 18F-FDG (median standardized uptake value [SUVmean], 6.0) was significantly higher than 18F-FLT (median SUVmean, 3.4). Neither 18F-FDG maximum SUV (SUVmax) nor 18F-FLT SUVmax correlated with Ki-67 expression in the linear regression analysis. Conclusion: In this study, uptake of 18F-FDG in esophageal cancer is significantly higher compared with 18F-FLT uptake. 18F-FLT scans show more false-negative findings and fewer false-positive findings than do 18F-FDG scans. Uptake of 18F-FDG or 18F-FLT did not correlate with proliferation.
Most patients with esophageal cancer are treated in specialized institutes and staged by endoscopic ultrasonography (EUS), CT of the chest and abdomen, and ultrasound examination (US) of the cervical region (1). However, these traditional methods for staging esophageal cancer have limited sensitivity and specificity. The presence of distant metastases before surgery, which is not detected by conventional imaging techniques, is relatively high, as indicated by detection of metastases during surgery in approximately 25% of the patients (2).
PET using 18F-FDG is a noninvasive metabolic imaging technique and its usefulness has been established for several malignancies (3). 18F-FDG is the most widely used tracer for staging tumors with PET (3). FDG is a glucose analog that enters the cells via the same membrane transporters as glucose. Glucose as well as 18F-FDG are phosphorylated by the enzyme hexokinase. In contrast to glucose-6-phosphate, 18F-FDG-6-phosphate is not a substrate for further metabolism in the glycolytic pathway. Therefore, 18F-FDG-6-phosphate is trapped in the cells in proportion to their glycolytic activity (3,4).
There is evidence for improved preoperative staging of esophageal cancer with 18F-FDG PET. Sensitivities of 67%–74% have been reported, especially with regard to the detection of nonregional lymphatic or hematogenic disease (5,6). Although these results may indicate an important role for 18F-FDG PET, FDG is not a tumor-specific tracer and false-positive results may occur (7,8). For example, macrophages and neutrophils can demonstrate increased 18F-FDG uptake, which can lead to false-positive results (9,10).
18F-Fluoro-3′-deoxy-3′-l-fluorothymidine (18F-FLT) was introduced as a PET proliferation tracer by Shields et al., which might not have these drawbacks (11,12). 18F-FLT is monophosphorylated by thymidine kinase 1 (TK1), which leads to intracellular trapping. Since the TK1 concentration is especially increased during the S phase of the cell cycle, the uptake of 18F-FLT is believed to depend on proliferation (12).
The aim of this study was to investigate the feasibility of 18F-FLT PET for the detection and staging of esophageal cancer compared with 18F-FDG PET. Furthermore, the correlation between uptake of 18F-FLT or 18F-FDG and proliferation of the tumor was investigated.
MATERIALS AND METHODS
Patients
This prospective study consisted of 10 patients with biopsy-proven malignancy of the esophagus or gastroesophageal junction. All patients were staged with multidetector CT (Somatom Sensation; Siemens Medical Systems) of the chest and abdomen, EUS (GF-UM20, 7.5–12 MHz; Olympus), and US of the cervical region. Patients were included from November 2003 until February 2004.
All patients gave written informed consent. Only patients with liver and kidney functions and hematologic parameters (hemoglobin, hematocrit, erythrocytes, thrombocytes, leukocytes, and white cell count) within normal limits were included because of the toxicity of FLT in high concentrations. The Medical Ethics Committee of Groningen University Hospital approved the study protocol.
FDG and FLT Synthesis
FDG was produced according to the method described by Hamacher et al. using the coincidence 18F-FDG synthesis module (13). Synthesis of 18F-FLT was performed according to the method of Machulla et al. (14). 18F-FLT was produced by 18F-fluorination of the 4,4′-dimethoxytrityl–protected anhydrothymidine, followed by a deprotection step. After purification by reversed-phase high-performance liquid chromatography, the product was made isotonic and passed through a 0.22-μm filter. 18F-FLT was produced with a radiochemical purity of >95% and a specific activity of >10 TBq/mmol. The radiochemical yield was 6.7% ± 3.7% (decay corrected).
PET
PET studies were performed using an ECAT EXACT HR+ scanner (Siemens/CTI, Inc.). Before PET, patients were instructed to fast for at least 6 h to keep both study protocols comparable. Patients were also instructed to drink 500 mL of water before imaging to stimulate 18F-FDG and 18F-FLT excretion from the renal calyces and to stimulate subsequent voiding.
Data acquisition started 90 and 60 min after injection of 18F-FDG and 18F-FLT, respectively. Scans were performed in whole-body mode, for 5 min per bed position from femur to the crown. Transmission imaging was obtained for 3 min per bed position for attenuation correction. Images were reconstructed using an iterative reconstruction technique and were read from computer monitors (15).
Pathologic Evaluation
Tissue was fixed in 4% buffered formalin, routinely processed, and embedded in paraffin. Subsequently, 4-μm sections were cut. For morphology, slides were routinely stained with hematoxylin and eosin. Proliferating cells were detected using the monoclonal antibody MIB-1, which recognizes an epitope of the Ki-67 nuclear antigen that is present during DNA synthesis (16). For this immunohistochemistry, slides were pretreated for 30 min in Tris buffer (pH 9.5) at 98°C. Staining was performed using the automated immunohistochemistry slide-staining system NexES (Ventana Medical Systems Inc.). As the first step, monoclonal antibody MIB-1 (DakoCytomation BV) detection of the cell proliferation marker Ki-67 was applied. As the second step, a basic 3,3′-diaminobenzidine detection system was used (Ventana Medical Systems Inc.). All reagents and equipment were used according to the instructions of the suppliers.
The MIB-1 score was estimated by counting the percentage of MIB-1–positive cell nuclei per 1,000 tumor cells in the region of the tumor with the greatest density of staining, which, in most instances, corresponds to areas with the highest mitotic activity. The pathologist was unaware of the results of the PET images.
Data Analysis
Patients were staged according to the tumor, node, metastasis (TNM) staging system of the International Union Against Cancer on the basis of CT, EUS, and US (17). The gold standard for the presence or absence of metastases was either histopathologic examination or follow-up. If this information was not available, other staging modalities were used as a reference. Both 18F-FDG PET and 18F-FLT PET scans were interpreted independently by experienced nuclear physicians who were unaware of clinical data and information from the other PET scan.
Three-dimensional regions of interest (ROIs) were placed semiautomatically using a dedicated software program over the primary tumor on multiple slices, with a threshold of 70% of the maximum pixel value within the tumor. The maximum standardized uptake value (SUVmax) and the mean SUV (SUVmean) were calculated according to the equation:
 where Ci is the activity concentration, A is the injected radioactivity, and M is the body mass. SUVmax denotes the maximum SUV value within the tumor ROI, and SUVmean denotes the mean value averaged over all voxels.
Statistical Analysis
The results of the visually interpreted PET images were compared with the histologic data or dedicated radiographic imaging, which were used as the standard. 18F-FDG and 18F-FLT uptake was compared using the Wilcoxon signed rank test. The amount of Ki-67–positive cells and SUVs for 18F-FDG and 18F-FLT were compared using linear regression analysis. Two-tailed P values < 0.05 were considered significant.
RESULTS
Patients
Ten patients were included (median age, 61 y; range, 48–75 y). Patient characteristics are summarized in Table 1. Patients received 18F-FDG with a median dose of 368 MBq (250–750 MBq) and received 18F-FLT with a median dose of 410 MBq (340–450 MBq). Eight patients underwent esophagectomy and 2 patients received an expendable metal stent because of an irresectable T4 tumor on preoperative staging in patient 5 and an irresectable tumor encountered during surgical exploration in patient 7.
Patient Characteristics and Staging Results
Detection of Esophageal Cancer
18F-FDG PET visualized all primary tumors, whereas 18F-FLT visualized 8 of 10 esophageal cancers (Table 1). In patients 4 and 10, no uptake of 18F-FLT was observed. Therefore, the SUV could not be calculated for 18F-FLT in these 2 patients.
Staging of Esophageal Cancer with 18F-FDG PET and 18F-FLT PET
Pathology for assessment of lymph nodes was available in 9 patients. 18F-FDG PET and 18F-FLT PET were comparable with regard to the detection of regional lymph nodes. Both 18F-FDG PET and 18F-FLT PET correctly detected regional lymph node metastases in only 2 of 8 patients.
18F-FDG PET showed false-positive uptake in the celiac trunk region in patient 4, whereas all other staging modalities, including 18F-FLT PET, did not show any abnormality. Pathologic examination revealed cellular reactivity in the celiac trunk lymph nodes in this patient, and the uptake on 18F-FDG PET was scored as a false-positive result. In patient 5, 18F-FDG PET and CT showed a cervical lymph node metastasis. 18F-FLT PET did not detect this metastasis and this was scored as a false-negative result.
Comparison Between 18F-FDG and 18F-FLT Uptake
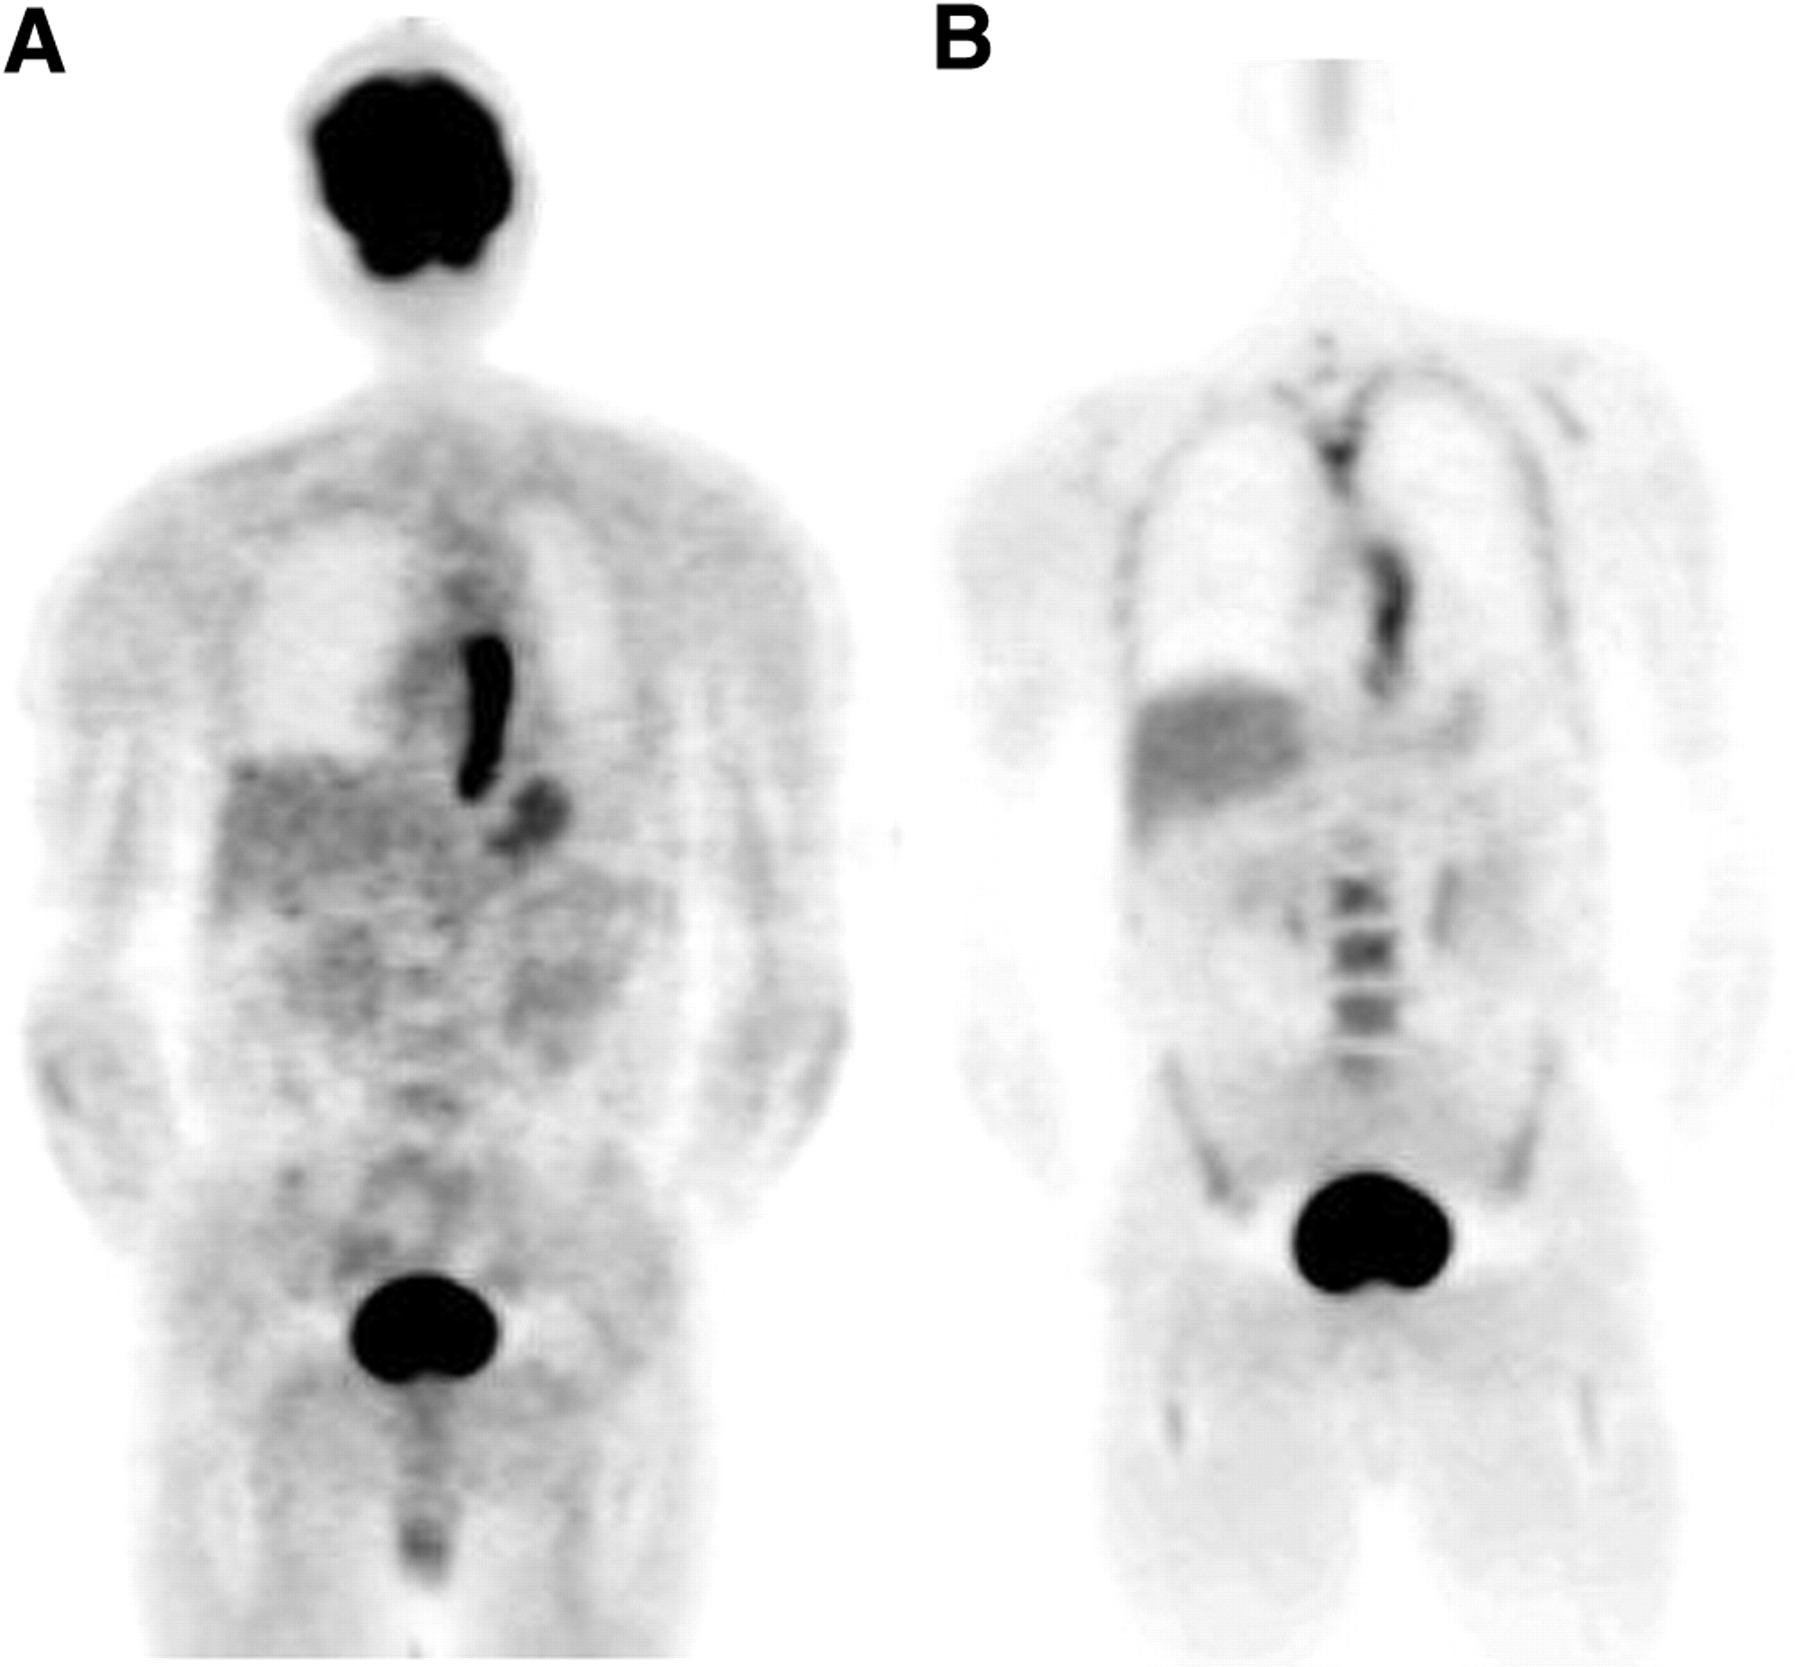
The median SUVmax and median SUVmean for 18F-FDG were 7.4 and 6.0 and for 18F-FLT were 4.1 and 3.4. Uptake of 18F-FDG was significantly higher than 18F-FLT, whether expressed in SUVmax (P = 0.012) or SUVmean (P = 0.012). Figure 1 shows 18F-FDG PET and 18F-FLT PET of patient 2.

18F-FDG PET (A) and 18F-FLT PET (B) of patient 2 with long esophageal tumor.
Correlation of 18F-FDG and 18F-FLT Uptake with MIB-1 Score
All tissue specimens contained immunoreactivity to Ki-67 antigen. Ki-67 positivity ranged from 57% to 85%, with a median of 73% (Table 1). Linear regression analysis indicated no correlation between 18F-FDG SUV and Ki-67 or between 18F-FLT SUV and Ki-76 (18F-FDG SUVmax vs. Ki-67, r = 0.14; 18F-FLT SUVmax vs. Ki-76, r = −0.76; 18F-FDG SUVmean vs. Ki-67, r = 0.13; 18F-FLT SUVmean vs. Ki-76, r = −0.74).
Additional Findings
In patient 6, 18F-FDG PET showed uptake in the rectosigmoid. However, 18F-FLT PET did not show any abnormality in this region. Additional sigmoidoscopy revealed diverticulitis. In patient 10, a hypermetabolic lesion in the ascending colon was found on 18F-FDG PET and proven to be a carcinoma by colonoscopy. However, 18F-FLT PET did not detect this synchronous neoplasia.
DISCUSSION
This pilot study was conducted on 10 patients and showed that 18F-FDG PET could detect all esophageal cancers, whereas 18F-FLT PET visualized the tumor in 8 patients. Both 18F-FDG PET and 18F-FLT PET detected lymph node metastases in 2 of 8 patients. The uptake of 18F-FDG (median SUVmean, 6.0; range, 3.6–11.5) in esophageal cancer was significantly higher than that of 18F-FLT (median SUVmean, 3.4; range, 2.3–4.3). Furthermore, neither 18F-FDG uptake nor 18F-FLT uptake reflects proliferation as determined by Ki-67 immunostaining.
18F-FDG PET was able to detect all primary esophageal cancers, whereas 18F-FLT PET missed 2 of them. This fact may be related to the lower uptake of 18F-FLT compared with 18F-FDG, which has been reported earlier for several other tumors (18–21). The 18F-FLT phosphorylation rate in vitro is known to be about 30% of the phosphorylation rate of serum thymidine by TK1, which could explain the low 18F-FLT uptake in the tumor (22,23). Although plasma levels are low, thymidine may compete with 18F-FLT for the active site of nucleoside carriers in cell membranes and also for the active site of the trapping enzyme TK1. Moreover, the affinity of human TK1 for thymidine has been reported to be 4-fold higher than the affinity for 18F-FLT (22,24).
Both 18F-FDG PET and 18F-FLT PET had low sensitivity for the detection of regional lymph node metastases (2 of 8 patients). Several studies have reported the moderate sensitivity of 18F-FDG PET for detection of regional lymph node metastases, which ranges from 8% to 67% (25–27). 18F-FLT PET did not improve the regional staging of esophageal cancer. This can be explained by low tissue uptake of 18F-FLT (as described) or by the detection limit of PET for small tumor deposits (28).
A strong correlation between 18F-FLT uptake and proliferation expressed as Ki-67–positive cells was found for lung cancer and sarcoma (18,29). However, we did not find a correlation between 18F-FLT uptake and Ki-67 or between 18F-FDG uptake and Ki-67. A correlation between 18F-FLT uptake and proliferation was not reported for breast cancer or thoracic tumors (18,21,30). The rationale of 18F-FLT uptake in malignant tissue is based on TK1 dependence of proliferation (12,18). However, tumors vary in the relative contribution of de novo and salvage nucleotide biosynthesis. Dominance of de novo pathways, although uncommon, would mask proliferation-dependent increases in TK1 activity (31). Furthermore, in cells for which proliferation is less dependent on TK1, the correlation between tracer uptake and TK1 activity was poor (18,31). We did not obtain full kinetic parameters of 18F-FLT, which might be explain why a correlation between 18F-FLT and proliferation was not found. For example, the correlation between the rate of phosphorylation of 18F-FLT and SUV should be investigated to assess proliferation (32). In addition, Ki-67 is not a perfect measure of DNA synthesis, since it just measures the number of cells in a proliferating state (16). Moreover, Ki-67 was assessed in a proliferating part of the tumor and was compared with the SUV value of a tumor volume. This comparison might be flawed.
Its small sample size and the absence of evaluation after therapy limit drawing solid conclusions from this study. 18F-FDG PET is able to identify nonresponders early during neoadjuvant chemoradiotherapy for esophageal cancer (33). Therefore, it will be worthwhile to investigate the ability of 18F-FLT PET in identifying nonresponders to neoadjuvant treatment regimens.
At present, 18F-FDG is the tracer of choice for the staging of esophageal cancer. Despite the lower incidence of false-positive results with 18F-FLT, false-negative results will increase by using 18F-FLT, which is a major disadvantage for the staging of esophageal cancer.
CONCLUSION
In this feasibility study, 18F-FLT uptake in esophageal cancer is significantly lower compared with 18F-FDG uptake. 18F-FLT PET has more false-negative findings and fewer false-positive findings compared with 18F-FDG PET. In addition, 18F-FLT uptake and 18F-FDG uptake in esophageal cancer do not reflect proliferation in this population.
Acknowledgments
This study was supported by a ZonMw program for Health Care Efficiency Research and the Dutch Cancer Foundation.
Footnotes
Received Aug. 13, 2004; revision accepted Sep. 30, 2004.
For correspondence contact: John Th. Plukker, MD, PhD, Department of Surgical Oncology, University Medical Center, P.O. Box 30001, 9700 RB Groningen, The Netherlands.
E-mail: j.th.plukker{at}chir.azg.nl
REFERENCES
In this issue


Jump to section
Related Articles
Cited By...
- Sequence Dependence of MEK Inhibitor AZD6244 Combined with Gemcitabine for the Treatment of Biliary Cancer
- Usefulness of 3'-Deoxy-3'-18F-Fluorothymidine PET for Predicting Early Response to Chemoradiotherapy in Head and Neck Cancer
- Novel Positron Emission Tomography Tracer Distinguishes Normal from Cancerous Cells
- Imaging Colon Cancer Response Following Treatment with AZD1152: A Preclinical Analysis of [18F]Fluoro-2-deoxyglucose and 3'-deoxy-3'-[18F]Fluorothymidine Imaging
- Biodistribution and Uptake of 3'-Deoxy-3'-Fluorothymidine in ENT1-Knockout Mice and in an ENT1-Knockdown Tumor Model
- PET/CT with 18F-FLT: Does It Improve the Therapeutic Management of Metastatic Germ Cell Tumors?
- Monitoring Tumor Response to Therapy with 18F-FLT PET
- 18F-FDG PET and 18F-FDG PET/CT for Assessing Response to Therapy in Esophageal Cancer
- Imaging of Cell Proliferation: Status and Prospects
- Imaging Gastric Cancer with PET and the Radiotracers 18F-FLT and 18F-FDG: A Comparative Analysis
- 18F-FLT PET in Hematologic Disorders: A Novel Technique to Analyze the Bone Marrow Compartment
- Early Detection of Chemoradioresponse in Esophageal Carcinoma by 3'-Deoxy-3'-3H-Fluorothymidine Using Preclinical Tumor Models