


Abstract
The basis for the use of nucleoside tracers in PET is that activity of the cell-growth–dependent enzyme thymidine kinase 1 is the rate-limiting factor driving tracer retention in tumors. Recent publications suggest that nucleoside transporters might influence uptake and thereby affect the tracer signal in vivo. Understanding transport mechanisms for different nucleoside PET tracers is important for evaluating clinical results. This study examined the relative role of different nucleoside transport mechanisms in uptake and retention of [methyl-3H]-3′-deoxy-3′-fluorothymidine (3H-FLT), [methyl-3H]-thymidine (3H-thymidine), and 3H-1-(2-deoxy-2-fluoro-β-d-arabinofuranosyl)-5-methyluracil (3H-FMAU). Methods: Transport of 3H-FLT, 3H-thymidine, and 3H-FMAU was examined in a single human adenocarcinoma cell line, A549, under both nongrowth and exponential-growth conditions. Results: 3H-Thymidine transport was dominated by human equilibrative nucleoside transporter 1 (hENT1) under both growth conditions. 3H-FLT was also transported by hENT1, but passive diffusion dominated its transport. 3H-FMAU transport was dominated by human equilibrative nucleoside transporter 2. Cell membrane levels of hENT1 increased in cells under exponential growth, and this increase was associated with a more rapid rate of uptake for both 3H-thymidine and 3H-FLT. 3H-FMAU transport was not affected by changes in growth conditions. All 3 tracers concentrated in the plateau phase, nonproliferating cells at levels many-fold greater than their concentration in buffer, in part because of low levels of nucleoside metabolism, which inhibited tracer efflux. Conclusion: Transport mechanisms are not the same for 3H-thymidine, 3H-FLT, and 3H-FMAU. Levels of hENT1, an important transporter of 3H-FLT and 3H-thymidine, increase as proliferating cells enter the cell cycle.
PET provides a noninvasive approach to measuring tumor growth and response to therapy (1,2). Labeled thymidine and thymidine analogs such as [methyl-3H]-3′-deoxy-3′-fluorothymidine (3H-FLT) and 3H-1-(2-deoxy-2-fluoro-β-d-arabinofuranosyl)-5-methyluracil (3H-FMAU) are being studied for their use as PET-based proliferation tracers (3–7). The primary factor driving nucleoside uptake and retention in tumors is assumed to be thymidine kinase 1 (TK1) (a cytosolic enzyme). TK1 activity is selectively expressed or upregulated in proliferating cells (8). A role for nucleoside transporters in modifying 3H-FLT tracer signals has been suggested (9,10). The present study examined the relative importance of different modes of transport for 3H-FLT, [methyl-3H]-thymidine (3H-thymidine), and 3H-FMAU and the influence of proliferation on transport. Nucleoside transporters play an important role in regulating intracellular and extracellular concentrations of nucleosides (11,12). Concentrative transporters mediate influx only and are adenosine triphosphate– and either sodium (human concentrative nucleoside transport 1–3)- or proton (human concentrative nucleoside transport 3)-dependent (13–15). Equilibrative nucleoside transporters (ENT) are sodium-independent, and they transport nucleosides bidirectionally across a concentration gradient. In humans, there are 4 known ENTs; 2 of these, human equilibrative nucleoside transporter 1 (hENT1) and human equilibrative nucleoside transporter 2 (hENT2), have been well characterized (12,16,17). The hENT1 transporter is ubiquitously expressed, whereas the hENT2 transporter is expressed in a more limited set of tissues.
Kong et al. (18) reported that 3H-FLT uptake in the human tumor cell line HL-60 was dominated by the hENT1 transporter, with only a small component derived from simple diffusion, similar to 3H-thymidine transport. Structure–activity studies (19) suggest that the primary mechanism for 3H-FLT transport into cells should be passive diffusion. There is no information on 3H-FMAU transporter preference. There is also no information on whether transport mechanisms differ in proliferating and nonproliferating tumor cells. The results from the present study suggest different mechanisms of transport for 3H-thymidine, 3H-FLT, and 3H-FMAU and support a role for cell growth conditions in defining transport rates.
MATERIALS AND METHODS
Materials
3H-FLT (351.5 GBq/mmol), 3H-FMAU (111 GBq/mmol), 3H-thymidine (1.85 GBq/mmol), and 3H-S-(p-nitrobenzyl)-6-thioinosine (3H-NBMPR) (740 GBq/mmol) were purchased from Moravek Biochemicals. High-purity NBMPR, nitrobenzylthioguanosine ribonucleoside, dipyridamole, thymidine, thymidine monophosphate, thymidine diphosphate, thymidine triphosphate, and other reagents were purchased from Sigma-Aldrich. Cell culture medium and supplements were purchased from Invitrogen. Antibodies AB48607 (ENT1) and AB6741 (secondary antibody) were purchased from Abcam.
Cell Culture Conditions
The human lung adenocarcinoma cell line A549 was used for all studies. Cells culture conditions were as previously described (20).
Cell Cycle Determination
Parallel cultures of cells were incubated for 30 min in medium containing 20 μM 5-bromo-2′-deoxyuridine (BrdU) before being fixed in cold 70% ethanol. BrdU label was detected by fluorescein isothiocyanate–conjugated mouse anti-BrdU antibody. Cells were counterstained with propidium iodide and then analyzed on a Becton-Dickinson LSR2 cytometer using FACSDiva software (version 6.0). Events (20,000) were collected for each sample, and data were analyzed with FlowJo software (version 9.0; Tree Star Inc.).
Nucleoside Transport Studies
Influx measurements were performed in sodium-containing Ringer's solution buffered with N-(2-hydroxyethyl)piperazine-N′-(2-ethanesulfonic acid) (HEPES) containing 135 mM NaCl, 5 mM KCl, 3.33 mM NaH2PO4, 0.83 mM Na2HPO4, 1.0 mM CaCl2, 1.0 mM MgCl2, 10 mM d-glucose, and 5 mM HEPES, pH 7.4, or sodium-free Ringer's solution buffered with HEPES containing 140 mM N-methyl-d-glucamine, 5 mM KH2PO4, 1.0 mM CaCl2, 1.0 mM MgCl2, 10 mM d-glucose, and 5 mM HEPES, pH 7.4. Cells in 6- or 12-well plates were washed 3 times with buffer (with or without sodium) and equilibrated in buffer for 10 min at room temperature. The preincubation buffer was replaced with buffer containing a 74 kBq/mL concentration of (2 μCi/mL) of 3H-thymidine, 3H-FLT, or 3H-FMAU. Cells were incubated with 400 pmol of 3H-thymidine, 210 pmol of 3H-FLT, or 667 pmol of 3H-FMAU. After incubation for times ranging from 60 s to 120 min, tracer-containing buffer was rapidly aspirated and the plates rapidly washed 3 times with an excess of cold phosphate-buffered saline. Cells were incubated overnight in 5% Triton X-100 (Sigma-Aldrich) at room temperature, and radioactivity was measured in a Tri-Carb 1900 Liquid Scintillation Counter using Ultima Gold scintillation cocktail (Perkin Elmer). Cell numbers in each experiment were determined using a bicinchoninic acid assay (Pierce) to measure total protein in lysates made from representative plates. To measure efflux, cells were prelabeled with nucleoside tracer for 1 h, and then the buffer was removed and fresh buffer added. Samples of buffer were removed at different times for determination of activity lost from cells. Activity remaining in the cells was also measured.
Equilibrative transmembrane transport was studied in more detail using a range of concentrations of the specific hENT inhibitors dipyridamole, nitrobenzylthioguanosine ribonucleoside, and NBMPR (10,21,22). All experiments were performed in triplicate. Prism software (version 5.01; GraphPad Software) was used for curve modeling and determination of inhibitory concentration of 50% (IC50). Calculations of intracellular tracer concentration relative to tracer levels in buffer were determined as previously described (8).
High-Performance Liquid Chromatography (HPLC) Analysis of Tracer Metabolites
For metabolism studies, cells were exposed to 3H-labeled tracers for 60 s or 60 min and then washed with phosphate-buffered saline. After cells were washed, ice-cold 6% trichloroacetic acid was placed on plates. Cells were collected by scraping, stirred in a vortex mixer for 20 s, incubated on ice for 10 min, stirred in a vortex mixer again, and centrifuged at 14,000g for 10 min. The resulting supernatants were stored at −80°C for up to 2 wk and neutralized with saturated potassium bicarbonate before analysis. Samples were analyzed using a Hewlett-Packard HPLC system (HP1050) equipped with an in-line degasser (Alltech), a column oven (Brinkmann), a Lambda-Max 481 ultraviolet detector (Waters), and a Radiomatic 625TR flow scintillation analyzer (Perkin Elmer). A Waters Symmetry C18 3.5-μm (150 × 4.6 mm) column equipped with a NovaPak C18 guard column was used and maintained at 27°C for all assays. The mobile phase was delivered at 1.0 mL/min using the following gradient program: A–B, (100:0) at 0–4 min→ (60:40) at 15 min → (40:60) at 35–45 min. Buffer A consisted of 10 mM tetrabutylammonium hydroxide, 10 mM KH2PO4, and 0.25% methanol, pH 6.9. Buffer B consisted of 6 mM tetrabutylammonium hydroxide, 50 mM KH2PO4, and 50% methanol, pH 7.0. The sample injection volume was 50 μL, and ultraviolet absorbance was at 254 nm. A standard mixture containing thymidine, thymidine monophosphate, thymidine diphosphate, thymidine triphosphate, FLT, and FMAU was run before each assay to validate metabolite retention times. The flow scintillation analyzer was equipped with a 1,000-μL flow cell, and Ultima-Flo AP (Perkin Elmer) liquid scintillation cocktail was delivered at a rate of 3.0 mL/min. Chemstation software (Hewlett-Packard) was used to pilot the HPLC, and ProFSA Plus software (Perkin Elmer) was used to pilot the flow scintillation analyzer and for data analysis. The counting efficiency of the detector under these conditions was 60.3%.
hENT1 Detection
hENT1 content was assayed by Western blot in both whole-cell lysates and extracts prepared from crude membranes. Total protein in samples was determined by a bicinchoninic acid assay. Proteins were identified with rabbit anti-hENT1 polyclonal antibody, followed by horseradish peroxidase–conjugated goat antirabbit IgG polyclonal antibody. Horseradish peroxidase was detected by an enhanced chemiluminescence kit (Pierce). Densitometry measurements were performed on films using Quantity One software (version 4.0; Bio-Rad). Membrane-associated levels of hENT1 were also evaluated by measuring 3H-NBMPR binding as described by Wiley et al. (23).
RESULTS
Nucleoside Transport in Nonproliferating Cells
Plateau-phase cells were used to model nonproliferating tumor cells. In a previous publication (8), we reported that in plateau-phase cultures of A549 cells, as compared with proliferating cells, 90% or more of cells were in G1/G0 and TK1 activity levels were low.
The kinetics of tracer uptake over a 120-min period can generally be modeled by a hyperbolic parabola curve, with an initial phase of rapid uptake, followed by a flattening of the curve (Fig. 1A). The initial rate of 3H-thymidine uptake, measured during the first 10 min, was approximately 3-fold greater than that of either 3H-FLT or 3H-FMAU. The time to reach 50% of plateau levels was 7.6 ± 0.7 min for 3H-thymidine, 52.9 ± 10.3 min for 3H-FLT, and 13.9 ± 3.2 min for 3H-FMAU. By 120 min, 3H-thymidine and 3H-FLT levels were similar, whereas 3H-FMAU levels were 5-fold lower than 3H-thymidine and 3H-FLT.

Time-dependent nucleoside uptake in noncycling, plateau-phase cultures of A549 cells. (A) Intracellular levels of tracer (disintegrations per minute [dpm]/106 cells) in cells incubated in tracer-containing buffer. (B) Intracellular levels of tracer (percentage of activity in cell-equivalent volume of buffer) in cells incubated in tracer-containing buffer. (C) Intracellular levels of tracer (dpm/106 cells) in cells incubated in tracer-containing buffer with 10−4 M NBMPR. (D) Intracellular levels of tracer (percentage of activity in cell-equivalent volume of buffer) in cells incubated in tracer-containing buffer with 10−4 M NBMPR. Results are mean ± SD of at least 3 replicates. ○ = 3H-thymidine; ● = 3H-FLT; ▲ = 3H-FMAU; dotted line = relative activity in buffer.
To determine whether tracers concentrated within cells, tracer activity in cells was normalized to tracer activity in an equivalent volume of buffer (Fig. 1B). The 100% line represents the nucleoside tracer concentration in a cell-equivalent volume of buffer. After 2 h, 3H-FLT and 3H-thymidine concentrated to 15.8- and 17.5-fold of buffer levels, respectively. Intracellular 3H-FMAU levels after 2 h were 4.6-fold greater than buffer concentration.
Role of ENTs
The role of ENTs was studied by measuring nucleoside uptake in the presence of 10−4 M NBMPR, an ENT-specific inhibitor. NBMPR reduced 3H-thymidine uptake by more than 90%, 3H-FMAU uptake by more than 78%, and 3H-FLT uptake by 53% (Fig. 1C). The effect of NBMPR-mediated inhibition of uptake on tracer concentration was also examined (Fig. 1D). Neither 3H-thymidine nor 3H-FMAU reached an intracellular level greater than that found in equivalent volumes of buffer. In contrast, there was a 4.8-fold increase in intracellular 3H-FLT concentration relative to buffer levels after a 60-min incubation.
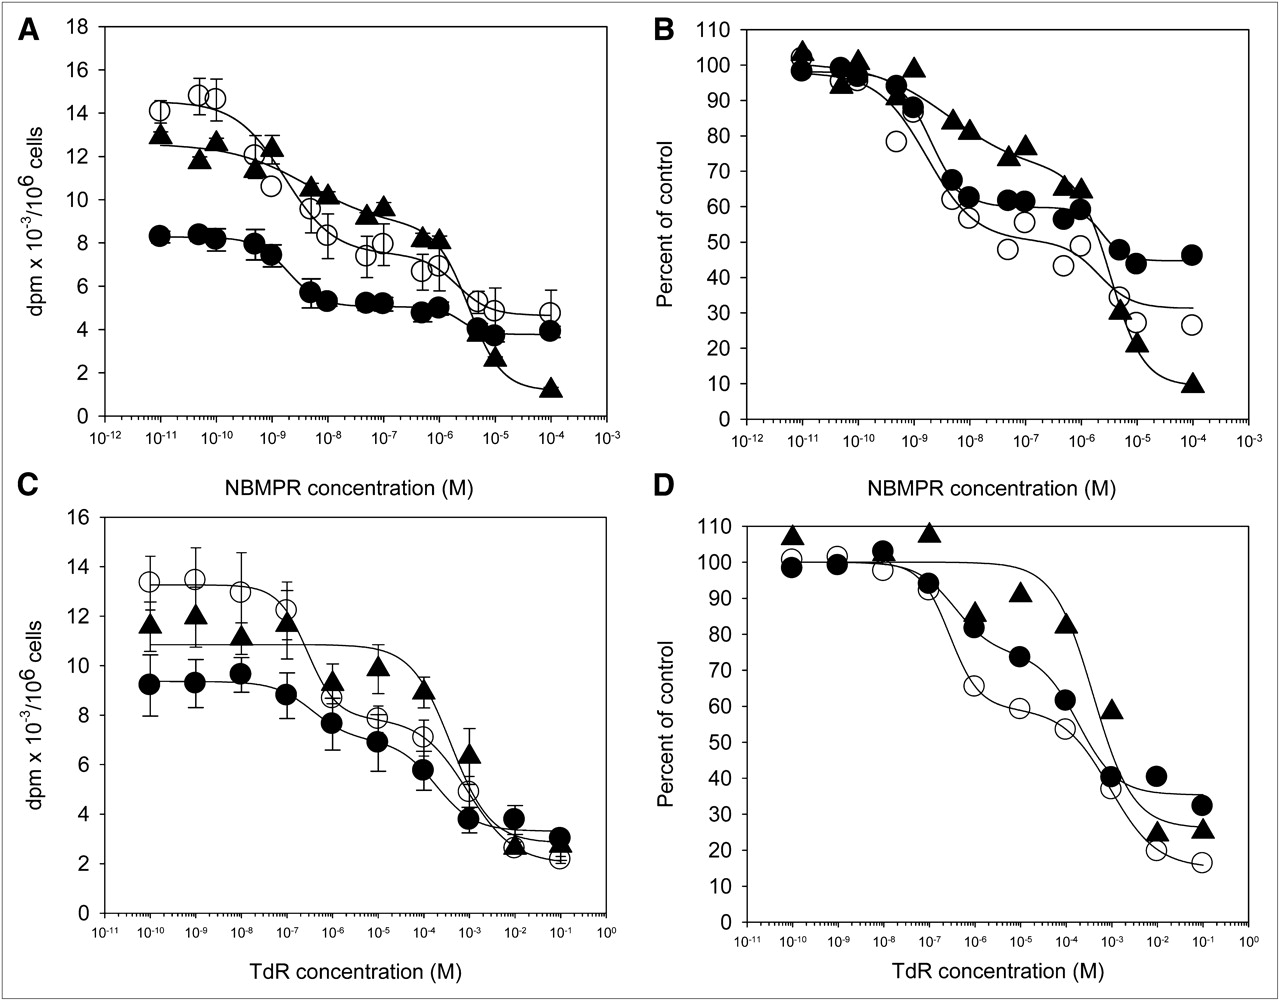
Equilibrative transmembrane transport was studied in more detail using a range of concentrations of the hENT inhibitors dipyridamole, nitrobenzylthioguanosine ribonucleoside, and NBMPR (10,21,22). To focus only on transport into cells and minimize effects due to efflux, a short incubation time of 1 min was chosen. Results for the 3 competitive inhibitors were similar. Results with NBMPR are presented in Figure 2A. NBMPR inhibited 3H-thymidine uptake in plateau-phase cultures in a manner consistent with mediation of 3H-thymidine transport by hENT. The inhibition curve was biphasic. The IC50 for the initial part of the curve was 1.70 ± 0.14 nM, and that for the latter portion of the curve was 206 ± 28 nM. These 2 components of the inhibition curve likely reflected effects on hENT1- and hENT2-specific transport, respectively (12). As shown by the curve in Figure 2A, most of the transport of 3H-thymidine was mediated by hENT1.

Concentration-dependent inhibition of nucleoside uptake in noncycling, plateau-phase cultures of A549 cells. (A) One-minute nucleoside tracer uptake values (disintegrations per minute [dpm]/106 cells) as function of increasing concentrations of NBMPR. (B) Results normalized to no-inhibitor levels. (C) One-minute nucleoside tracer uptake values (dpm/106 cells) as function of increasing concentrations of carrier-added thymidine. (D) Results normalized to no-carrier-added thymidine. Results are mean ± SD of at least 3 replicates. ○ = 3H-thymidine; ● = 3H-FLT; and ▲ = 3H-FMAU; TdR = thymidine.
Overall levels of 3H-FLT transport were approximately half of that observed for 3H-thymidine (Fig. 2A). However, when normalized to control uptake levels, the shapes of the dose–response curves for 3H-thymidine and 3H-FLT were similar, especially at the lower NBMPR concentrations (Fig. 2B). The IC50s for 3H-FLT of 1.94 ± 0.06 and 240 ± 17 nM were also similar to those for 3H-thymidine. As with 3H-thymidine, much of the NBMPR-sensitive transport was by hENT1.
The shape of the inhibition curve was different for 3H-FMAU (Figs. 2A and 2B). Like the other 2 nucleosides, the dose response was biphasic, with IC50s of 4.19 ± 0.20 and 316 ± 7 nM. However, much of the inhibition of transport was seen at higher NBMPR concentrations than that observed for 3H-thymidine or 3H-FLT, suggesting that 3H-FMAU transport was dominated by hENT2.
The similarity in uptake inhibition curves for 3H-thymidine and 3H-FLT and the difference between them and 3H-FMAU was confirmed in an analysis of uptake as a function of increasing concentrations of carrier-added thymidine to compete with the radiolabeled tracers (Figs. 2C and 2D). Inhibition curves for 3H-thymidine and 3H-FLT had similar biphasic shapes, whereas 3H-FMAU was less sensitive to 3H-thymidine–mediated inhibition.
Nucleoside Efflux
Nucleoside efflux was measured over a 15- to 60-s interval in cells that had been cultured in the presence of different nucleosides for 60 min. For all 3 nucleosides, efflux was less than influx (Fig. 3A). For 3H-thymidine, efflux was an order of magnitude less than influx. For 3H-FLT and 3H-FMAU, rates of efflux were 4- to 5-fold slower than rates of influx. The slopes for the regression lines in Figure 3A were 0.11 ± 0.02 (3H-thymidine), 0.26 ± 0.13 (3H-FLT), and 0.20 ± 0.11 (3H-FMAU). NBMPR reduced both 3H-thymidine and 3H-FLT efflux by about 40%–45% (Fig. 3B). In contrast, 85% of 3H-FMAU efflux was sensitive to NBMPR inhibition.

Nucleoside efflux from noncycling, plateau-phase cultures of A549 cells. (A) Relationship between nucleoside uptake and efflux in cells preloaded with tracers and then incubated in tracer-free buffer for 15–60 s. (B) NBMPR-sensitive and -resistant nucleoside efflux in cells preloaded with tracers and then incubated in tracer-free buffer for 15–60 s. Results are mean ± SD of at least 3 replicates. ○ = 3H-thymidine; ● = 3H-FLT; ▲ = 3H-FMAU; dpm = disintegrations per minute.
Nucleoside Metabolism
Metabolites of each of the 3 nucleosides were measured in nonproliferating cells cultured for 1 and 60 min in buffer containing 3H-thymidine, 3H-FLT, or 3H-FMAU (Table 1). 3H-Thymidine was rapidly metabolized: after 1 min, 56% of the intracellular activity was in the form of nucleoside, 14% was catabolized to thymine, and the rest was found in nucleotides. 3H-Thymidine triphosphate was the most prevalent nucleotide. Less than 1% of the activity was in DNA. By 60 min, 9% of the intracellular activity was in the form of nucleoside, 5% was as thymine, 5% was as monophosphate, 14% was as diphosphate, 63% was as thymidine triphosphate, and 5% incorporated into DNA. There was only a small level (5%) of phosphorylated 3H-FLT in cells at 1 min after incubation, and all of it was in the form of 3H-FLT monophosphate. The rest of the activity was in the form of 3H-FLT nucleoside. By 60 min, only 13% of the intracellular activity was found as 3H-FLT nucleoside. The remaining activity was as 3H-FLT monophosphate (65%), 3H-FLT diphosphate (8%), and 3H-FLT triphosphate (14%). Less than 1% of the activity was found in DNA after a 1-h incubation. There was no evidence for any 3H-FMAU metabolism at 1 min, but by 60 min, 65% of the intracellular activity was in 3H-FMAU nucleotides, 26% was in 3H-FMAU monophosphate, 10% was in diphosphate, 28% was in triphosphate, and 2% was in DNA.

(A) Western blot probed with rabbit anti-hENT1 antibody. Bands from left to right are whole-cell lysates from noncycling cells, whole-cell lysates from exponentially growing cells, membrane preparations from noncycling cells, and membrane preparations from exponentially growing cells. (B) ENT content measured in membrane preparations by 3H-NBMPR binding assay. White bar = noncycling cells; black bar = exponentially growing cells. (C) Tracer uptake after incubation for 60 s in buffer ± 10−4 M NBMPR in plateau-phase, noncycling, and asynchronous exponentially growing A549 cells.
Metabolism of 3H-Tracers*
To confirm that the reduced efflux with 3H-thymidine reflected the phosphorylated products of metabolism, nonproliferating cells were cultured for 60 min in buffer containing 3H-thymidine, 3H-FLT, or 3H-FMAU and then were washed extensively, and retained activity was analyzed. For 3H-thymidine and 3H-FLT, only the phosphorylated forms remained (Table 1). For 3H-thymidine, 5% was monophosphate, 14% diphosphate, 66% triphosphate, and 15% DNA. For 3H-FLT, fractional levels of mono-, di-, and triphosphate were 41%, 11%, and 48%, respectively. No activity was found in DNA. The absence of any free 3H-thymidine or 3H-FLT nucleoside was consistent with an absence of any measureable nucleotidase activity under these experimental conditions. There remained about 8% of the 3H-FMAU nucleoside in cells 60 min after allowing for efflux. The rest was in the form of nucleotides, with the triphosphate predominating. Only 1% of the activity was in DNA.
Proliferation-Dependent Variations in Nucleoside Transport
In the noncycling A549 cells, the proportions of cells in different phases of the cell cycle were 90% G1, 6% S, and 2% G2/M. The small percentage of cells in S phase was mostly noncycling cells, because most cells with S-phase DNA content did not show any BrdU incorporation. In exponentially growing cultures, cell-cycle phase distribution was 40% G1, 45% S, and 11% G2/M. Almost all of the S-phase cells were labeled with BrdU. There was between a 1.6- and 1.8-fold increase in hENT1 as measured in cell membrane preparations using both Western blot and NBMPR binding (Figs. 4A and 4B).
3H-Thymidine uptake in exponentially growing cells increased 2-fold over nonproliferating cells after a 1-min incubation (Fig. 4C). Faster rates of 3H-thymidine uptake in exponentially growing cells were not observed in cells cultured with NBMPR. 3H-FLT uptake increased 1.4-fold in the exponentially growing cells. The 3H-FLT increase was also eliminated by culture in NBMPR. There was no increase in 3H-FMAU uptake in the exponentially growing cells, but there was an increase in NBMPR-resistant uptake.
DISCUSSION
Previous publications suggest that nucleoside transporters might influence PET tracer uptake and therefore lead to modification in the intracellular tracer signal (9,10). Nucleoside transporter levels vary across different tissues and between different tumors (17,24–26). Transporter levels may also differ in cycling and noncycling cells (27,28). Understanding transport mechanisms for different nucleoside PET tracers is important for evaluating clinical results. This study confirmed that changes in transporter levels—such as occur when tumor cells move from a plateau-phase, nonproliferating state to exponential growth—will influence rates of tracer influx and efflux. The magnitude of effect, however, is highly dependent on the nucleoside being studied; these 3 nucleosides differ in the characteristics of their transport.
3H-Thymidine and 3H-FLT shared an important common transport characteristic; transport of both 3H-thymidine and 3H-FLT was dominated by the hENT1 transporter (Fig. 2). In contrast, 3H-FMAU transport was dominated by hENT2 (Fig. 2). Rates of hENT1-dependent transport were faster for 3H-thymidine than for 3H-FLT (Fig. 4C). Rates of hENT2-dependent 3H-FMAU transport were intermediate. Although most of the nucleoside transport was mediated by hENTs, a significant fraction of the 3H-FLT transport was not (Fig. 1). The simplest explanation was that a major portion of 3H-FLT transport was by passive diffusion.
All 3 tracers concentrated in the nonproliferating cells at levels many-fold greater than their concentration in buffer (Fig. 1B). Part of the concentration of tracer in cells was due to the low levels of nucleoside metabolism (Table 1), which inhibited tracer efflux (Fig. 3). After 1 h of incubation in tracer-containing buffer, most of the intracellular activity was present in nucleotides. Some (<10% of total activity) incorporation into DNA was observed for 3H-thymidine and to a lesser extent 3H-FMAU in these nonproliferating cells. There was no evidence for incorporation of 3H-FLT into DNA. The rate at which each tracer reached a plateau level was consistent with different rates of nucleoside metabolism. The flattening of these curves was not due to balanced uptake and efflux (Fig. 3). There was also no evidence for any nucleotidase activity affecting nucleotide tracer concentrations. Presumably there must be another mechanism to maintain steady-state levels of tracers in plateau-phase cultures, namely the thermodynamic equilibration of the nucleotide pool.
3H-FMAU uptake and phosphorylation was much slower than that for either 3H-thymidine or 3H-FLT. Whether the slower metabolism reflected a dominant role of thymidine kinase 2 (29,30) in its metabolism was not tested. However, 3H-FMAU could be metabolized by purified TK1 but at a much slower rate than either 3H-thymidine or 3H-FLT (Plotnik et al., unpublished data, 2010). A slower rate of metabolism was consistent with the lower intracellular concentration (Fig. 1B), the observation of 3H-FMAU nucleoside in cells 1 h after removal of labeled compound from buffer (Table 1), and the greater levels of NBMPR-sensitive efflux observed for 3H-FMAU (Fig. 3).
Movement of plateau-phase cells into the exponential growth state was associated with a 1.6- to 1.8-fold increase in membrane-associated hENT1 (Fig. 4A). The 60-s intracellular levels of 3H-thymidine were about 2-fold greater in proliferating cells, an increase that was NBMPR-sensitive and presumably due to the increased levels of hENT1 (Fig. 4B). There was a smaller 1.4-fold increase in 3H-FLT uptake in exponentially growing cells that was also NBMPR-sensitive. The smaller relative increase in 3H-FLT uptake than in 3H-thymidine was possibly due to the greater dependence of 3H-thymidine uptake on ENT1-mediated transport (Fig. 1). The link between proliferation and hENT1 levels makes separating the relative importance for transporters from that for TK1 activity in defining tracer signal more difficult. There was no change in 3H-FMAU transport in exponentially growing cells, consistent with mediation of 3H-FMAU transport by hENT2. The increase in NBMPR-resistant uptake might reflect greater thymidine kinase 2 activity.
CONCLUSION
These results underscore the importance of understanding the variables that define tracer uptake in proliferating and nonproliferating tumor cells. Transport mechanisms are not the same for 3H-thymidine, 3H-FLT, and 3H-FMAU; hENT1 transport dominates for 3H-thymidine, passive diffusion for 3H-FLT, and hENT2 for 3H-FMAU. Levels of hENT1 increase in proliferating cells and are associated with increased rates of 3H-thymidine and 3H-FLT transport. The observation that nucleoside tracers concentrate in nonproliferating tumor cells because of relatively low levels of TK1 and other enzymatic activities suggests that alterations in cell-cycle checkpoint control in different tumor cells might influence the baseline PET tracer signal in vivo.
Acknowledgments
This work was supported by grant CA118130 from the National Institutes of Health.
- © 2010 by Society of Nuclear Medicine
REFERENCES
- Received for publication March 1, 2010.
- Accepted for publication June 10, 2010.


Jump to section
Related Articles
Cited By...
- [18F]CFA as a clinically translatable probe for PET imaging of deoxycytidine kinase activity
- PET Imaging of Proliferation with Pyrimidines
- Tumor 3'-Deoxy-3'-18F-Fluorothymidine (18F-FLT) Uptake by PET Correlates with Thymidine Kinase 1 Expression: Static and Kinetic Analysis of 18F-FLT PET Studies in Lung Tumors