


Abstract
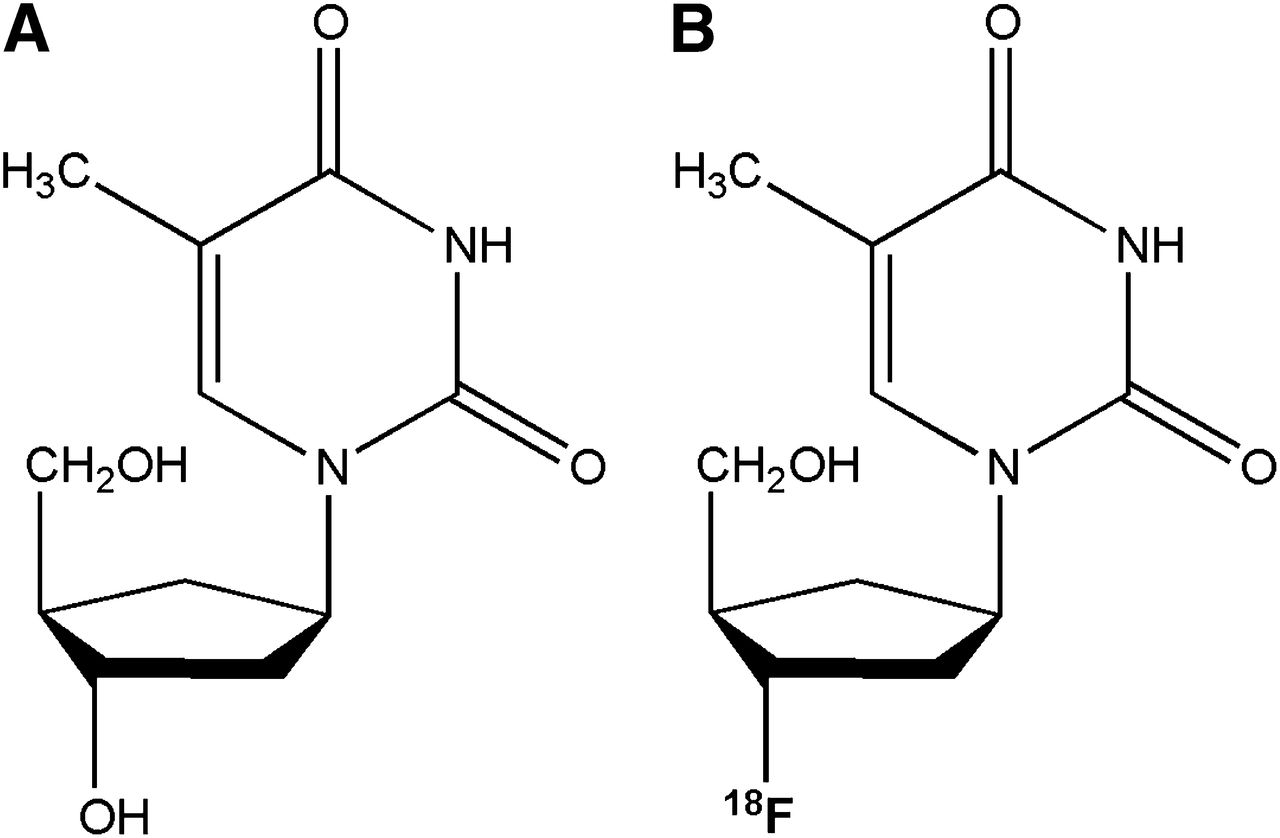
Several new tracers are being developed for use with PET to assess pathways that are altered in cancers, including energy use, cellular signaling, transport, and proliferation. Because increased proliferation is a hallmark of many cancers, several tracers have been tested to track the DNA synthesis pathway. Thymidine, which is incorporated into DNA but not RNA, has been used in laboratory studies to measure tumor growth. Because thymidine labeled with 11C undergoes rapid biologic degradation and has a short physical half-life, tracers labeled with 18F have been preferred in PET imaging. One such tracer is 18F-labeled 3′-deoxy-3′-fluorothymidine (18F-FLT). 18F-FLT is trapped after phosphorylation by thymidine kinase 1, whose expression is increased in replicating cells. Several studies on breast, lung, and brain tumors have demonstrated that retention of 18F-FLT correlated with tumor proliferation. Although 18F-FLT has been used to image and stage several tumor types, the standardized uptake value is generally lower than that obtained with 18F-FDG. 18F-FLT can be used to image many areas of the body, but background uptake is high in the liver, marrow, and renal system, limiting use in these organs. 18F-FLT PET imaging has primarily been studied in the assessment of treatment response. Rapid declines in 18F-FLT retention within days to weeks have been demonstrated in several tumor types treated with cytotoxic drugs, targeted agents, and radiotherapy. Further work is ongoing to validate this approach and determine its utility in the development of new drugs and in the clinical evaluation of standard treatment approaches.
Imaging of proliferation has many potential clinical applications. In normal tissues with high growth rates, imaging may help with assessment of the proliferation and health of that tissue. Because tumors are an accumulation of cells due to increased proliferation or decreased cell death, high proliferation found in unexpected locations may indicate neoplastic growth. Several labeled molecular tracers have been developed for routine and research uses in medicine, but at present only 18F-FDG has come into routine use with PET in oncology. 18F-FDG tracks general cellular metabolism, which may correlate with proliferation in some tumors. However, 18F-FDG does not provide a direct measure of cell growth. This review will discuss PET tracers used in proliferation imaging, although the main focus will be on 18F-labeled 3′-deoxy-3′-fluorothymidine (18F-FLT) PET, which is being increasingly evaluated in several areas of medicine as a proliferation tracer (Fig. 1).

Structures of thymidine (A) and 18F-FLT (B) with fluoride in position of hydroxide. Fluorine substitution allows labeling with 18F.
PROLIFERATION IMAGING AND ITS ROLE IN PRACTICE
Measurement of proliferation, either in normally proliferating tissues or in abnormally growing neoplastic lesions, is an important part of evaluating tissue function and characteristics. For imaging purposes, one way to measure proliferation is to determine the change in the anatomic size of a tumor, as is routinely done with CT and MR imaging, as well as ultrasonography. Limitations in assessing tumor size include the delayed growth seen with viable tumors and the possibility that cell death may not result in early shrinkage of tumors. This is an increasingly common problem with antivascular and other targeted agents, which may cause changes in tumor density or turn off growth-signaling pathways. Tumor size may be unchanged or actually increase. Thus, other methods have been developed to determine metabolic activity by measuring blood flow (using dynamic contrast MR or CT) and energetics (using MR spectroscopy and PET). Another marker of cell growth and proliferation is uptake of the molecules that are needed for synthetic pathways, including labeled amino acids for measuring transport and protein synthesis and nucleosides for DNA synthesis.
Tracing the uptake of these molecules in vivo has been the basis of nuclear proliferation imaging. Among the various methods of nuclear imaging, PET is the most sensitive and accurate and has become more widely available. In evaluating the relatively low-resolution images, one should note that tumors are heterogeneous tissues and that some parts proliferate whereas others may die. The low resolution of nuclear techniques may result in an image showing a combination of viable and nonviable tissue, which can vary even at the microscopic level. The final image is a mixture, which usually favors the dominant component. Although PET is generally combined with other high-resolution modalities such as CT, this combination provides improved anatomic localization but does not alter the characterization of the metabolic activity (1,2).
Metabolic imaging of tumors is based on higher energy consumption and higher uptake of the molecules that dividing cells use in synthesis. Among the most commonly used methods in metabolic imaging are tracers to assess glucose transport (18F-FDG), choline kinase activity (11C-choline), amino acid transport (11C-methionine), and activity of thymidine kinase 1 (18F-FLT). Cells use nucleosides to synthesize DNA. Among the nucleosides, thymidine is exclusively used in the DNA structure. After entering the cells by multiple different transporters passively or actively (3,4), thymidine is phosphorylated into a more polarized molecule and cannot freely exit the cells. This mechanism has been used to accurately measure DNA synthesis in cell cultures using 3H-thymidine. Its use in nuclear imaging, when labeled with 11C, has been limited by the short half-life of the tracer and its rapid catabolism in the body (5). This limitation has led to development of newer thymidine analogs. The most accepted thymidine analog for proliferation imaging is 18F-FLT. Like thymidine uptake, 18F-FLT uptake correlates with the S phase. 18F-FLT incorporation into the DNA fraction is negligible (0.2%) (6). A meta-analysis of the studies on 18F-FLT uptake and tumors expressing Ki-67 showed a persistent correlation between them (7). These examples demonstrate the uniqueness of tracers and how they may be applied to medicine. Another thymidine analog, 1-(2′-deoxy-2′-fluoro-β-d-arabinofuranosyl)thymine, is phosphorylated by mitochondrial thymidine kinase 2, incorporates into DNA, and may measure cell stress and viability. In contrast to animal studies, in human subjects uptake of this analog is high in the tumor and low in the bone marrow. Although partially due to faster clearance from the bloodstream and different kinetics, the main reason may be the higher activity of mitochondrial thymidine kinase 2 in human cells (8).
Imaging of tumor proliferation can be applied in decision making on prognosis and treatment options. Finding a specific tracer for proliferation has been a challenge. Tracer uptake relies on an understanding of both pharmacokinetics and pharmacodynamics. One major challenge has been to correlate what is happening in cell cultures and preclinical studies with clinical studies (9,10). Because of the higher sensitivity of PET, positron-emitting tracers have attracted interest for widespread use. An interesting application of proliferation imaging studies has been to predict the response to treatment based on imaging values obtained during the course of treatment. The basis of this thought is that treatment-induced changes in tumor physiology will predict tumor cell viability earlier than anatomic imaging.
BONE MARROW AND HEMATOLOGIC MALIGNANCIES
18F-FLT has high uptake in proliferating tissue, including bone marrow (11). Although this review discusses some studies about detecting bone tumors and metastases, bone marrow uptake is one of the limiting factors in applying 18F-FLT PET in cancer staging, along with liver uptake. However, 18F-FLT PET also has been used to measure the health and proliferation of the marrow, especially in patients undergoing bone marrow transplantation (12). 18F-FLT PET imaging was found useful in evaluating bone marrow in patients with aplastic anemia (13). Interestingly, the main characteristic of 18F-FLT PET in patients with extramedullary hematopoiesis was higher uptake in the spleen and liver (14). One major side effect of many cancer treatments is bone marrow suppression. 18F-FLT uptake has been shown to decrease after radiation, especially in areas with active marrow, including the skull and pelvis (15–17). In patients undergoing radiation treatment, both the profile and the individual vertebral data have shown a strong correlation between change in 18F-FLT uptake and radiation dose. The reduction in standardized uptake value (SUV) was approximately linear with radiation dose (17).
In one study (18), 18F-FLT PET was used to assess patients with leukemia, in whom uptake was higher in leukemic marrow (SUV, 6.6) than in normal marrow (SUV, 1.5). In this study of 10 patients, extramedullary disease was also accurately noted in 4 patients. Leptomeningeal disease has been seen in a patient with lymphoma using 18F-FLT PET (19). 18F-FLT PET is now being explored to determine whether patients with acute leukemia have achieved marrow ablation, which is predictive of remission (20). Patients with acute myelogenous leukemia who do not achieve remission after the first induction course are generally given a second course of intensive chemotherapy. The most common approach for early evaluation of treatment has been to obtain a bone marrow biopsy on day 14 of treatment. Unfortunately, histologic marrow assessment at day 14 does a relatively poor job at predicting remission at 28 d. In one study, of patients with evidence of residual leukemia in day 14 marrow, 36% achieved complete remission, whereas 21% without leukemia on the early marrow did not reach remission (21). A pilot study on 7 patients imaged with 18F-FLT PET immediately after completion of induction chemotherapy was able to accurately predict remission (5 patients) or relapse (2 patients) at 1 mo (Fig. 2) (20). A more accurate determination of remission status early after treatment would help direct treatment, and this approach is being further explored.
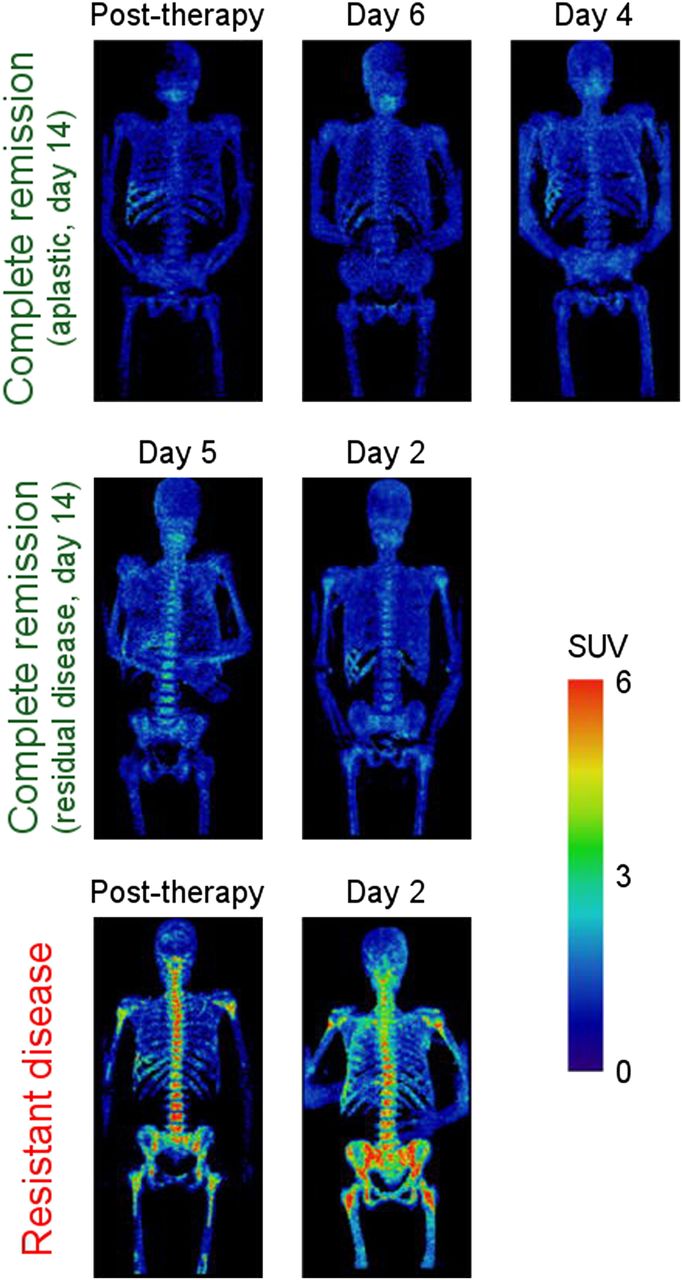
18F-FLT PET images of bone marrow of 7 AML patients grouped by clinical response. PET scans were acquired at different time points of therapy, but results were consistent within each clinical response group (complete remission and resistant disease), independent of time of assessment. Resistant disease exhibited elevated uptake, whereas complete remission displayed low uptake. (Reprinted with permission of (20).)
In a study of 66 patients with non-Hodgkin lymphoma, the relative uptake of 18F-FLT before the start of therapy was predictive of the ultimate response to treatment, with those achieving complete response having a lower mean SUV of 7.1, compared with 9.5 in the other patients (P = 0.049) (Fig. 3) (22). In another study of non-Hodgkin lymphoma, staging with 18F-FLT PET/CT had a higher sensitivity and specificity than CT alone (23). In this study of 38 patients, 18F-FLT PET and CT agreed in 79% of the lesions, but PET had better sensitivity and specificity although no comparison was made with 18F-FDG PET.

Transaxial views of 18F-FLT PET (top), helical CT (middle), and 18F-FDG PET (bottom) for 2 patients with DLBCL. (A) A 41-y-old man with retromandibular lymphoma showing intense 18F-FDG and 18F-FLT uptake in projection of retromandibular lymph node. This stage 1A patient revealed disease progression under therapy. (B) A 40-y-old woman (stage IVA) with histologically proven lymphoma in right iliac bone and sacrum. 18F-FDG PET shows intensely increased uptake in right ilium and sacrum. Corresponding 18F-FLT PET images allow detection of increased asymmetric uptake in right ilium and sacrum despite high physiologic 18F-FLT uptake in proliferating bone marrow. Transaxial views of helical CT display osteodestruction of right ilium. Restaging after end of therapy revealed complete response. (Reprinted from (22).)
18F-FLT has also shown a good correlation with proliferation and response to therapy in lymphoma. In mice implanted with human diffuse B-cell lymphoma, 18F-FLT uptake decreased by day 2 after treatment with doxorubicin, compared with control mice and baseline scans. Furthermore, the decrease in 18F-FLT retention correlated with an increased dose of doxorubicin, whereas there were variable changes in 18F-FDG retention. In patients with high-grade non-Hodgkin lymphoma, treatment with CHOP/R-CHOP (rituximab, cyclophosphamide, hydroxydaunomycin, vincristine, and prednisone) resulted in a 77% decrease in retention by day 7 (24). In patients who initially received rituximab (before starting CHOP), there was no decrease in 18F-FLT by day 2. Increased 18F-FLT uptake was also noted in patients with mantel cell lymphoma, along with rapid declines in retention after 1 wk of therapy (22).
SARCOMAS
Even though 18F-FLT uptake in normal bone marrow might interfere with imaging of tumors involving the bone, such does not appear to be an issue in sarcomas. In 2 studies of patients with bone or soft-tissue sarcomas, all tumors were visualized in 36 patients (25,26). Both studies showed that 18F-FLT uptake correlated with grade whereas 18F-FDG uptake did not. An 18F-FLT SUV cutoff of 2.0 was able to differentiate high- from low-grade tumors (25). 18F-FLT PET has also been used to assess response in patients with sarcomas. A study of 10 patients imaged before and after (∼1 mo) hyperthermic isolated limb perfusion with chemotherapy demonstrated the treatment effect in all but one patient, with areas of necrosis and decreased 18F-FLT retention (27). In general, patients with higher baseline 18F-FLT uptake responded better to the treatment. On the other hand, a recent study of 20 patients before and after neoadjuvant chemotherapy for sarcomas did not find that the histologic response was accurately reflected by the change in 18F-FLT retention (28). 18F-FLT SUV peak declined on average from 7.1 to 2.7, but the post-treatment retention did not correlate with Ki-67 or thymidine kinase 1 levels. Further work is needed to determine the utility of this approach in sarcomas.
BREAST CANCER
Although 18F-FDG PET has been regularly used to detect, stage, and evaluate treatment response in patients with breast cancer, 18F-FLT has also been used in several studies. For example, in a study of newly diagnosed patients, 13 of 14 primary lesions and 7 of 8 patients with positive axillary nodes were detectable by 18F-FLT (29). Although the average uptake was lower with 18F-FLT (SUV, 3.2) than with 18F-FDG (SUV, 4.7), the lower background activity in normal breast tissue led to comparable conspicuity. 18F-FLT uptake has been shown to correlate with histologic assessment of proliferation by Ki-67 in breast, lung, and brain cancers in a recent analysis of 27 such studies (7). Changes in 18F-FLT uptake have been detected as early as 1 wk after chemotherapy with 5-fluorouracil, epirubicin, and cyclophosphamide (30). Responding lesions had an average decrease in SUV of 41.3%, whereas in nonresponders the SUV increased by 3.1%. Several methods are available for analyzing images with 18F-FLT to detect changes after chemotherapy, including SUV, tumor–to–whole blood ratio, and nonlinear regression kinetic models (31). In this study of 15 patients with locally advanced breast cancer, tumor–to–whole blood ratio provided a measure that correlated better with dynamic imaging than SUV but still was relatively simple. In the end, the measure to be used will depend on which is the easiest and is able to predict the ultimate clinical response.
CENTRAL NERVOUS SYSTEM CANCERS
Although MR imaging remains the standard for the evaluation of tumors of the brain, the aggressiveness of tumors is often difficult to determine, particularly in areas that are not viable. Because of the high uptake of 18F-FDG in normal brain tissue, there is an interest in using other radiotracers to evaluate tumors of the central nervous system. 18F-FLT has a low background uptake in the normal brain, since it does not readily cross the blood–brain barrier. Although 18F-FLT has found use in the assessment of brain tumors, one must keep in mind that breakdown of this barrier can lead to increased activity in the absence of cell proliferation. A recent study compared 18F-FDG, 18F-FLT, and 11C-methionine PET tracers in patients with grade II–IV gliomas (32). Although 18F-FDG could not be used to differentiate between the different tumor grades, both 18F-FLT and 11C-methionine demonstrated a clear difference. For example, grade II and IV tumors demonstrated increased mean 18F-FLT retention with SUVs of 0.36 and 2.38, respectively, and 11C-methionine retention with SUVs of 3.04 and 5.12, respectively. The areas with high 18F-FLT retention demonstrated an increased Ki-67 index, as was the case for 11C-methionine uptake.
Uptake of 18F-FLT has been used to evaluate radiation necrosis compared with tumor recurrence, and both 18F-FDG and 18F-FLT provided accurate assessments (33).
A study evaluated 18F-FLT uptake 2 and 6 wk after treatment with bevacizumab combination therapy in 30 patients with gliomas (Fig. 4) (34) and found that 18F-FLT, particularly at 6 wk, was the best predictor of overall survival in a multivariant analysis and was more accurate than MR imaging alone. 18F-FLT PET responders survived a mean of 12.5 mo, whereas nonresponders survived only 3.8 mo (P < 0.001). Another study on 18F-FLT PET uptake in recurrent malignant gliomas after bevacizumab treatment also showed that decreased 18F-FLT uptake was associated with longer progression-free survival, although the evaluation of overall survival correlated better with 18F-fluoro-l-phenylalanine (35). However, because of relatively low uptake of 18F-FLT in brain tumors, disruption of the blood–brain barrier may interfere with proper evaluation of the tumors, since 18F-FLT can be retained in some areas after successful therapy or in benign lesions as well (36). In addition to tumor SUVs, the use of combined 18F-FLT kinetic changes has also been suggested for more accurately predicting treatment response, recurrence, and treatment outcome, since these take into account tracer delivery (37,38). This factor may partially explain the high sensitivity and low specificity of 18F-FLT in detecting recurrent brain tumors (39).
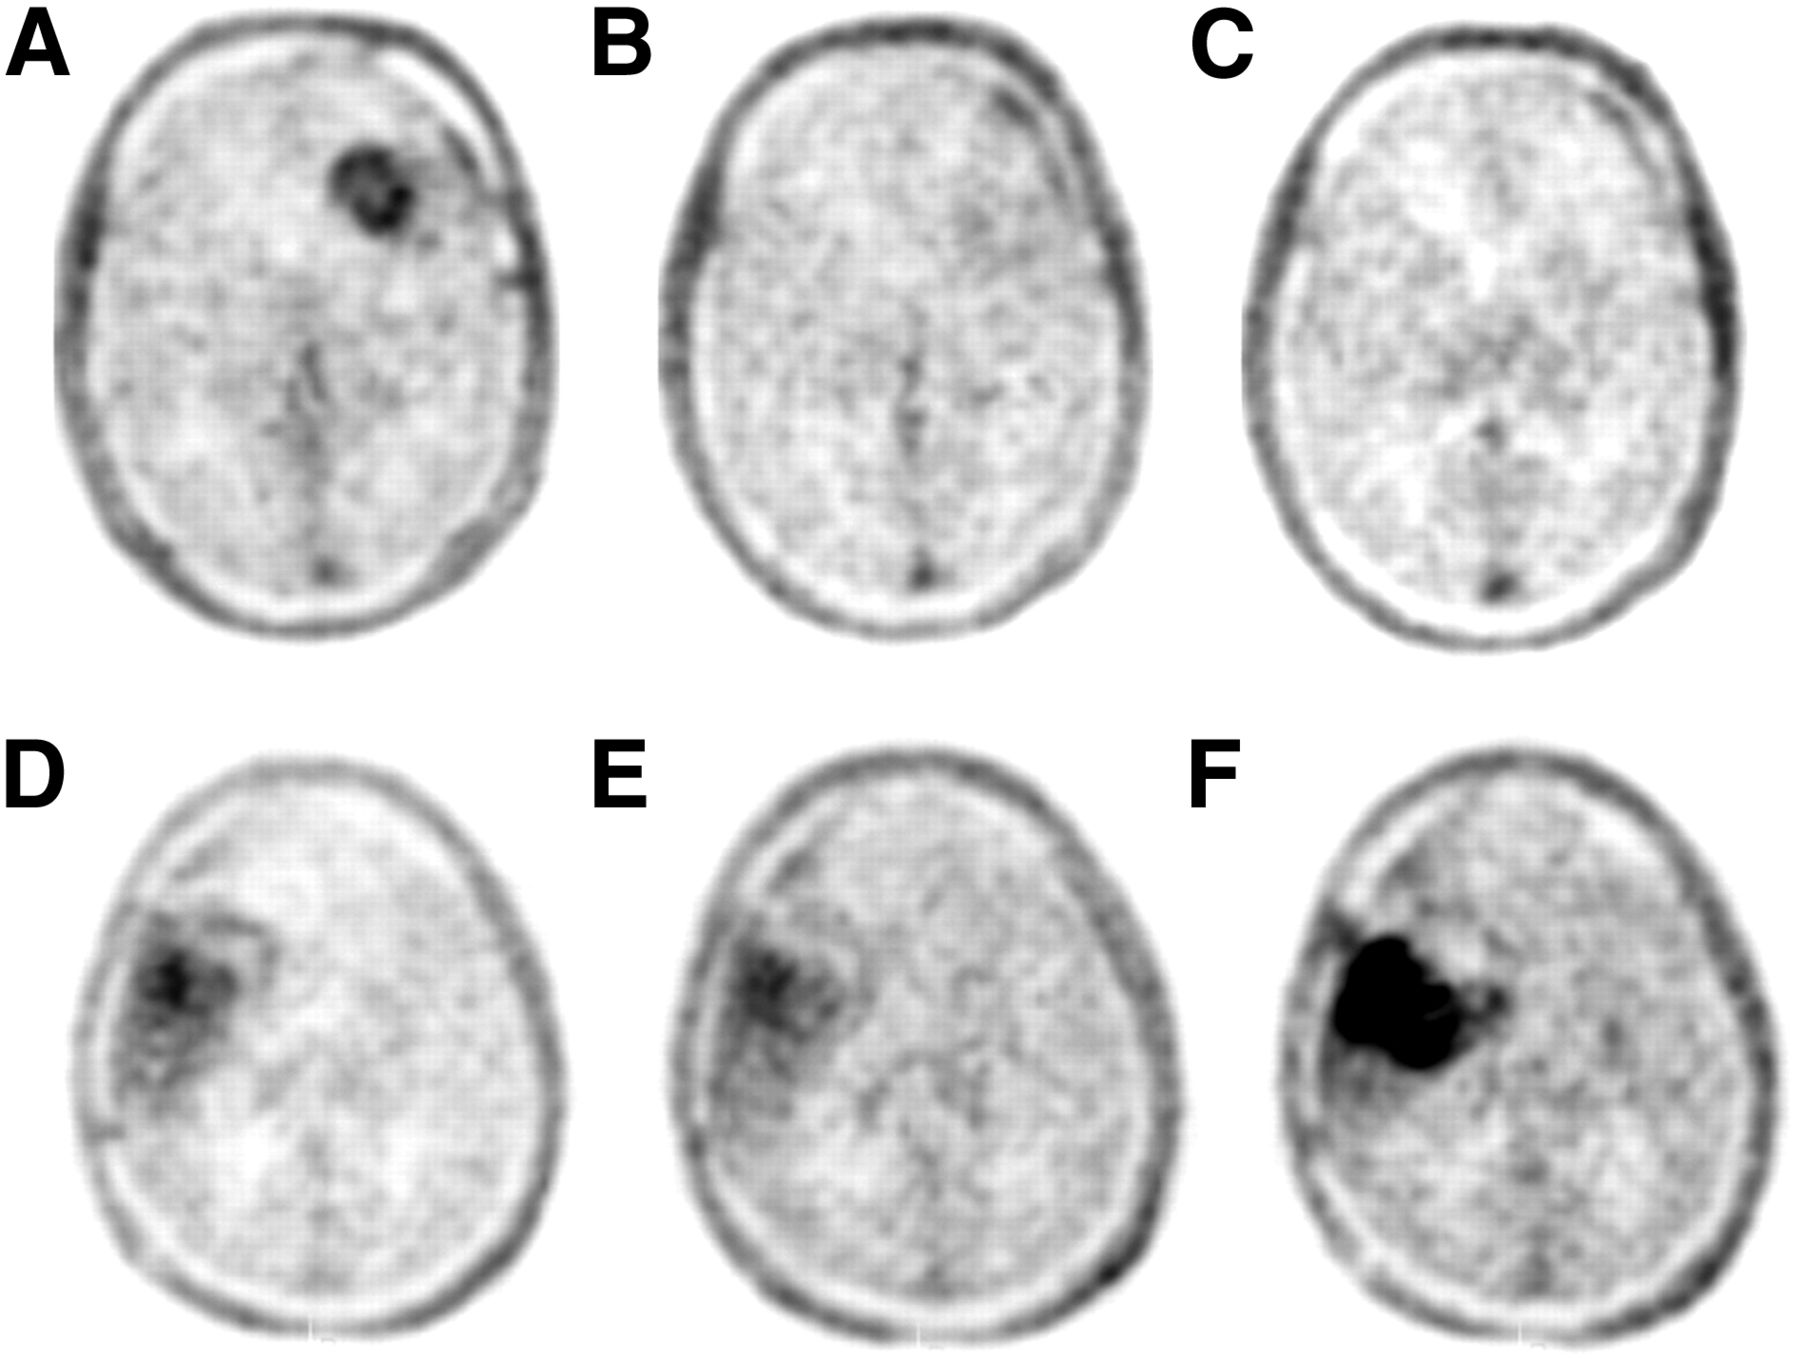
18F-FLT PET at baseline, 2 wk, and 6 wk for responding patient (A–C, patient 25) and nonresponding patient (D–F, patient 9). (Reprinted from (34)).
GASTROINTESTINAL CANCERS
The use of 18F-FLT in gastrointestinal cancers is limited in part by physiologic retention in the liver, where 18F-FLT is glucuronidated; in the kidneys and bladder, where it is excreted; and in the marrow, where proliferation occurs. Even with these limitations, 18F-FLT has shown utility in several studies. In colon cancer, as seen with several other tumor types, 18F-FLT uptake is lower than 18F-FDG uptake, with a mean SUV (SUVmean) of 5.4 ± 2.4 and 12.4 ± 6.3, respectively (P < 0.003), although all cancers were detected (40). This study and one by Francis et al. (41) gave differing results when 18F-FLT uptake and Ki-67 were compared, with the former not demonstrating a correlation whereas the latter did (r = 0.8, P < 0.01). Although 18F-FLT has been able to detect primary colon cancers, it is clearly limited in the liver because of physiologic retention in that organ (42). In a recent study, 18F-FLT and 18F-FDG PET were used to evaluate patients receiving neoadjuvant chemoradiotherapy for rectal cancer (43). Although the change in 18F-FLT retention did not predict pathologic response, disease-free survival was predicted by 18F-FLT uptake during therapy and by the percentage decrease but was also predicted by the pretreatment 18F-FDG uptake level.
In 22 patients with esophageal squamous cell carcinoma, 18F-FLT and 18F-FDG PET were performed before surgery. 18F-FDG uptake in locoregional lymph node metastases was significantly higher than 18F-FLT uptake (18F-FDG median maximum SUV [SUVmax], 5.4; range, 2.4–10.6; 18F-FLT median SUVmax, 2.8; range, 1.3–4.6). There were 14 false-positives with 18F-FDG, compared with 3 with 18F-FLT, and 8 false-negatives with 18F-FDG, compared with 12 with 18F-FLT (44). 18F-FLT also better delineated gross tumor volume for radiation treatment planning, with improved sparing of the lungs and heart (45). In another study, on 10 patients with biopsy-proven esophageal and gastroesophageal cancer, 18F-FDG PET was able to detect all esophageal cancers whereas 18F-FLT PET visualized the tumor in only 8 of the 10 patients. The 18F-FDG SUVmean of about 6.0 was higher than the 18F-FLT SUVmean of 3.4, and like the aforementioned study, neither correlated with Ki-67 expression in the linear regression analysis (46). Nevertheless, 18F-FLT has been successfully used to image proliferation in esophageal squamous tumors after treatment with radiation and chemotherapy (47). This study showed that 18F-FLT uptake rapidly decreased after the start of radiotherapy, as early as after 2 Gy of radiation. Two biopsy-proven inflammatory lesions after the end of radiotherapy were still positive on 18F-FDG PET but not on 18F-FLT PET.
Similar to colon and esophageal cancers, gastric cancer has shown lower uptake of 18F-FLT than of 18F-FDG (48). In a series of 45 gastric cancer patients, 18F-FLT and 18F-FDG PET were performed. The mean SUV for 18F-FLT in the primary cancers was 6.0 (range, 2.4–12.7). In 18F-FDG–positive tumors, the mean value for 18F-FDG was 8.4 ± 4.1, versus 6.8 ± 2.6 for 18F-FLT (Wilcoxon test, P = 0.03). Interestingly, signet ring cell tumors had similar uptake of both tracers (6.2 ± 2.1 for 18F-FLT, vs. 6.4 ± 2.8 for 18F-FDG). Although all tumors were visible with 18F-FLT PET, 14 tumors were not detectable with 18F-FDG because of high normal gastric uptake. In another study, 21 patients with advanced gastric cancer were imaged with 18F-FLT PET and 18F-FDG PET (49). There was no significant correlation between Ki-67 index and the SUV obtained with either tracer. The sensitivities of 18F-FLT PET and 18F-FDG PET were 95.2% and 95.0%, respectively. The mean SUV for 18F-FDG, 9.4 ± 6.3, was higher than that for 18F-FLT, 7.0 ± 3.3 (P < 0.05). In a study of 45 patients, all tumors were visible with 18F-FLT PET, including 14 patients with tumors that were not 18F-FDG–avid (50). Comparing 18F-FDG with 18F-FLT, uptake 2 wk after the initiation of neoadjuvant chemotherapy showed only 18F-FLT to have significant prognostic impact and a good correlation with histologic proliferation (Ki-67). The corresponding hazard ratio for the SUVmean of 18F-FLT at day 14 was 1.53 (95% confidence interval, 1.01–2.32; P = 0.048), indicating a risk increment of approximately 50% with each unit increment of 18F-FLT SUVmean. However, neither 18F-FLT nor 18F-FDG uptake predicted clinical or pathologic response in these gastric tumors treated with neoadjuvant chemotherapy. Such results have generated questions about the mechanisms involved in 18F-FLT uptake in gastrointestinal cancers. A study done on 21 patients with newly diagnosed gastrointestinal cancer with 18F-FLT PET demonstrated a significant correlation between 18F-FLT SUV and thymidine kinase 1 (TK1) messenger RNA expression (P < 0.05) (51). However, no significant correlation was found between 18F-FLT SUV and messenger RNA expression of equilibrating nucleoside transporter 1 (P = 0.90). Well-differentiated endocrine tumors have not been studied extensively, but available data suggest that 18F-FLT is not very helpful in these tumors (52).
Because of the high background uptake in the liver and gallbladder, the application of 18F-FLT in imaging hepatobiliary tumors is limited. Studies on primary hepatocellular tumors have shown a mixed uptake pattern for 18F-FLT. About two thirds of the lesions showed 18F-FLT uptake higher than in the surrounding liver tissue, with the rest of the lesions being photopenic or a mixture of hot and cold spots. 18F-FLT PET imaging in untreated patients with hepatocellular carcinoma (16 patients) and cholangiocarcinoma (2 patients) revealed an SUVmean of 7.8 (range, 2.5–11.1) and an 18F-FLT SUVmax of 9.3 (range, 2.9–14.3) (53). In the subgroup of hepatocellular carcinoma, the sensitivity for tumor detection was 69% (11/16; 95% confidence interval, 41%–89%). The Ki-67 score and the 18F-FLT SUVmean correlated in these tumors (r = 0.66, P = 0.02). Like a variety of other cancers, pancreatic cancer has much lower uptake of 18F-FLT than of 18F-FDG, leading to lower sensitivity and higher specificity in differentiating malignant from benign tumors. In a study with 41 patients imaged with 18F-FLT and 18F-FDG PET, 33 had pancreatic malignancy, whereas 8 had benign disease (54). Sensitivity values of 18F-FDG and 18F-FLT PET were 91% (30/33) and 70% (23/33), respectively. Specificities of these techniques were 50% (4/8) for 18F-FDG and 75% (6/8) for 18F-FLT PET. The average SUVmax in all malignant tumors was 3.0 (range, 1.1–6.5) for 18F-FLT and 7.9 (range, 3.3–17.8) for 18F-FDG (P < 0.001. However, these values are technique-dependent. In another study on 31 patients, all 10 benign pancreatic lesions were negative on 18F-FLT PET (specificity, 100%; 90% confidence interval, 74%–100%) (55). On visual interpretation, 15 of 21 malignant tumors had higher uptake (sensitivity, 71.4%; 90% confidence interval, 52%–89%). To differentiate cancer from benign pancreatic lesions, receiver-operating-characteristic analysis using a SUVmean cutoff of 1.8 had a sensitivity of 81% and specificity of 100%. Visual discrimination between benign and malignant tumors has proven difficult in other studies with smaller numbers of patients (56). Despite available preclinical studies, further clinical studies are needed to determine diagnostic, prognostic, and histologic relationships with 18F-FLT uptake in pancreatic tumors.
GENITOURINARY CANCERS
The main issue with imaging the urinary system with 18F-FLT PET is the high background uptake, due to excretion in the urine. Unlike preclinical studies, there are limited clinical data in these cancers, although some case studies have shown promising results such as identifying malignancy in renal cysts (57). 18F-FLT uptake after withdrawal of tyrosine kinase inhibitors has been tested in these renal cancers (58). Sixteen patients were imaged during and then after discontinuing sunitinib; median 18F-FLT PET SUV increased an average of 15% (range, −14%–277%; P = 0.047) with the 4-on, 2-off schedule and +19% (range, −5.3%–200%; P = 0.047) with the 2-on, 1-off schedule. The authors suggested that this increase is consistent with a VEGF receptor tyrosine kinase inhibitor withdrawal flare.
In addition to the mentioned problems in imaging the urinary tract, visualizing ovarian and endometrial tumors in premenopausal women faces another challenge due to periodic physiologic changes of the tissues. Six patients were imaged with 18F-FLT PET in an attempt to differentiate benign from malignant ovarian tissues. SUVmax was higher in malignant tissue (mean, 4.8; range, 1.7–8.8) than in benign tissue (1.65; range, 1.4–1.9) and normal ovarian control tissue (1.12; range, 0.6–1.5) (59). Although there was a trend toward increased 18F-FLT uptake and Ki-67 index in malignant tissues, there has been considerable overlap and further studies will be needed to assess the feasibility of this technique in differentiating benign from malignant ovarian tissues. Clinical studies in germ cell tumors that have evaluated 18F-FLT and 18F-FDG to assess lesions for residual disease have shown limited benefits (60), probably more because of the lower uptake and sensitivity of 18F-FLT in detecting tumors due to lower proliferation (61). Clinical studies are needed to assess 18F-FLT PET applications in testicular cancers.
HEAD AND NECK CANCERS
Head and neck cancers are a diverse group of neoplastic diseases. Like other areas of the body, 18F-FLT uptake has frequently been reported to be lower than 18F-FDG uptake in these tumors. On the other hand, because of a variety of inflammatory processes that can involve the lymph nodes in the head and neck, discrimination between inflammatory and neoplastic involvement in lymph nodes is not easy (62). In 23 patients examined with 18F-FLT PET and 18F-FDG PET, the 18F-FLT SUV in metastatic lymph nodes was 4.8 ± 2.9, compared with 6.9 ± 4.9 for 18F-FDG SUV (P < 0.001). The false-positive and false-negative rates by 18F-FLT and 18F-FDG PET were 4% (1/23) and 17% (4/23), respectively (63). All metastatic lymph nodes larger than 9 mm were detectable by 18F-FLT PET. 18F-FLT uptake was compared with iododeoxyuridine immunohistochemistry staining (to measure proliferation) and TK1 staining in 17 patients with squamous cell carcinoma of the oral cavity (64). There was a weak correlation between 18F-FLT uptake and iododeoxyuridine staining intensity, but it varied with the techniques used. TK1 staining did not correlate with either of the other markers, but immunohistochemistry may not indicate enzymatic activity. In a series of 19 untreated patients, both 18F-FLT and 18F-FDG uptake provided prognostic and survival information in primary head and neck cancers, with an 18F-FLT mean SUVmax of 5.81 ± 2.28, compared with an 18F-FDG mean SUVmax of 8.91 ± 3.58 (65). No correlation was found between the number of Ki-67–positive cells and 18F-FLT. Further studies may reveal the reason for the mismatch between proliferation and 18F-FLT uptake in head and neck cancers. In patients undergoing radiation treatment, 18F-FLT uptake decreased rapidly after the start of therapy and before CT volumetric changes (64). In this study of 10 patients with oropharyngeal tumors, SUVmax and SUVmean decreased significantly as early as 1 wk after therapy initiation and even further before the fourth week of treatment. Despite individual variations, the SUVmax of the second 18F-FLT PET scan was significantly lower than that of the first scan and decreased even more in the third scan (7.6 ± 2.6, 3.1 ± 1.7, and 1.7 ± 0.4, respectively). Long-term (3-y) follow-up of patients undergoing chemoradiation showed the usefulness of 18F-FLT uptake in predicting the long-term effect of the treatment (Fig. 5) (66). In this study of 28 patients with head and neck squamous cell carcinomas, the patients were imaged before therapy, 4 wk after the start of therapy, and then 5 wk after completing radiation therapy. 18F-FLT accumulations disappeared in 34 of 54 lesions (63%), and negative predictive value was 97%. In comparison, 18F-FDG PET during radiation treatment also had a high negative predictive value (100%), but only 9 lesions (16%) showed complete absence of accumulation. Significant differences were observed in 3-y local control between the accumulation and no-accumulation groups on posttreatment 18F-FLT PET (P < 0.0001), and it was concluded that 18F-FLT PET during radiation treatment and early follow-up may help with prediction of outcome.
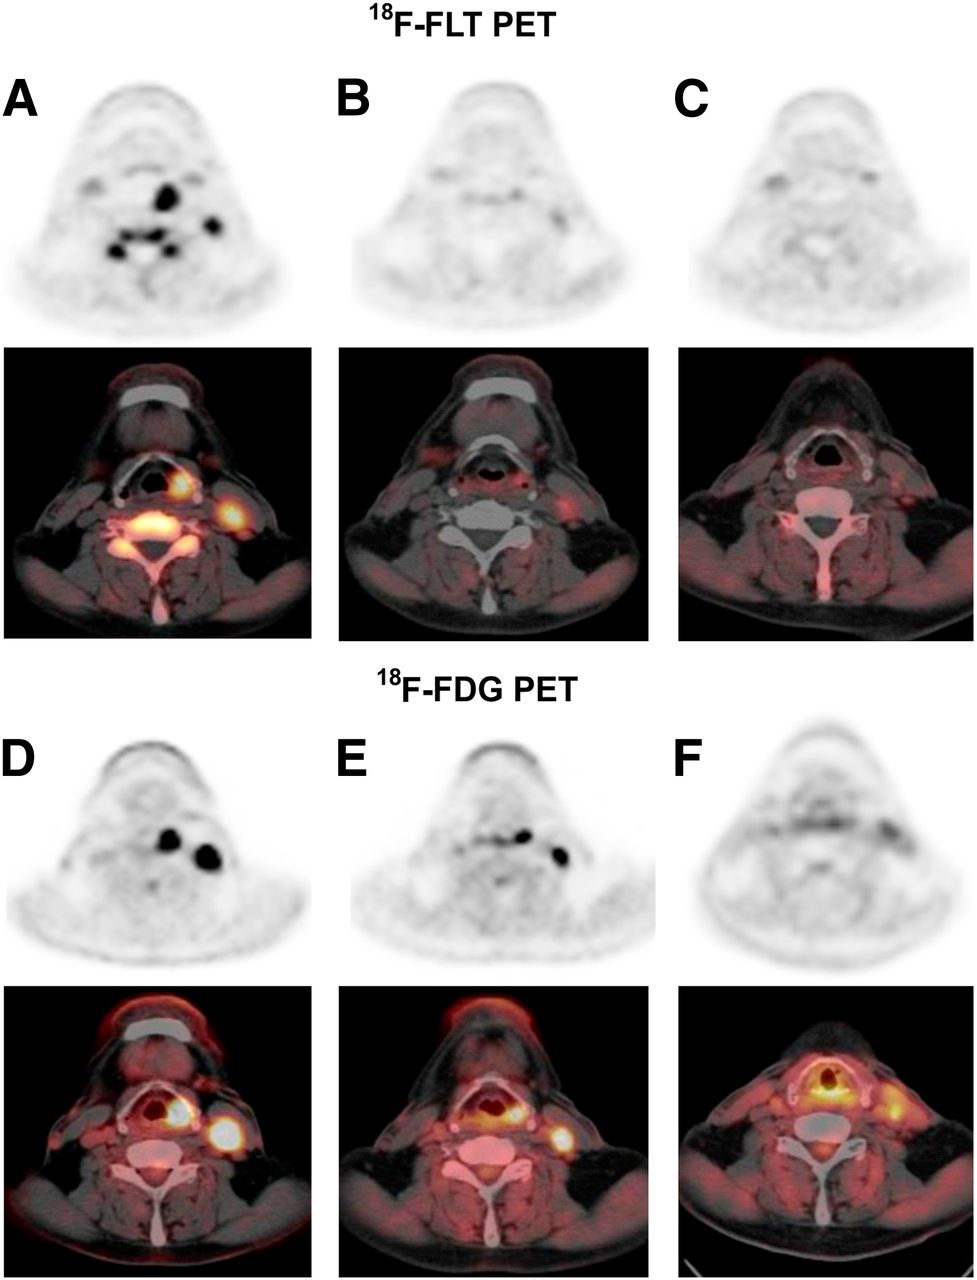
PET images of patient with hypopharyngeal cancer (patient 14) before radiation therapy (A and D), 3 wk after initiation of radiation therapy (B and E), and 4 wk after end of radiation therapy (C and F). Pretreatment 18F-FLT and 18F-FDG axial PET images showed increased metabolism in primary tumor and metastatic lymph node (18F-FLT SUVs, 9.16 and 6.06, respectively; 18F-FDG SUVs, 21.81 and 13.37, respectively). 18F-FLT and 18F-FDG SUVs decreased after 30 Gy of irradiation (18F-FLT SUVs, 2.86 and 2.14, respectively; 18F-FDG SUVs, 11.44 and 6.39, respectively). 18F-FLT uptake in primary site and lymph nodes was same as in surrounding muscle (SUVs of 0.93, 0.9, and 0.9, respectively) at 4 wk after completion of treatment, whereas increased uptake of 18F-FDG persisted (SUV of 4.66 in primary lesion and 3.75 in lymph node). Patient was alive and without evidence of recurrent disease 19 mo after therapy. (Reprinted from (66).)
LUNG CANCER
Lung cancer has been the most studied malignancy using 18F-FLT PET. In a cohort of 25 suspected lung cancer patients, 18F-FLT PET images were performed before surgical resection and compared with expression of Ki-67 and TK1 determined by immunohistochemical staining (67). TK1 enzymatic activity was also determined in extracts from flash-frozen samples of the tumors. Static 18F-FLT SUVmax uptake from 60 to 90 min correlated with the overall (ρ = 0.57, P = 0.006) and maximal (ρ = 0.69, P < 0.001) immunohistochemical expressions of Ki-67 and TK1 but not with TK1 enzymatic activity (ρ = 0.34, P = 0.146). Correlation between TK1 activity and TK1 protein expression was limited to immunohistochemistry scoring for maximal expression. Other studies, as described below, have also demonstrated reasonable correlations between 18F-FLT uptake and Ki-67.
In another study, 18 patients with newly diagnosed non–small cell lung cancer were imaged with both 18F-FLT PET and 18F-FDG PET at 60 min after injection with sensitivities of 72% and 89%, respectively (68). Four of the 5 false-negative 18F-FLT PET findings occurred in bronchoalveolar carcinoma, as may be attributed to slower growth and differences in the kinetics and dynamics of 18F-FLT in these tumors. Similar results in another study on 68 patients with non–small cell lung cancer showed SUVmax to be significantly correlated with the Ki-67 (r = 0.550 and 0.633, P = 0.000 and 0.000, respectively) (69). There was also some correlation with CD31-MVD and CD34-MVD (angiogenesis markers) (r = 0.228 and 0.235, P = 0.062 and 0.054, respectively). These data suggest that 18F-FLT uptake is influenced by a host of other factors including angiogenesis.
Like other cancers, uptake of 18F-FLT in lung cancers is significantly lower than that of 18F-FDG, with lower sensitivity, higher specificity, and higher positive predictive value (68,70–72). However, the correlation with proliferation is partially shown in response to treatment. The association with progression-free survival and 18F-FLT uptake was shown in patients treated with erlotinib (73). In 30 patients with stage IV non–small cell lung cancer imaged before, 1 wk, and 6 wk after the start of erlotinib treatment, 18F-FLT and 18F-FDG PET imaging was done. A cutoff value of a 20% or 30% decrease in 18F-FLT uptake was used to define metabolic response. Patients with lower early and late residual tumor glycolysis (18F-FDG uptake) and proliferation (18F-FLT uptake) had a significantly prolonged progression-free survival. In another study of 34 patients, the changes in 18F-FDG and 18F-FLT uptake after 1 and 6 wk of erlotinib treatment were compared with nonprogression measured by CT after 6 wk of treatment (74). Early 18F-FLT response predicted longer progression-free survival (hazard ratio, 0.31; 95% confidence interval, 0.10–0.95; P = 0.04) but not overall survival and could not predict nonprogression after 6 wk of therapy. Decreased 18F-FLT uptake was observed in tumors sensitive to erlotinib combined with Bcl-x inhibitor in preclinical studies (75). Changes in 18F-FLT retention have been seen in lung cancer soon after the start of chemotherapy and radiation therapy (76) and have led to testing pharmacokinetic parameters in lung tumors. A compartmental model analysis performed on 18 tumors in 17 patients found overall flux constants K (18F-FLT) highly correlated with Ki-67 (ρ = 0.92, P < 0.001) (77). This study concluded that the 4-parameter model is better than the 3-parameter model, thus allowing for dephosphorylation. However, this model requires at least 90 min of imaging. In an early study by Buck et al., 26 patients with lung cancer were imaged with 18F-FDG and 18F-FLT. SUV was compared with proliferation measured by Ki-67. Uptake of 18F-FLT was noticeably lower than that of 18F-FDG (mean, 1.8 vs. 4.1, respectively). However, 18F-FLT correlated better with proliferation index than 18F-FDG (P < 0.001; r = 0.92, vs. P < 0.001; r = 0.59, respectively). This study demonstrated that 18F-FLT uptake correlated better with proliferation in lung tumors as measured by Ki-67 (Fig. 6) (78).

Patient 5, with non–small cell lung cancer in left upper lobe. (A) Transaxial 18F-FLT PET scan demonstrates high 18F-FLT uptake (arrow) in tumor margin. 18F-FLT uptake in vertebral column, scapula, and ribs represents proliferating bone marrow. (B and C) Corresponding CT and 18F-FDG PET scans show high 18F-FDG uptake in tumor margin and primary lung tumor. (D) On Ki-67 immunohistochemistry, Ki-67–positive nuclei (brown) demonstrate high proliferation rate of 54%, and hematoxylin background staining reveals Ki-67–negative nuclei (blue). (Reprinted from (78).)
SKIN CANCERS
Among skin cancers, melanoma is the most prevalent aggressive type, and most clinical studies are limited to staging and treatment evaluation of this type of cancer. A study of 10 patients with stage III melanoma based on physical examination demonstrated that all locoregional metastases were correctly visualized by 18F-FLT PET. The detection limit for lymph node metastases was 6 mm or a mitotic rate of 9 mitoses per 2 mm2 (79). Adding 18F-FLT PET to CT has added to the sensitivity but has decreased the specificity because of false-positive results. Interestingly, in an attempt to develop a method for the direct assessment of immune responses, patients were imaged with 18F-FLT PET before and after they received dendritic cell vaccine therapy (80). The level of tracer uptake in nearby nodes correlated to the level of circulating antigen-specific IgG antibodies and antigen-specific proliferation of T cells in peripheral blood. The authors concluded that 18F-FLT PET has been able to detect immune system activation after melanoma vaccination. The use of 18F-FLT PET to detect activation was also demonstrated in a study of CTLA4 inhibition (81). Significant increases in the uptake of 18F-FLT was seen in tumor-free spleen after treatment with tremelimumab in 12 patients with advanced melanoma, suggesting activation of immune response in the healthy tissue.
DISCUSSION
We are in an era of targeted therapy and molecular imaging. Using proliferation-specific tracers may help better identify an unknown lesion and help us predict response to the treatment. As 18F-FLT finds more applications in proliferation imaging, its benefits and limitations will be better known. Currently available data have shown application of this agent in solid tumors and bone marrow activity. Major limitations have been in areas with high uptake in the normal background, such as in the genitourinary and hepatobiliary systems. Because of the generally lower uptake of 18F-FLT than of 18F-FDG in most solid tumors, 18F-FLT is not expected to replace 18F-FDG for detection and staging purposes, except for certain lesions. Studies performed with 18F-FLT suggest that part of the varying results among studies can be due to different imaging techniques and to a lack of standardized methods.
It is noticeable that not all tumors with high proliferation have high uptake of 18F-FLT. Although different tissue-processing methods used for comparison might play a role, probably there are some biologic aspects of this phenomenon. Although tumor imaging using 18F-FLT has been done with the intention of evaluating proliferation, the exact mechanism of tumor uptake depends on multiple factors just as it does for 18F-FDG. The type of cancer, time of imaging, and type of treatment all may affect 18F-FLT uptake in different ways. As an example, the effect of a microtubule stabilizer on 18F-FLT uptake in a murine model of fibrosarcoma showed excellent results (82); another study concluded that p53 null cancers might behave differently (83).
These different mechanisms are especially important in the era of new targeted therapies, where a specific pathway is targeted to control certain mechanisms. Studies have already compared 18F-FLT with other modalities. In these cases, close attention should be paid to whether the pathway affects nucleoside transport or metabolism. These may directly affect 18F-FLT uptake regardless of the proliferation.
The evaluation of residual disease is also important as treatment becomes more successful. Although 18F-FDG was found to be more sensitive than 18F-FLT PET in finding residual disease in lymphoma patients, both tracers were able to discriminate patients with different survivals. Nevertheless, the uptake will rely on the interpersonal difference in kinetics and dynamics of 18F-FLT in tumor cells and the effect of medications on both. Single uptake measurements versus uptake before and after treatment, and single-parameter versus combined-kinetic-parameter measurements, can be used to determine tumor viability and proliferation (37,82).
Another main player is the difference in the nature of the tissues; there are natural barriers and different transporters in neoplasms. Some tumors have high rates of proliferation, and others appear to be driven by decreased apoptosis. Even cells of the same tumors are heterogeneous, making generalized statements less accurate. Standardized methods of imaging will help overcome some of the technical problems in comparing different studies, but other aspects of pharmacokinetics and dynamics should always be considered in the final evaluations.
CONCLUSION
Imaging tumor proliferation with labeled pyrimidine analogs, such as 18F-FLT PET, offers a new approach to assessing tumor growth kinetics. Several studies have demonstrated that 18F-FLT can detect cancers, but so far it does not appear likely to replace 18F-FDG for this use with most tumor types. The ability of 18F-FLT imaging to provide an early measure of treatment response has been demonstrated in several preclinical and clinical studies with a variety of tumor types. This approach requires further validation to find routine clinical use.
Footnotes
Published online May 14, 2013.
Learning Objectives: On successful completion of this activity, participants should be able to discuss (1) the radiopharmaceuticals used to evaluate cell proliferation; (2) the normal biodistribution of these radiopharmaceuticals; and (3) the role of these radiopharmaceuticals in the evaluation of malignancies.
Financial Disclosure: This work was partially supported by grant CA22453 from the National Cancer Institute and by U.S. Department of Defense Award W81XWH-10-2-0068. The authors of this article have indicated no other relevant relationships that could be perceived as a real or apparent conflict of interest.
CME Credit: SNMMI is accredited by the Accreditation Council for Continuing Medical Education (ACCME) to sponsor continuing education for physicians. SNMMI designates each JNM continuing education article for a maximum of 2.0 AMA PRA Category 1 Credits. Physicians should claim only credit commensurate with the extent of their participation in the activity. For CE credit, participants can access this activity through the SNMMI Web site (http://www.snmmi.org/ce_online) through June 2016.
- © 2013 by the Society of Nuclear Medicine and Molecular Imaging, Inc.
REFERENCES
- 1.↵
- 2.↵
- 3.↵
- 4.↵
- 5.↵
- 6.↵
- 7.↵
- 8.↵
- 9.↵
- 10.↵
- 11.↵
- 12.↵
- 13.↵
- 14.↵
- 15.↵
- 16.
- 17.↵
- 18.↵
- 19.↵
- 20.↵
- 21.↵
- 22.↵
- 23.↵
- 24.↵
- 25.↵
- 26.↵
- 27.↵
- 28.↵
- 29.↵
- 30.↵
- 31.↵
- 32.↵
- 33.↵
- 34.↵
- 35.↵
- 36.↵
- 37.↵
- 38.↵
- 39.↵
- 40.↵
- 41.↵
- 42.↵
- 43.↵
- 44.↵
- 45.↵
- 46.↵
- 47.↵
- 48.↵
- 49.↵
- 50.↵
- 51.↵
- 52.↵
- 53.↵
- 54.↵
- 55.↵
- 56.↵
- 57.↵
- 58.↵
- 59.↵
- 60.↵
- 61.↵
- 62.↵
- 63.↵
- 64.↵
- 65.↵
- 66.↵
- 67.↵
- 68.↵
- 69.↵
- 70.↵
- 71.
- 72.↵
- 73.↵
- 74.↵
- 75.↵
- 76.↵
- 77.↵
- 78.↵
- 79.↵
- 80.↵
- 81.↵
- 82.↵
- 83.↵
- Received for publication March 13, 2013.
- Accepted for publication May 2, 2013.


Jump to section
Related Articles
Cited By...
- 18F-FLT PET/CT Adds Value to 18F-FDG PET/CT for Diagnosing Relapse After Definitive Radiotherapy in Patients with Lung Cancer: Results of a Prospective Clinical Trial
- Using Radiolabeled 3'-Deoxy-3'-18F-Fluorothymidine with PET to Monitor the Effect of Dexamethasone on Non-Small Cell Lung Cancer
- Sex as a Biologic Variable in Preclinical Imaging Research: Initial Observations with 18F-FLT
- Differential diagnosis of granulomatous lung disease: clues and pitfalls: Number 4 in the Series "Pathology for the clinician" Edited by Peter Dorfmüller and Alberto Cavazza
- Preclinical Evidence That 3'-Deoxy-3'-[18F]Fluorothymidine PET Can Visualize Recovery of Hematopoiesis after Gemcitabine Chemotherapy
- Prognostic Value of 18F-FLT PET in Patients with Neuroendocrine Neoplasms: A Prospective Head-to-Head Comparison with 18F-FDG PET and Ki-67 in 100 Patients
- PET of Glucose Metabolism and Cellular Proliferation in Prostate Cancer
- 18F-FLT PET/CT in the Evaluation of Pheochromocytomas and Paragangliomas: A Pilot Study
- 18F-FLT PET Evaluation of Radiation Response
- VEGF-Targeted Therapy Stably Modulates the Glycolytic Phenotype of Tumor Cells