


Abstract
The aim of this study was to evaluate, whether PET with 18F-FDG and 3′-deoxy-3′-18F-fluorothymidine (18F-FLT) may be used to monitor noninvasively the antiproliferative effects of tyrosine kinase inhibitors. Methods: Using a high-resolution small animal scanner, we measured the effect of the ErbB-selective kinase inhibitor PKI-166 on the 18F-FDG and 18F-FLT uptake of ErbB1-overexpressing A431 xenograft tumors. Results: Treatment with PKI-166 markedly lowered tumor 18F-FLT uptake within 48 h of drug exposure; within 1 wk 18F-FLT uptake decreased by 79%. 18F-FLT uptake by the xenografts significantly correlated with the tumor proliferation index as determined by proliferating cell nuclear antigen staining (r = 0.71). Changes in 18F-FLT uptake did not reflect inhibition of ErbB kinase activity itself but, rathe, the effects of kinase inhibition on tumor cell proliferation. Tumor 18F-FDG uptake generally paralleled the changes seen for 18F-FLT. However, the baseline signal was significantly lower than that for 18F-FLT. Conclusion: These results indicate that 18F-FLT PET provides noninvasive, quantitative, and repeatable measurements of tumor cell proliferation during treatment with ErbB kinase inhibitors and provide a rationale for the use this technology in clinical trials of kinase inhibitors.
Landmark trials with the kinase inhibitors imatinib (1) and trastuzumab (2) for chronic myeloid leukemia and advanced breast cancer, respectively, have established kinases as valid therapeutic targets in cancer. Encouraged by this success, a large number of compounds targeting other tyrosine and serine/threonine kinases have been designed and are awaiting further testing in clinical trials (3). The effects of these compounds on nonhematologic malignancies are often cytostatic and underestimated by radiographic response criteria developed to measure tumor shrinkage after cytotoxic chemotherapy. Measurements of tumor size are therefore increasingly supplemented by imaging of physiologic functions using PET (4).
The glucose analog 18F-FDG is currently by far the most commonly used PET tracer in oncology. Although 18F-FDG PET is now mainly used for tumor staging, the amount of tumor 18F-FDG uptake also provides quantitative information on tumor glucose use. Changes in 18F-FDG uptake during chemotherapy have been shown to be predictive for patient outcome (5). Furthermore, treatment of gastrointestinal stromal tumors with imatinib has been shown to result in a dramatic decrease in tumor 18F-FDG uptake within 24 h after the first administration of this c-kit inhibitor (6). In addition to 18F-FDG PET, noninvasive approaches to image DNA synthesis have been developed recently using tracers that are substrates of the DNA synthetic pathway, such as 3′-deoxy-3′-18F-fluorothymidine (18F-FLT) (7). Cellular uptake of 18F-FLT is determined by the activity of the thymidine salvage pathway. In this pathway extracellular thymidine is transported across the cell membrane by nucleoside transporters, phosphorylated to thymidine triphosphate, and then incorporated into the DNA. 18F-FLT is transported across the cell membrane in a similar way as thymidine and phosphorylated by thymidine kinase 1 (TK1) to 18F-FLT monophosphate. However, during the duration of imaging, only minimal amounts of 18F-FLT are incorporated in the DNA. Nevertheless, 18F-FLT remains trapped intracellularly because the polar 18F-FLT phosphate cannot cross the cell membrane. Although most 18F-FLT is not incorporated into DNA, it is still a marker of cellular proliferation because generally TK1 activity is closely cell cycle regulated (8). Several preclinical and clinical studies have shown that 18F-FLT uptake correlates with tumor cell proliferation as assessed by histologic analysis (9–13). Furthermore, studies in cell cultures and animal models have indicated that 18F-FLT uptake is mainly determined by TK1 activity (12,14–16).
Studies in several cancer cell lines and selected cancer patients have shown a close relationship between 18F-FLT retention and conventional measures of DNA synthesis or cell proliferation (9,13,14,17). In addition, the initial animal experiments indicated that changes in 18F-FLT uptake may be an even more sensitive parameter for assessment of tumor response than changes in 18F-FDG uptake (12). Conceptually, 18F-FLT PET seems to be more appropriate than 18F-FDG PET to study the effects of signal transduction inhibitors, whose main mechanism of action is inhibition of tumor cell proliferation and not cytotoxicity.
In the present study, we examined the changes in 18F-FDG and 18F-FLT uptake during treatment of human A431 xenograft tumors with an ErbB-selective kinase inhibitor. A431 human epidermoid cancer cells were chosen as the tumor model system because they overexpress the epidermal growth factor receptor (EGFR or ErbB1) and are particularly sensitive to pharmacologic inhibitors of the ErbB1 receptor tyrosine kinase (18).
MATERIALS AND METHODS
Tumor Model
The human epidermoid carcinoma cell line A431 was acquired from the American Type Culture Collection and cultivated in Dulbecco’s modification of Eagle’s medium supplemented with 10% fetal bovine serum. Severe combined immunodeficient (Scid/Scid) mice were obtained from the Division of Laboratory Animal Medicine at the University of California at Los Angeles (UCLA) and maintained in a laminar flow tower in a defined flora colony. All animal manipulations were performed with sterile technique following the guidelines of the UCLA Animal Research Committee. Cells growing exponentially in vitro were trypsinized, resuspended in phosphate-buffered saline and Matrigel (Collaborative Research), and injected subcutaneously into the right shoulder area of SCID mice (∼106 cells per mouse). After tumors had grown to an approximate size of 100 mm3, mice were randomized to treatment versus control groups.
microPET
Synthesis and quality control of 18F-FDG was performed by using standard methods (19). 18F-FLT was synthesized by modifying literature procedures (20,21). Briefly, no-carrier-added 18F-fluoride ion was produced by 11-MeV proton bombardment of 95% 18O-enriched water via 18O(p,n) 18F nuclear reaction. This aqueous 18F-fluoride ion (∼18.5 GBq) was treated with potassium carbonate and Kryptofix 2.2.2. (Merck). Water was evaporated by azeotropic distillation with acetonitrile. The dried K18F/Kryptofix residue thus obtained was reacted with the precursor of 18F-FLT (5′-O-[4,4′-dimethoxytrityl]-2,3′-anhydrothymidine) and then hydrolyzed with dilute HCl. The crude 18F-labeled product was purified by semipreparative high-performance liquid chromatography (HPLC) (Phenomenex Aqua column; 25 × 1 cm; 10% ethanol in water; flow rate, 5.0 mL/min) to give chemically and radiochemically pure 18F-FLT in 555–1,110 MBq (6%–12% radiochemical yield, decay corrected) amounts per batch. The chemical and radiochemical purities of the product isolated from the semipreparative HPLC system was confirmed by an analytic HPLC method (Phenomenex Luna C18 column; 25 cm × 4.1 mm; 10% ethanol in water; flow rate, 2.0 mL/min; 287-nm ultraviolet and radioactivity detection; specific activity, ∼74 TBq/mmol) and found to be >99%. The product was made isotonic with sodium chloride and sterilized by passing it through a 0.22-μm Millipore filter into a sterile multidose vial.
PET scans were performed using the microPET Primate 4-ring system (P4; Concorde Microsystems) as described previously (22). For PET, mice were anesthetized with intraperitoneal injection of sodium phenobarbital (30–70 mg/kg). 18F-FDG and 18F-FLT, each at a dose of 7.4 MBq in 100 μL saline, were then injected in the lateral tail vein. To study the time course of 18F-FLT accumulation in the selected tumor model, 3 tumor-bearing mice first underwent a dynamic PET scan over a period of 1 h. In the treatment trial, mice were imaged for 15 min, 60 min after injection of 18F-FDG or 18F-FLT. Two days before initiation of therapy, the mice were studied with 18F-FDG and 1 d later with 18F-FLT. The 18F-FDG and 18F-FLT scans were repeated weekly (on days 7 or 8, 14 or 15, and 21 or 22) or until a critical tumor size (1.5 cm) was reached. For image reconstruction, list-mode data were first sorted into 3-dimensional sinograms, followed by Fourier rebinning and 2-dimensional filtered backprojection reconstruction using a ramp filter with one half of the Nyquist frequency as the cutoff frequency. The reconstructed spatial image resolution is ∼2.2 mm.
Treatment with PKI-166
The ErbB1/ErbB2 receptor tyrosine kinase inhibitor (RTK) PKI-166 (4-(R)-phenethylamino-6-[hydroxyl]phenyl-7H-pyrrolo[2.3-d]pyrimidine) was obtained from Novartis Pharma AG and administered daily by gavage. A group of 6 mice was treated with daily doses of 100 mg/kg PKI-166 for a total of 3 wk and imaged weekly with 18F-FLT and 18F-FDG as described. This dose has been defined previously as the minimal drug dose required to inhibit ErbB1 autophosphorylation and activation of downstream signaling pathways in A431 (23). Six mice treated daily with vehicle only served as the control group. To correlate the early changes in tumor 18F-FLT uptake with the inhibition of the EGF signaling pathway, 8 mice bearing A431 xenograft tumors were treated with a single dose of PKI-166 (100 mg/kg) and imaged at various time points after drug administration (6–48 h, 2 mice per time point). To assess ErbB1 RTK inhibition by PKI-166, mice were injected intraperitoneally with EGF immediately after the 18F-FLT PET scan. Tumors were harvested 5 min later and subjected to immunoblotting for activated extracellular signal-regulated kinase (ERK), a known effector kinase of ErbB1 RTK signaling (24).
Immunohistochemistry and Immunoblotting
For immunostaining of proliferating cell nuclear antigen (PCNA), we used a rabbit polyclonal antibody (sc-7907; Santa Cruz Biotechnology). Unmasking was performed in a pressure cooker with 0.1 mol/L citrate buffer, pH 6, for 10 min. Donkey antirabbit (Jackson Laboratories) was used as a secondary antibody. Development was done with DAB (diaminobenzidine) Substrate Kit for Peroxidase (SK 4100; Vector). Sections were then counterstained with hematoxylin and mounted routinely. Quantification of the number of PCNA-positive cells was performed with computer-assisted morphometry with image analysis software (Optimas 5.1; Bioscan). On average, 15 high-power fields were counted per cross section and expressed as the average from 3 sections per tumor. Immunoblotting was performed as previously reported (23) using monoclonal antibodies against TK1, pERK (phosphorylated ERK), and actin (Abcam). The optical density of the bands in the immunoblots was quantified using laser densitometry and expressed relative to the optical density of the actin band (ImageQuant TL; Amersham Biosciences).
Data Analysis
For image analysis, regions of interest (ROIs) were manually placed around the tumor and the mediastinal blood pool on transaxial images. The tumor ROI was defined in the slice with the maximum tracer uptake; the mediastinal ROI was placed in the slice with the largest cross-sectional area of the mediastinal blood pool. Tracer uptake by the tumors was expressed as the ratio between the maximum intratumoral and mean mediastinal counts/pixel. The mediastinum was selected as the background region, because it provides an estimate of the tumor-to-blood ratio (T/B ratio), a parameter frequently used to quantify the degree of tracer accumulation in a tumor tissue. We preferred this approach over the determination of standardized uptake values, because repeated tail vein injections can result in substantial interstitial tracer accumulation. All quantitative values are reported as mean ± SEM. ANOVA was used to compare tracer uptake before and after treatment. Correlations between pathology and image findings were tested using linear regression analysis. P < 0.05 was considered significant.
RESULTS
18F-FLT and 18F-FDG Uptake by Treated and Untreated A431 Tumors
The dynamic 18F-FLT PET studies showed a continuous accumulation of radioactivity in the tumor tissue over a period of 60 min, confirming the intracellular trapping of 18F-FLT in this tumor model (Fig. 1A). Within 1 wk of treatment, PKI-166 dramatically reduced the tumor-to-mediastinum uptake ratios (T/M uptake ratios) from 9.5 ± 1.0 to 2.0 ± 0.6 (−79%, P = 0.001 for comparison of baseline and follow-up scan; Figs. 1B and 1C). From there on, 18F-FLT uptake in the treated tumors remained during the following 2 wk of therapy (Figs. 1B and 1C). 18F-FDG T/M uptake ratios also significantly declined within 1 wk of therapy (P = 0.0051). However, baseline 18F-FDG uptake was already very low in this tumor model (0.8 ± 0.04; Figs. 1B and 1C). The decrease in tracer uptake was not due to tumor shrinkage because the size of PKI-166-treated tumors did not change during the course of the experiment (Fig. 1C). The size of the untreated tumors increased by a factor of 2.1 during the duration of the study.

18F-FLT and 18F-FDG uptake of subcutaneous A431 xenografts in SCID mice treated with ErbB-selective kinase inhibitor PKI-166. (A) Representative time course of 18F-FLT uptake in A431 tumors and in mediastinum for untreated mouse. (B) Representative microPET images of mouse treated daily with vehicle or PKI-166 for 3 wk. Red arrows indicate location of subcutaneous A431 tumor. White arrows indicate metabolically active brown fat in 18F-FDG studies. (C) 18F-FLT (left) and 18F-FDG (middle) tumor/mediastinum uptake ratios (mean ± SEM) in cohort of mice (n = 4 per group) imaged weekly for duration of 3 wk (2 mice in control and treatment group had to be sacrificed during course of the experiment). Tumor volumes (right) were determined with calipers and are expressed as fold change compared with beginning of treatment. (D) Temporal relationship between kinase inhibition and inhibition of 18F-FLT uptake in A431 tumors. 18F-FLT microPET scans were performed 6, 24, and 48 h after single dose of PKI-166. EGF was injected intraperitoneally immediately after acquisition of PET images, and tumors were harvested 5 min later. Tumor lysates were subjected to NaDodSO4/polyacrylamide gel electrophoresis and immunoblotting with antibodies against activated ERK (p-ERK) and actin (loading control). IB = immunoblot.
The counting rates in the mediastinal reference region did not show a significant change during treatment with PKI-166. For 18F-FLT, the mediastinal counting rates per injected amount of radioactivity before and after 1 wk of therapy were 7.8 ± 3.8 × 10⁻⁵ counts/pixel/s/Bq and 9.7 ± 7.8 × 10⁻⁵ counts/pixel/s/Bq, respectively (P = 0.58). The corresponding values for 18F-FDG were 21.4 ± 3.5 × 10⁻⁵ counts/pixel/s/Bq and 2.7 ± 9.7 × 10⁻⁵ counts/pixel/s/Bq, respectively (P = 0.19). Thus, the decrease in the T/M uptake ratio during therapy with PKI-166 cannot be explained by changes in the mediastinal background activity.
Compared with vehicle-treated controls, PKI-166 treatment markedly blunted the EGF-induced activation of ERK within 6 h of drug treatment (Fig. 1D). EGF-induced ERK phosphorylation decreased by 41% and 48% at 6 and 24 h, respectively, after a single dose of PKI-166. The mean 18F-FLT uptake by A431 tumors, on the other hand, did not decrease until 48 h after PKI-166 treatment, a time point when ErbB kinase signaling had already been restored (Fig. 1D).
18F-FLT Uptake Correlates with Tumor Cell Proliferation
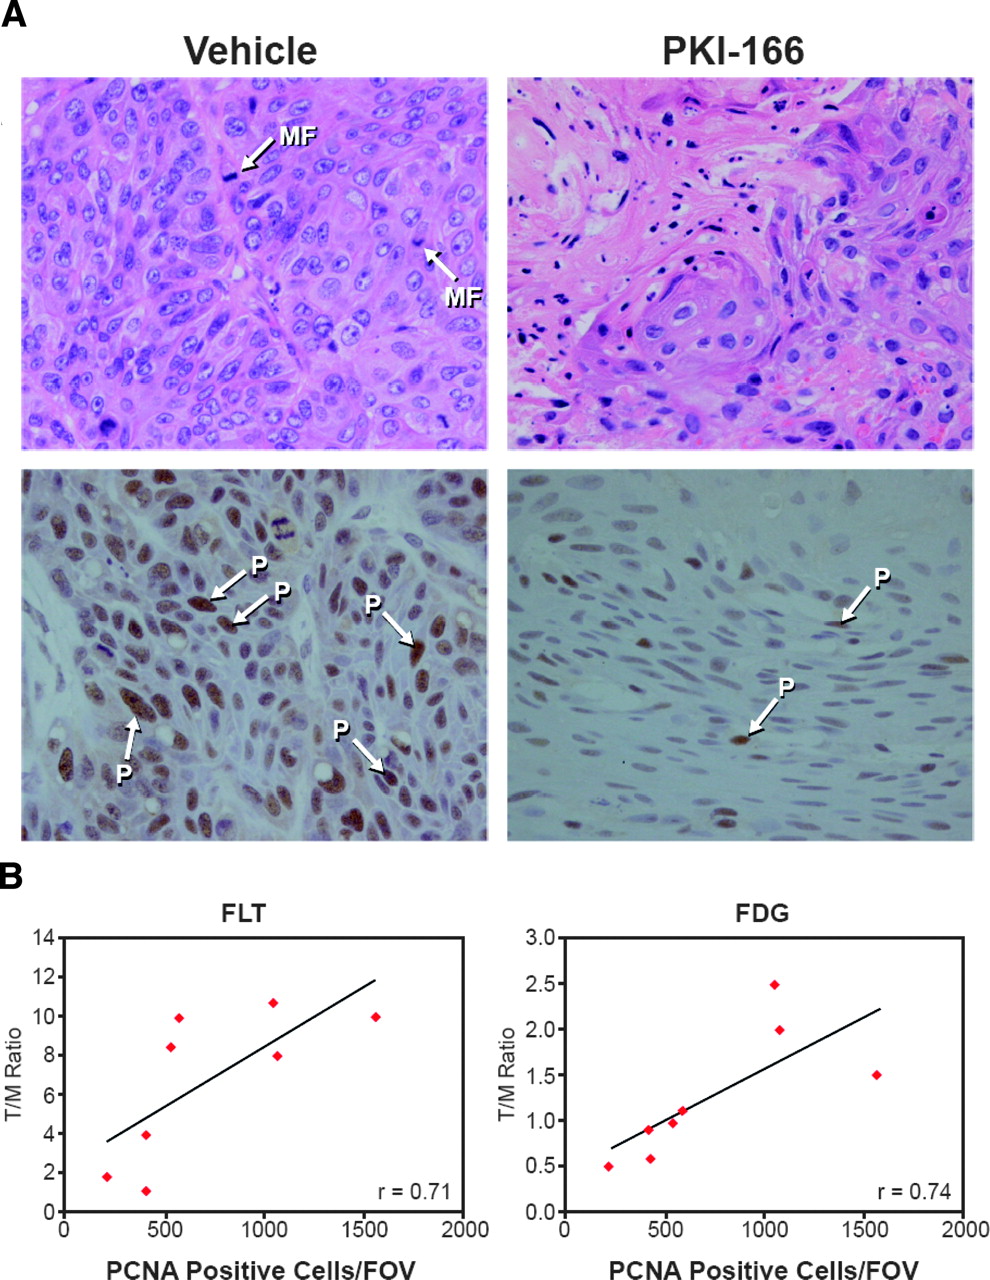
Compared with the vehicle control, PKI-166-treated tumors showed fewer mitotic figures on hematoxylin-eosin staining (Fig. 2A, top). PCNA immunostaining was markedly reduced in PKI-166-treated tumors (P = 0.018, Fig. 2A, bottom). PCNA expression of the treated and untreated tumors correlated well with the mean T/M 18F-FLT uptake ratios (Fig. 2B).

18F-FLT uptake by A431 tumors correlates with number of PCNA-positive cells. (A) Top: Hematoxylin-eosin staining of A431 tumors treated with vehicle or PKI-166 for 1 wk. MF = mitotic figure. Bottom: PCNA staining of same tumors as in top row. PCNA-positive cells (P) stain brown and are indicated by arrows. (B) Correlation between mean 18F-FLT and 18F-FDG T/M uptake ratios and PCNA labeling index (positive labeled cells per field of view). Tumors were treated with vehicle or PKI-166 for 1 wk and harvested for histologic examination and morphometry immediately after PET image acquisition.
DISCUSSION
This study indicates that 18F-FLT PET can be used to monitor the antiproliferative effects of ErbB inhibitors early in the course of therapy. Treatment with the ErbB1/ErbB2 inhibitor PKI-166 decreased tumor 18F-FLT uptake decreased by 79% during the first week of therapy. The decrease in tracer uptake was not due to tumor shrinkage because the size of PKI-166-treated tumors did not change during the course of the experiment. In contrast, the tumor size of untreated tumors increased 2.5-fold during the same time. Importantly, tumor 18F-FLT uptake by the tumor tissue correlated with a histologic evaluation of cellular proliferation by PCNA staining, confirming that 18F-FLT PET allows one to assess the antiproliferative effects of ErbB kinase inhibition. Taken together, this study demonstrates the ability of microPET imaging with 18F-FLT for the preclinical evaluation of protein kinase inhibitors, which are currently the most promising form of targeted therapy for common solid tumors. Furthermore, our data suggest that 18F-FLT PET may become a very valuable test to determine clinically the effectiveness of ErbB kinase inhibitors. Anatomic imaging techniques and conventional response criteria cannot assess the antiproliferative response to protein kinase inhibitors, and there is a great need for new techniques that identify responding patients early in the course of therapy.
18F-FDG is the tracer most widely used for PET in oncology and has been used to document responses to the kinase inhibitor imatinib (6). Interestingly, certain oncogenic kinases have been shown to directly regulate key aspects of glucose metabolism, such as glucose transport and glycolysis (25). Glucose is required for the de novo synthesis of ribose needed for DNA and RNA synthesis. Furthermore, it has been shown that many growth factors, including EGF, change cellular proliferation and deoxyglucose uptake in parallel (26,27).
However, in our tumor model the baseline 18F-FDG signal was low. Furthermore, variable 18F-FDG uptake in the myocardium may have influenced the T/M uptake ratios used to assess tumor 18F-FDG uptake. Thus, changes in tumor 18F-FDG uptake were more difficult to quantify than changes in 18F-FLT uptake and we focused our further studies on 18F-FLT uptake. It should be noted, however, that the correlations between 18F-FDG tumor uptake and PCNA positivity (r = 0.74) were very similar to those between 18F-FLT uptake and PCNA staining (r = 0.71). Thus, 18F-FDG uptake may also serve as a readout for the inhibition of EGFR tyrosine kinases, especially in tumor models with higher baseline 18F-FDG uptake.
Given the results of previous studies comparing 18F-FDG and 18F-FLT PET for assessment of tumor cell proliferation (28), it seems unexpected that 18F-FDG uptake demonstrated a correlation with tumor cell proliferation similar to that of 18F-FLT uptake. However, it is important to note that we studied 1 tumor cell line with and without treatment. Therefore, the range of PCNA staining found in our study mainly reflects therapy-induced changes of tumor cell proliferation. Several studies have indicated that stimulation of cellular proliferation by EGF is paralleled by an increase in glucose uptake (26,27). In contrast, previous studies have determined 18F-FDG uptake and proliferation in different untreated tumors. Because cellular proliferation is only one factor that affects tumor 18F-FDG uptake, it is not surprising that these studies generally found a weaker correlation between tumor cell proliferation and 18F-FDG uptake.
The decrease in 18F-FLT uptake after treatment with PKI-166 was delayed for about 48 h compared with the almost immediate inhibition of ErbB kinase activity. This finding indicates that 18F-FLT uptake by A431 tumors does not reflect ErbB kinase activity itself but, rather, the effects of the ErbB signaling pathway on tumor cell proliferation. This is an important observation because, in tumors that are not dependent on the activity of the EGF signaling pathway, PKI-166 may efficiently block ERK phosphorylation, but not affect tumor growth (29). Therefore, it may be advantageous for the clinical application that the FLT signal is not directly linked to the ErbB signaling pathway but changes only indirectly as a consequence of decreased tumor cell proliferation. Activation of growth factor receptors, such as the ErbB receptors, generally triggers a large cascade of intracellular signals. The first steps are the activation of other signaling molecules, such as ras, raf, and ERK. Activated (phosphorylated) ERK then translocates to the nucleus, where it regulates transcription factors by phosphorylation. This leads to the transcriptional induction of a family of ∼100 genes called immediate-early genes. Many immediate-early genes themselves encode transcription factors, so their induction in response to ERK phosphorylation leads to altered expression of a battery of other downstream genes, thereby establishing new programs of gene expression that ultimately cause the cell to proliferate and enter into S phase (30). Accordingly, inhibition of ErbB signaling has early effects, such as inhibition of ERK phosphorylation, and more delayed effects, such as inhibition of cellular proliferation. Therefore, it is not surprising that it also takes time before inhibition of ErbB signaling by PKI-166 leads to a decrease in cellular proliferation and 18F-FLT uptake. Our data indicate that changes in 18F-FLT uptake occur as a consequence of these later events.
Semiquantitative estimates of tumor glucose utilization and proliferation rather than true quantitative values were used for several reasons: (a) while providing scatter correction and normalization, the current version of the P4 microPET system does not allow for attenuation correction; (b) because of the frequency of serial microPET measurements, partially paravenous injections cannot be fully avoided; and (c) our focus on drug-induced changes in the PET signal, rather than the absolute PET signal intensity, justified the use of a consistent, if semiquantitive, data acquisition approach. Two studies in patients have indicated that static measurements of 18F-FLT uptake 60 min after injection are well correlated with 18F-FLT flux (Ki) (9,31). Furthermore, 3 studies in animal models have indicated that static measurements of 18F-FLT uptake may be used to assess tumor response to chemo- and hormonotherapy (12,32,33). Finally, the dynamic PET scans performed in this study demonstrate that the radioactivity concentration in the A431 tumors increases for up to 60 min after injection, whereas the radioactivity concentration in the mediastinum (which approximates the concentration of 18F-FLT in the blood) decreases continuously. Furthermore, the mean T/M uptake ratio was >9 at 60 min after injection. It is evident from these data that (a) the T/M uptake ratio 60 min after injection reflects the trapping of 18F-FLT by the tumor tissue (i.e., 18F-FLT phosphorylation) and (b) the intratumoral blood volume and vascular permeability only minimally contribute to the 18F-FLT signal at this time point.
18F-FLT uptake may be influenced by several aspects of host and tumor cell thymidine metabolism. These include plasma thymidine levels, activity of the cellular nucleoside transporter, thymidine kinase activity, and availability of the TK1 cofactor adenosine triphosphate. Plasma thymidine levels vary widely between species, with the highest documented levels in rats (mean, 266 μg/L), lower levels in mice (mean, 166 μg/L), and the lowest levels in humans (mean, 10 μg/L). We did not measure plasma thymidine concentrations in our study, because levels remain relatively constant within a given species (34) and our analysis was limited to 1 mouse strain. Furthermore, tumor 18F-FLT uptake during therapy with PKI-166 was significantly correlated with tumor cell proliferation as assessed by the PCNA labeling index, thus confirming that 18F-FLT uptake provides a noninvasive readout for the antiproliferative effects of ErbB kinase inhibition in vivo.
Although we observed a significant correlation between 18F-FLT uptake and tumor cell proliferation, this correlation demonstrated some scattering (r = 0.71). A similar correlation has been reported recently by Wagner et al. (13), who found a correlation coefficient of r = 0.63 between 18F-FLT uptake and the bromodeoxyuridine labeling index in a series of untreated mice bearing xenografts of the human DoHH2 non-Hodgkin’s lymphoma cell line. Numerous factors are potentially related to imperfect correlation between 18F-FLT uptake and tumor cell proliferation. First, it is well known that only minimal amounts of 18F-FLT are incorporated into the DNA of proliferating cells in vivo (35). Therefore, 18F-FLT is not a direct, but an indirect, measure of cellular proliferation and its uptake by tumor cells reflects the activity of the thymidine salvage pathway. Loss of cell cycle-specific regulation of TK1 activity may result in 18F-FLT uptake during the G1 and G2 phases (36,37). Furthermore, cancer cells also synthesize thymidine de novo and, therefore, are not completely dependent on the uptake of extracellular thymidine and TK1 activity (15). These 2 factors may contribute to the scattering in the correlation between 18F-FLT uptake and cellular proliferation as assessed by PCNA staining. In addition, tumor heterogeneity may affect the measured PCNA labeling, and partial-volume effects are likely to have influenced the 18F-FLT uptake values in the PET studies. Finally, tumor perfusion, vascular permeability, and nucleoside transporter activity may potentially change 18F-FLT uptake independently from cellular proliferation. In human studies, a closer correlation between 18F-FLT uptake and histologic measures of cellular proliferation has been reported with correlation coefficients ranging between 0.74 and 0.94 (9,28). Technical differences in the PET studies of mice and humans may partly explain these different findings. In addition, the studied patient population seems to considerably influence the results, because one study has even found no significant correlation between 18F-FLT uptake and Ki-67 labeling in patients with thoracic tumors (38).
In the future, it will be important to determine whether noninvasive assessment of tumor cell proliferation by 18F-FLT PET can be improved by dynamic data acquisition and tracer kinetic modeling. Using this approach it may be feasible to further dissect the mechanism of 18F-FLT uptake by the tumor tissues and distinguish 18F-FLT delivery (perfusion, vascular permeability, and nucleoside transport) from 18F-FLT phosphorylation. Assessment of 18F-FLT phosphorylation (k3) or net 18F-FLT flux (Ki) may improve the correlation between 18F-FLT uptake and tumor cell proliferation. This could be particularly important for monitoring therapy with kinase inhibitors, which—in contrast to PKI-166 (39)—also inhibit protein kinases involved in the regulation of angiogenesis.
CONCLUSION
Inhibitors of the ErbB signaling network have received regulatory approval for the treatment of advanced breast, non-small cell lung, and colon cancer. In all of these malignancies, only a subset of patients appears to benefit from this targeted therapy, and molecular determinants of treatment response are currently unknown. The early recognition of tumor responses by noninvasive biologic imaging offers obvious advantages to the treating clinician and the design of clinical trials of cytostatic cancer therapeutics. Our study shows that 18F-FLT PET provides noninvasive, quantitative, and repeatable measurements of changes in tumor cell proliferation in vivo. The ability of 18F-FLT PET to document a cytostatic response to kinase inhibitor therapy within days of treatment may greatly reduce delays in clinical decision making currently imposed by the limitations of anatomic imaging.
Acknowledgments
Drs. Elisabeth Buchdunger and Peter Traxler (Novartis Pharma AG) kindly provided PKI-116. We thank Waldemar Ladno, Judy Edwards, Victor Dominguez, and Ron Sumida for excellent technical assistance and the cyclotron staff for providing the radiolabeled compounds. Support was provided by the Swiss Academy of Medical Sciences, the American Society of Clinical Oncology, and the U.S. Department of Defense.
Footnotes
Received Apr. 2, 2004; revision accepted Aug. 10, 2004.
For correspondence or reprints contact: Johannes Czernin, MD, Ahmanson Biological Imaging Clinic, David Geffen School of Medicine, University of California at Los Angeles, AR 128 CHS, 10833 Le Conte Ave., Los Angeles, CA 90095-6942.
E-mail: jczernin{at}mednet.ucla.edu
REFERENCES
In this issue


Jump to section
Related Articles
Cited By...
- Harnessing Preclinical Molecular Imaging to Inform Advances in Personalized Cancer Medicine
- Noninvasive imaging of immune responses
- Fully Automated Production of Diverse 18F-Labeled PET Tracers on the ELIXYS Multireactor Radiosynthesizer Without Hardware Modification
- A Personalized Preclinical Model to Evaluate the Metastatic Potential of Patient-Derived Colon Cancer Initiating Cells
- Evaluation of the Genisys4, a Bench-Top Preclinical PET Scanner
- [18F]-FLT Positron Emission Tomography Can Be Used to Image the Response of Sensitive Tumors to PI3-Kinase Inhibition with the Novel Agent GDC-0941
- In Vivo Imaging of Cell Proliferation Enables the Detection of the Extent of Experimental Rheumatoid Arthritis by 3'-Deoxy-3'-18F-Fluorothymidine and Small-Animal PET
- 3'-Deoxy-3'-18F-Fluorothymidine PET/CT to Guide Therapy with Epidermal Growth Factor Receptor Antagonists and Bcl-xL Inhibitors in Non-Small Cell Lung Cancer
- Monitoring Tumor Response to Therapy with 18F-FLT PET
- Molecular Imaging: 18F-FDG PET and a Whole Lot More
- Radiopharmaceuticals in Preclinical and Clinical Development for Monitoring of Therapy with PET
- Kinetic Modeling of 3'-Deoxy-3'-18F-Fluorothymidine for Quantitative Cell Proliferation Imaging in Subcutaneous Tumor Models in Mice
- Imaging of Cell Proliferation: Status and Prospects
- Changes in Tumor Metabolism as Readout for Mammalian Target of Rapamycin Kinase Inhibition by Rapamycin in Glioblastoma
- Dynamic Small-Animal PET Imaging of Tumor Proliferation with 3'-Deoxy-3'-18F-Fluorothymidine in a Genetically Engineered Mouse Model of High-Grade Gliomas
- Preclinical Efficacy of the c-Met Inhibitor CE-355621 in a U87 MG Mouse Xenograft Model Evaluated by 18F-FDG Small-Animal PET
- Monitoring Tumor Glucose Utilization by Positron Emission Tomography for the Prediction of Treatment Response to Epidermal Growth Factor Receptor Kinase Inhibitors.
- Early Detection of Chemoradioresponse in Esophageal Carcinoma by 3'-Deoxy-3'-3H-Fluorothymidine Using Preclinical Tumor Models
- In vivo Biological Activity of the Histone Deacetylase Inhibitor LAQ824 Is detectable with 3'-Deoxy-3'-[18F]Fluorothymidine Positron Emission Tomography
- Positron Emission Tomography As an Imaging Biomarker
- Impact of Animal Handling on the Results of 18F-FDG PET Studies in Mice
- Chaperoning Drug Development with PET
- Reproducibility of 3'-Deoxy-3'-18F-Fluorothymidine MicroPET Studies in Tumor Xenografts in Mice