


Abstract
Epidermal growth factor receptor (EGFR) mutational status, activation of downstream signaling, and effective apoptotic cascade are all factors that may affect the tumor response to EGFR tyrosine kinase inhibitors (TKIs) in non–small cell lung cancer (NSCLC). Here we test whether 3′-deoxy-3′-18F-fluorothymidine (18F-FLT) PET/CT can provide clues for the selection of patients with NSCLC as candidates for treatment with reversible and irreversible EGFR TKIs or combination treatment with Bcl-xL inhibitors. Methods: HCC827, H1975, and H1650 NSCLC cells were subcutaneously injected into flanks of nude mice. Tumor-bearing animals were treated daily for 3 d by oral gavage with erlotinib at 50 and 150 mg/kg, CL-387,785 (an irreversible EGFR TKI) at 50 mg/kg, WZ4002 (a more potent irreversible EGFR TKI) at 25 and 50 mg/kg, ABT-263 (a Bcl-xL inhibitor) at 6.25 mg/kg, and a combination of erlotinib (50 mg/kg) and ABT-263 (6.25 mg/kg). Imaging studies were performed before and after 3 d of treatment by intravenous injection of 7.4 MBq of 18F-FLT and small-animal PET/CT of animals at 1 h after injection. Quantitative analysis of reconstructed images of baseline and posttreatment scans was performed, and the percentage change in 18F-FLT uptake in each animal was determined. Tumor sections were tested for Ki67 immunostaining and the percentage of apoptotic cells. Results: Sensitive tumors (HCC827) showed mean decreases in 18F-FLT uptake of 45% and 28% with high- and low-dose regimens of erlotinib, respectively. Resistant NSCLC cells bearing a T790M mutation (H1975) showed mean increases in 18F-FLT uptake of 27% and 33% with high and low doses of erlotinib, respectively. Treatment with CL-387,785, low-dose WZ4002, and high-dose WZ4002 caused mean decreases in tracer uptake of 21%, 26%, and 36%, respectively. NSCLC cells that were resistant because of dysregulation of Bcl-2 family members (H1650) showed mean reductions in 18F-FLT uptake of 49% and 23% with high and low doses of erlotinib, respectively, whereas the addition of ABT-263 did not affect tracer uptake but significantly increased the percentage of apoptotic cells in tumor sections. Conclusion: PET/CT with 18F-FLT may contribute to the selection of patients who may benefit from treatment with reversible and irreversible EGFR TKIs and may provide clues about which patients with NSCLC may be candidates for combination treatment with erlotinib and Bcl-xL inhibitors.
Several epidermal growth factor receptor (EGFR) tyrosine kinase inhibitors (TKIs) have been developed as targeted therapeutic agents for the treatment of different types of tumors, including non–small cell lung cancer (NSCLC). Despite the expression of EGFR in a high percentage of NSCLCs, only subgroups of patients benefit from treatment with EGFR TKIs such as gefitinib and erlotinib (1,2). Previous studies indicated that the presence of somatic mutations in the kinase domain of EGFR is a major determinant of the high response rate of subgroups of patients (3–5). Exon 19 deletions and single point mutations in exon 21 hyperactivate the kinase, and NSCLC cells become dependent on EGFR signaling for survival (6). Consequently, when cells with mutant EGFR are treated with gefitinib or erlotinib, they undergo apoptosis in addition to growth arrest.
Despite the high responsiveness of tumors bearing activating EGFR mutations, most may become resistant to TKIs, and multiple molecular mechanisms may underlie such resistance. Secondary mutations in the kinase domain of EGFR have been reported in approximately 50% of refractory tumors in patients; in particular, the T790M mutation is thought to confer resistance through steric hindrance or an increased binding affinity for ATP (7–9). To overcome T790M-mediated resistance, several irreversible EGFR TKIs have been developed and have been reported to covalently bind to the ATP pocket despite the presence of the T790M mutation (10). Among those compounds are CL-387,785, which binds to both T790M mutant EGFR and wild-type EGFR, and WZ4002, which has a higher affinity for the mutant form of EGFR than for wild-type EGFR and thus results in less toxicity for normal tissues (11).
A growing body of evidence indicates that cancer cells bearing activating EGFR mutations may become resistant if they can maintain the activity of downstream signaling pathways in the presence of EGFR TKIs by redundant and lateral signaling through Met amplification (12,13). To overcome such resistance, Met inhibitors may be added to erlotinib treatment (14). Previous studies also highlighted the role of Bcl-2 family members as downstream mediators of TKI-induced apoptosis (15). In this respect, proapoptotic proteins containing only BH3 domain (BH3-only proteins) such as Bim and Bad have been reported to mediate TKI-induced killing of lung cancer cells with activating EGFR mutations (16) and Bcr/Abl+ leukemic cells (17). Impaired upregulation of Bim in response to EGFR TKIs has been reported to confer resistance (15,16,18). Recently, high levels of antiapoptotic protein Bcl-xL were reported in a considerable percentage of NSCLC samples obtained from patients (19), suggesting its involvement in the occurrence of resistance to EGFR TKIs that is due to an altered apoptotic program. In this respect, several Bcl-xL/Bcl-2 inhibitors, including ABT-263, have been developed and tested in clinical trials in combination with conventional anticancer agents (20). Because multiple molecular mechanisms may cause resistance to EGFR TKIs, it is important not only to detect noninvasively tumors refractory to EGFR TKI treatment but also to identify the mechanisms underlying such resistance, thus allowing the adaptation of therapy.
Here we tested whether PET/CT with 3′-deoxy-3′-18F-fluorothymidine (18F-FLT) can identify sensitive and resistant NSCLCs and can provide clues for the selection of patients with NSCLC as candidates for treatment with reversible and irreversible EGFR TKIs or combination treatment with Bcl-xL inhibitors.
MATERIALS AND METHODS
Cell Lines and Treatment
Three NSCLC cell lines with oncogenic mutations of EGFR were obtained from the American Type Culture Collection: HCC827, with a deletion of exon 19 (delE746_A750); H1975, with point mutations in exon 21 (L858R) and exon 20 (T790M); and H1650, with a deletion of exon 19 (delE746_A750) and a loss of PTEN (phosphatase and tensin homolog). Despite the presence of activating mutations in all cell lines (delE746_A750 or L858R), H1975 cells also harbored the T790M mutation, which is known to confer resistance to gefitinib and erlotinib (7,8); in addition, H1650 cells were reported to be resistant because of impaired upregulation of Bim in response to EGFR TKIs (15,16,1). Cells were grown in RPMI medium containing 10% fetal bovine serum, penicillin at 100 IU/mL, and streptomycin at 50 μg/mL in a humidified incubator with 5% CO2 at 37°C.
Cells were treated with increasing concentrations of EGFR TKIs (0.1–10 μM) for various time periods. Drug-induced toxicity was assessed with the MTS assay (Promega) as previously described (21). In addition, the extent of cell death was assessed by staining with annexin V–fluorescein isothiocyanate–propidium iodide (Pharmingen) after exposure of cells to 1 μM EGFR TKI for 12–48 h. Flow cytometry was used for cell cycle analysis. In brief, cells were treated with 1 μM EGFR TKI for 24 h, stained with propidium iodide in the presence of ribonuclease, and analyzed by fluorescence-activated cell sorting (Becton, Dickinson and Co.). At least 3 independent experiments were performed in triplicate for each assay, and data were pooled.
Immunoblot Analysis
Whole-cell lysates were prepared as previously described (21). In brief, cells were treated with increasing concentrations of erlotinib for 24 h and then lysed in 200 μL of a buffer containing 1 mM ethylenediaminetetraacetic acid, 0.2% Triton X-100 (Sigma), and protease and phosphatase inhibitors. Western blot analysis of proteins from whole-cell lysates was performed with a standard procedure. Polyvinylidene difluoride membranes were probed with rabbit polyclonal antibodies against Bim (Cell Signaling; 1:500) and a monoclonal antibody against actin (Sigma; 1:1,000).
Animal Tumor Models and Treatments
All animal experimental procedures were conducted in accordance with Italian law for animal protection and were approved by the Italian Ministry of Health, Animal Welfare Direction (Protocol No. 5998-A-01/04/2008).
Female BALB/c (nu/nu) mice, 5 wk old and weighing 15–20 g, were purchased from Charles River Laboratories. HCC827, H1975, and H1650 cells (5 × 10⁶–10 × 106) were resuspended in 200 μL of RPMI medium, injected subcutaneously into the flank of nude mice, and allowed to grow for 2 wk. When tumors reached a mean volume of approximately 100 mm3 [volume = 0.5 × greatest diameter × (shortest diameter)2], animals were randomized into treatment groups (of at least 4 animals for each cell line and for each treatment). Tumor-bearing animals were treated daily for 3 d by oral gavage with erlotinib at 50 and 150 mg/kg, CL-387,785 (an irreversible EGFR TKI) at 50 mg/kg, WZ4002 (an irreversible EGFR TKI with a higher affinity for T790M mutant EGFR than for wild-type EGFR) at 25 and 50 mg/kg, ABT-263 (a Bcl-xL inhibitor) at 6.25 mg/kg, and a combination of erlotinib (50 mg/kg) and ABT-263 (6.25 mg/kg) (Table 1).
Animal Tumor Models and Treatments
Imaging Studies with 18F-FLT and Small-Animal PET/CT
The entire synthesis of 18F-FLT was performed with the commercially available TRACERlab FX F-N synthesis module (GE Healthcare). In brief, (5′-O-DMTr-2′-deoxy-3′-O-nosyl-β-d-threo-pentofuranosyl)-3-N-BOC-thymine was used as a precursor and was subjected to radiofluorination according to a previously described procedure with slight modifications (22). The resulting labeled products had a radiochemical purity of greater than 99%, as assessed by high-performance liquid chromatography.
Each animal underwent baseline and posttreatment scans according to the schedule shown in Table 1. The baseline scan on day 0 was performed 3 h before any treatment; the posttreatment scan on day 2 was performed 3 h after the last drug administration. A small-animal PET/CT scanner (eXplore Vista preclinical PET scanner; GE Healthcare) was used for PET/CT studies. In brief, animals were injected intravenously with 7.4 MBq of 18F-FLT, anesthetized 50 min later, and scanned by CT for 10 min. One bed position including the tumor was scanned (axial field of view, 68 mm), and images were acquired with the x-ray source set at 35 kVp and 200 μΑ. PET images were then acquired (at 1 h after injection) (23) for an acquisition time of 20 min (24). The body temperature of the animals was held constant during tracer biodistribution and imaging with a heating pad or heat lamp.
After acquisition, the images were reconstructed by use of a combination algorithm based on Fourier rebinning followed by 2-dimensional iterative image reconstruction with ordered-subsets expectation maximization. PET and CT images were automatically coregistered, and fusion images were obtained. PET images were corrected for decay, and the data were converted to standardized uptake values (SUVs). No statistically significant change in animal weight was observed after 3 d of treatment. Caliper tumor measurements were not significantly different between baseline and posttreatment scans.
Three-dimensional regions of interest were drawn around the tumor on transaxial PET images of baseline and posttreatment scans, and a volume of interest was determined by use of an automated isocontouring program (GE Healthcare). The maximum SUV within the tumor volume of interest was then registered for each study. To account for differences in tracer biodistribution and possible minimal occult extravasation of the administered dose, a spheric region of interest was drawn in the contralateral flank as a reference region; care was taken to avoid areas of physiologic uptake (25,26). The maximum SUV of the tumor was normalized to the corresponding mean SUV of the reference region.
Finally, the percentage change in 18F-FLT uptake in the posttreatment scan relative to the baseline scan was determined for each animal. All quantitative data from animal imaging studies were expressed as mean ± SE.
Analysis of Proliferation and Apoptosis in Tumor Samples
After the imaging studies were completed, animals were sacrificed, and tumors were surgically removed, immediately frozen in liquid nitrogen, and stored at −80°C until studied. Ten consecutive 5-μm adjacent sections corresponding to the largest cross-sectional area of the tumor were cut in a cryomicrotome. The rate of proliferation of tumor cells was evaluated with a rabbit polyclonal antibody directed against the Ki67 antigen (Abicam; 1:100 dilution) and a goat polyclonal secondary antibody to rabbit IgG–horseradish peroxidase (1:1,000 dilution). Tumor sections were immunostained by a standard procedure with diaminobenzidine as a chromogen and counterstained with hematoxylin.
The percentage of tumor cells undergoing apoptosis was determined by in situ end labeling of DNA fragments (terminal deoxynucleotidyl transferase–mediated dUTP–biotin nick-end labeling [TUNEL] assay) with a commercially available kit (Promega). In brief, tumor sections were incubated with terminal deoxynucleotidyl transferase enzyme and biotinylated deoxynucleotide for 1.5 h at 37°C according to the manufacturer's instructions. The reaction was revealed by the addition of peroxidase-conjugated streptavidin and diaminobenzidine as a chromogen.
Tumor sections adjacent to those used for the analysis of proliferation and apoptosis were stained with hematoxylin and eosin and examined by light microscopy. No measurable areas of necrosis were observed in tumor sections; only microscopic foci of necrosis were occasionally found in sensitive tumors after treatment and were excluded from the histologic analysis. Tumor sections were examined by light microscopy at a magnification of ×400. The observer was not aware of the treatment group or 18F-FLT PET findings for the particular specimen examined. Each section was divided into 4–10 regions randomly selected along the 2 major diameters. A minimum of 100 tumor cells were counted in every region, and the results were expressed as the mean percentage of positively stained tumor cells in a section (27). Data from treated tumors (3 for each cell line and for each treatment) were averaged and compared with data from untreated tumors (n = 3) with an unpaired Student t test.
Statistical Analyses
The software used for statistical analyses was MedCalc for Windows, version 10.3.2.0 (MedCalc Software). Unpaired and paired Student t tests were used as appropriate to compare means. In particular, a paired t test was used to compare 18F-FLT uptake in the same tumors before and after treatment, whereas an unpaired t test was used to examine differences between untreated controls and treated groups with respect to quantitative histopathologic data, cell cycle profiles, and fluorescein isothiocyanate–conjugated annexin V staining. Differences between means were considered to be statistically significant at P values of less than 0.05 and highly statistically significant at P values of less than 0.01.
RESULTS
The sensitivity of HCC827, H1975, and H1650 cells to increasing concentrations of erlotinib was tested with the MTS assay. HCC827 cells showed the highest level of drug responsiveness, having a 50% inhibitory concentration of less than 1 μM (Fig. 1A). Conversely, both H1650 and H1975 cells were refractory to 48 h of erlotinib treatment, having 50% inhibitory concentrations of greater than 1 μM. The erlotinib concentration of 1 μM is usually considered to be a cutoff for sensitivity because this concentration approaches the levels achievable in the plasma of patients receiving treatment (6,28). When HCC827, H1975, and H1650 cells were exposed to this erlotinib concentration, only HCC827 cells showed a significant increase in the percentage of tumor cells undergoing apoptosis after 24 and 48 h of drug exposure, confirming the results of the viability assay (Fig. 1B). Furthermore, cell cycle analysis of HCC827 and H1650 cells exposed to 1 μM erlotinib for 24 h revealed a significant increase in the proportion of cells in the G1 phase and a significant decrease in the proportion of cells in the S phase relative to the findings for the untreated controls, indicating that erlotinib caused G1 cell cycle arrest in both cell lines (Fig. 1C). Therefore, in agreement with previous findings (15,18), the resistance of H1650 cells was mainly due to a failure in apoptosis rather than a lack of growth arrest in response to erlotinib. Conversely, no significant changes in the proportions of cells in the G1 and S phases were observed for resistant H1975 cells after erlotinib treatment, indicating that the T790M mutation prevented erlotinib-induced G1 growth arrest, as previously reported (Fig. 1C) (18,29). As expected, only HCC827 cells showed an upregulation of Bim after 24 h of erlotinib exposure (Fig. 1D).
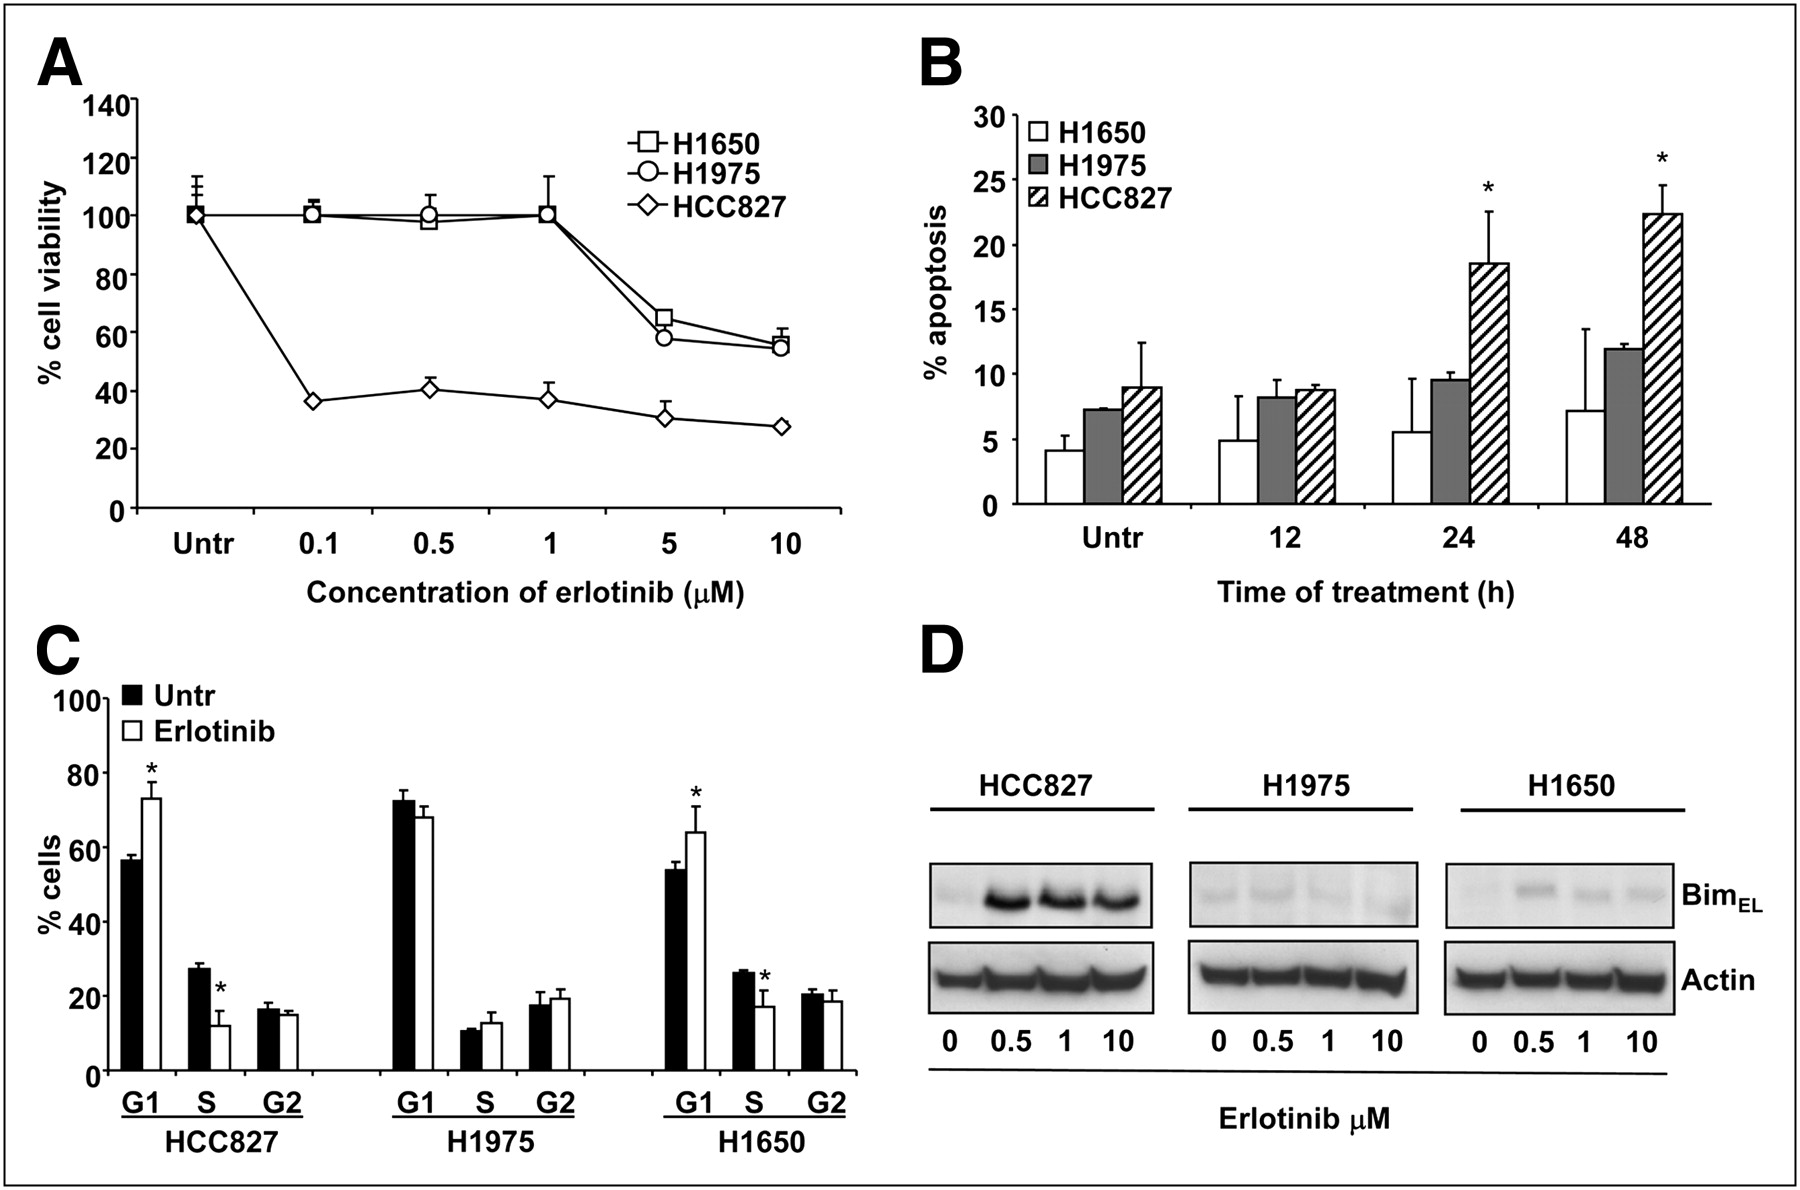
Effects of erlotinib in sensitive and resistant NSCLC cells. (A) Cell toxicity assay after treatment with increasing concentrations of erlotinib for 48 h. (B) Percentage of cells undergoing apoptosis after exposure to 1 μM erlotinib for 12–48 h. (C) Effects of erlotinib on cell cycle in NSCLC cells. (D) Representative Western blots of samples obtained from sensitive and resistant NSCLC cells exposed to increasing concentrations of erlotinib for 24 h. Upregulation of proapoptotic protein BimEL was seen only in HCC827 cells. Actin served to ensure equal loading. *P < 0.05. Untr = untreated.
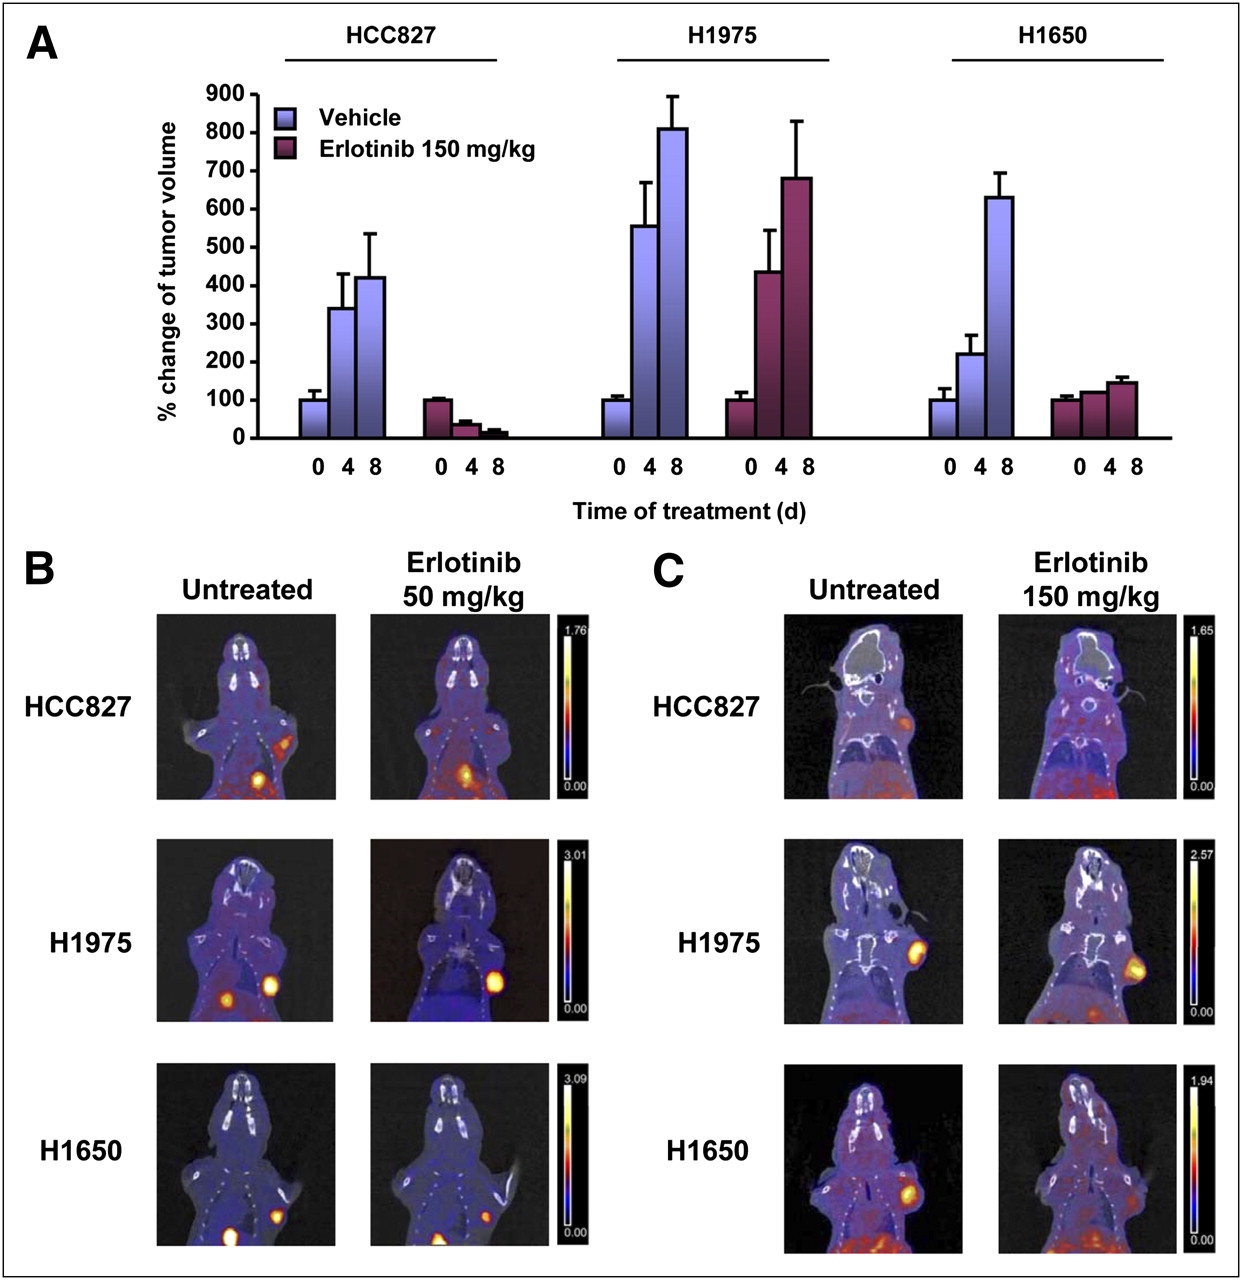
The sensitivity and resistance of the NSCLC cell lines also were confirmed in tumor-bearing nude mice receiving erlotinib treatment (Fig. 2A).

(A) Tumor volumes measured over time in animals receiving vehicle or erlotinib at 150 mg/kg. Data are expressed as percentage of tumor volume measured at beginning of treatment. (B and C) Representative coronal fusion images of small-animal PET/CT studies performed with 18F-FLT in nude mice bearing HCC827 (top), H1975 (middle), and H1650 (bottom) xenografts before (left) and after (right) treatment with erlotinib at 50 mg/kg (B) and 150 mg/kg (C). After treatment, tumor uptake of 18F-FLT decreased in HCC827 and H1650 tumors but remained unchanged in H1975 xenografts at both drug doses. The same threshold values of SUV were applied to PET images from pretreatment and posttreatment scans of each animal, as shown by color scale at right.
Imaging studies of nude mice bearing HCC827, H1975, and H1650 xenografts were then performed with 18F-FLT before and after treatment with reversible and irreversible EGFR TKIs. Figure 2 shows representative PET/CT coronal fusion images of tumor-bearing mice before and after treatment with erlotinib at 50 and 150 mg/kg. Tumor uptake of 18F-FLT could be visualized in all baseline studies, whereas after treatment only H1975 tumors showed a persistently high level of uptake of 18F-FLT, indicating a lack of growth arrest.
Quantitative analysis of percentage variations in 18F-FLT uptake in posttreatment studies compared with corresponding baseline studies is shown in Figure 3. Sensitive HCC827 tumors showed a statistically significant reduction in 18F-FLT uptake of 45% ± 3% (P < 0.01) after treatment with a high dose of erlotinib, whereas a reduction of 28% ± 4% was observed after treatment with the low-dose regimen. Resistant H1975 tumors bearing the T790M mutation showed increases in 18F-FLT uptake of 27% ± 15% and 33% ± 10% in response to high and low doses of erlotinib, respectively. In agreement with the results of cell cycle analysis, H1650 tumors showed reductions in 18F-FLT uptake of 49% ± 5% (P < 0.01) and 23% ± 16% after treatment with high and low doses of erlotinib, respectively; these results confirmed that in this cell line, resistance to EGFR TKIs was mainly due to an impaired apoptotic program rather than a lack of growth arrest.
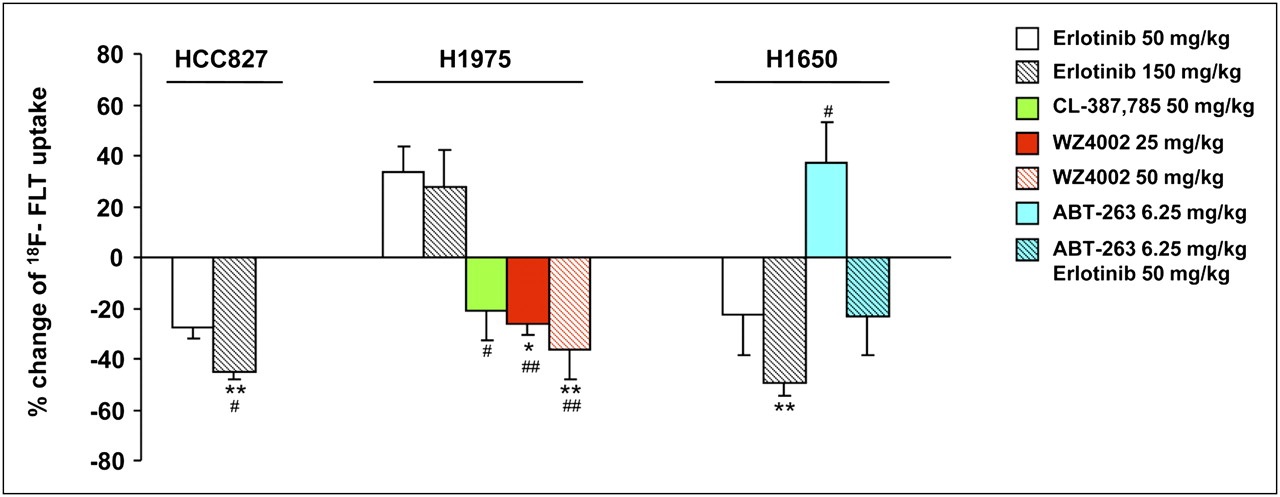
Quantitative analysis of percentage variations in 18F-FLT uptake in posttreatment studies and corresponding baseline studies. Asterisks indicate statistically significant differences in percentage changes in 18F-FLT uptake in treated animals vs. corresponding untreated controls (*P < 0.05, **P < 0.01). Number symbols indicate statistically significant differences in percentage changes in 18F-FLT uptake after each treatment vs. those induced by erlotinib at 50 mg/kg (#P < 0.05, ##P < 0.01) in tumors derived from same cell line.
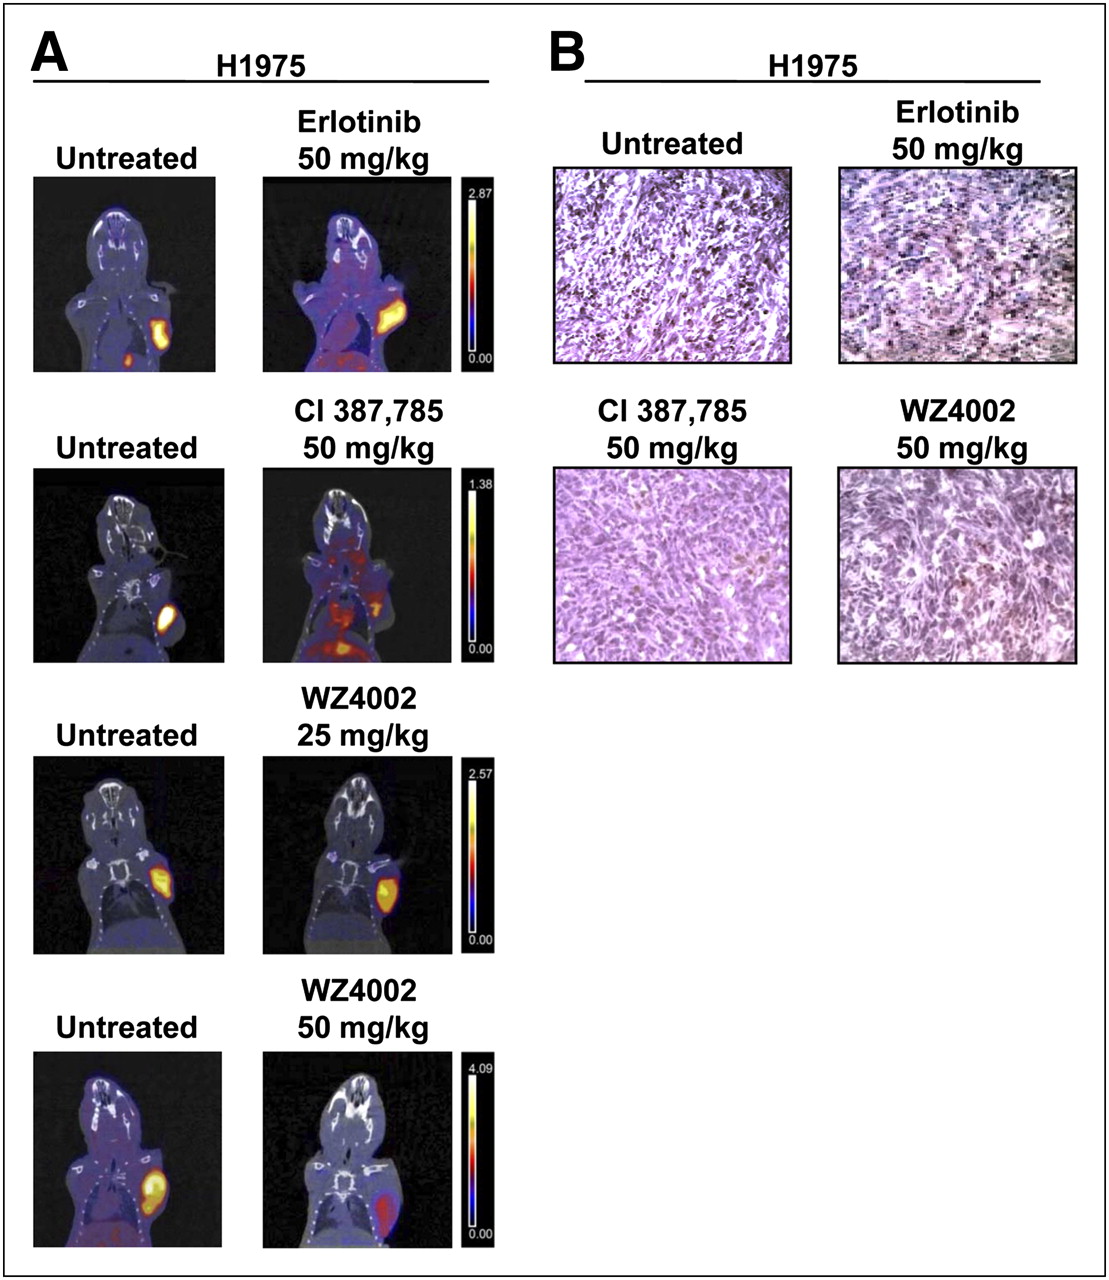
To overcome T790M-mediated resistance, H1975 tumor–bearing animals were treated with irreversible inhibitors, such as CL-387,785 and WZ4002. 18F-FLT imaging studies were then performed. Figure 4 shows representative PET/CT coronal fusion images of untreated and treated animals. A striking reduction in 18F-FLT uptake was observed in resistant H1975 tumors after treatment with CL-387,785 (50 mg/kg), whereas erlotinib was ineffective in the same animals. Similar findings were obtained after treatment with WZ4002 at the same dose (50 mg/kg); furthermore, in agreement with the reported higher affinity of WZ4002 for T790M mutant EGFR than for wild-type EGFR, even a lower dose of the drug (25 mg/kg) was effective in those animals. The percentage reduction in 18F-FLT uptake after treatment with CL-387,785 at 50 mg/kg was 21% ± 12%; this uptake was significantly different from tracer uptake after treatment with erlotinib at 50 mg/kg (P < 0.05). Treatment with WZ4002 at 50 and 25 mg/kg significantly reduced 18F-FLT uptake by 36% ± 12% (P < 0.01 for comparison with untreated controls and P < 0.01 for comparison with erlotinib at 50 mg/kg) and 26% ± 4% (P < 0.05 for comparison with untreated controls and P < 0.01 for comparison with erlotinib at 50 mg/kg), respectively (Fig. 3). The use of irreversible EGFR TKIs in H1975 tumor–bearing animals caused the reversal of T790M-mediated resistance to EGFR TKIs, as confirmed by Ki67 staining (Fig. 4B).

(A) Representative images of small-animal PET/CT studies performed with 18F-FLT in nude mice bearing resistant H1975 xenografts harboring T790M mutation before (left) and after (right) treatment with erlotinib at 50 mg/kg, CL-387,785 at 50 mg/kg, and WZ4002 at 25 and 50 mg/kg. Coronal small-animal PET/CT fusion images showed reduction in 18F-FLT uptake in resistant H1975 tumors after treatment with CL-387,785 and WZ4002 (50 mg/kg), whereas erlotinib was ineffective in same animals. As expected, treatment with lower dose of WZ4002 caused change in 18F-FLT uptake that was less pronounced but still significantly different from that observed in erlotinib-treated animals. Color scale at right shows that the same threshold values of SUV were applied to pretreatment and posttreatment PET images. (B) Representative images of Ki67 staining in tumor sections from untreated and treated animals bearing H1975 xenografts. Administration of irreversible EGFR TKIs (CL-387,785 and WZ4002) significantly reduced rate of tumor cell proliferation, confirming imaging findings, whereas erlotinib was ineffective in same tumors.
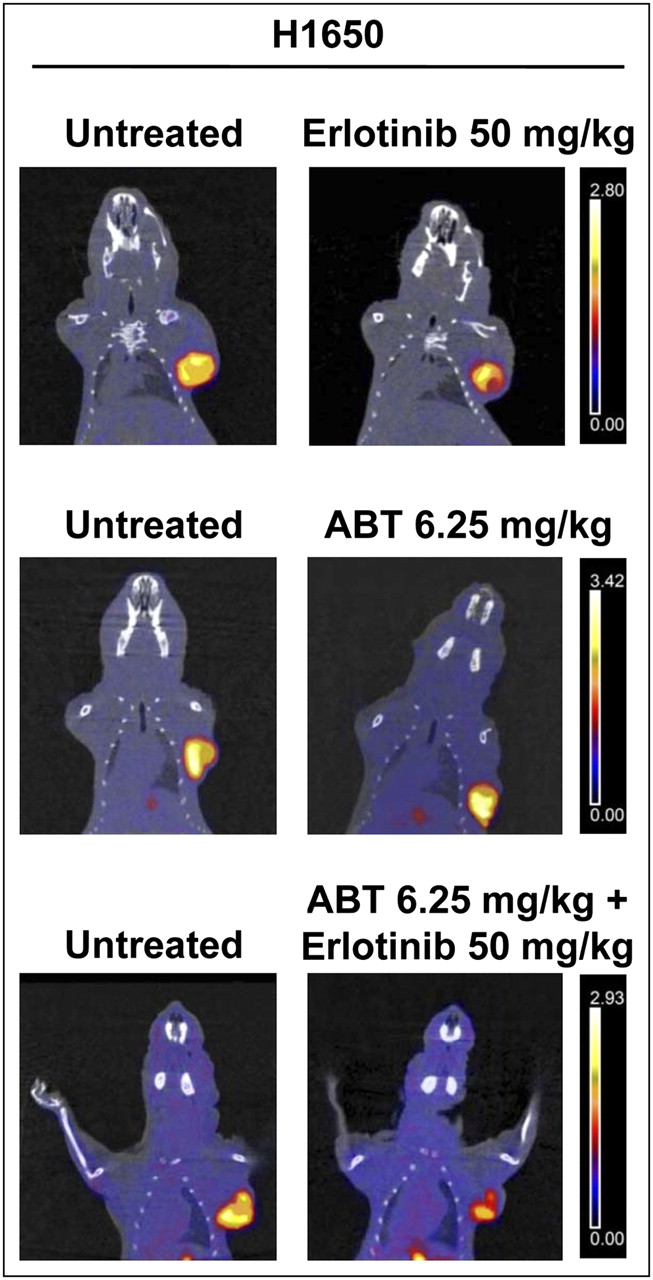
To overcome the resistance of H1650 cells to EGFR TKIs, which was likely due to an altered apoptotic program, and because these cells express relatively high levels of Bcl-xL (21), H1650 tumor–bearing animals were treated with ABT-263 (a Bcl-xL inhibitor) either alone or in combination with erlotinib. 18F-FLT imaging studies were then performed. Figure 5 shows representative PET/CT coronal fusion images of untreated and treated animals. Treatment with ABT-263 alone was followed by an increase in 18F-FLT uptake of 37% ± 16%, whereas treatment with a combination of ABT-263 and erlotinib (50 mg/kg) caused a reduction in 18F-FLT uptake of 23% ± 15%; the latter effect was not different from the effect of erlotinib alone in the same animals.

Representative images of small-animal PET/CT studies performed with 18F-FLT in nude mice bearing H1650 xenografts before (left) and after (right) treatment with erlotinib at 50 mg/kg, ABT-263 at 6.25 mg/kg, and combination of erlotinib at 50 mg/kg and ABT-263 at 6.25 mg/kg. Coronal small-animal PET/CT fusion images showed increase in 18F-FLT uptake after treatment with ABT-263 alone, whereas combination of ABT-263 and erlotinib caused reduction in 18F-FLT uptake that was not different from effect of erlotinib alone in same tumors. The same threshold values of SUV were applied to PET images from pretreatment and posttreatment scans of each animal, as shown by color scale at right.
When excised tumors were analyzed for determination of the rate of proliferation and the apoptotic index, HCC827 tumors showed a statistically significant reduction in the rate of proliferation after treatment with both doses (P < 0.01) of erlotinib and a parallel significant increase in the percentage of apoptotic cells after treatment with low (P < 0.05) and high (P < 0.01) drug doses (Fig. 6A). As expected, resistant H1975 tumors did not show any significant change in the rate of proliferation or the apoptotic index in response to both doses of erlotinib (Fig. 6B). Conversely, treatment with CL-387,785 caused a statistically significant reduction in the rate of proliferation (P < 0.05) and a parallel significant increase in apoptosis (P < 0.01) compared with the results in untreated tumors. Similar findings were obtained with WZ4002 at the same dose and a lower dose; the rate of proliferation was significantly reduced (P < 0.05) and apoptosis was significantly increased (P < 0.01) in treated tumors (Fig. 6B). A statistically significant reduction in the rate of proliferation was observed in H1650 tumors exposed to low (P < 0.01) and high (P < 0.001) doses of erlotinib compared with the results observed in untreated controls (Fig. 6C). Conversely, no significant change in the rate of proliferation was observed in H1650 tumors exposed to ABT-263 alone, whereas combination treatment with ABT-263 and erlotinib at 50 mg/kg caused a significant reduction in the rate of proliferation (P < 0.01); the latter finding was not different from that observed in H1650 tumors treated with the same dose of erlotinib alone. Although the percentage of apoptotic cells in H1650 tumors was slightly increased after treatment with erlotinib at 50 and 150 mg/kg compared with the results observed in untreated controls, this change was not statistically significant. Treatment with ABT-263 alone at 6.25 mg/kg did not induce any significant change in the percentage of apoptotic cells in the same tumors, whereas a strong effect on apoptosis was observed after combination treatment with ABT-263 and erlotinib at 50 mg/kg (P < 0.01); the latter effect was significantly greater than the effect observed with erlotinib alone (P < 0.01).
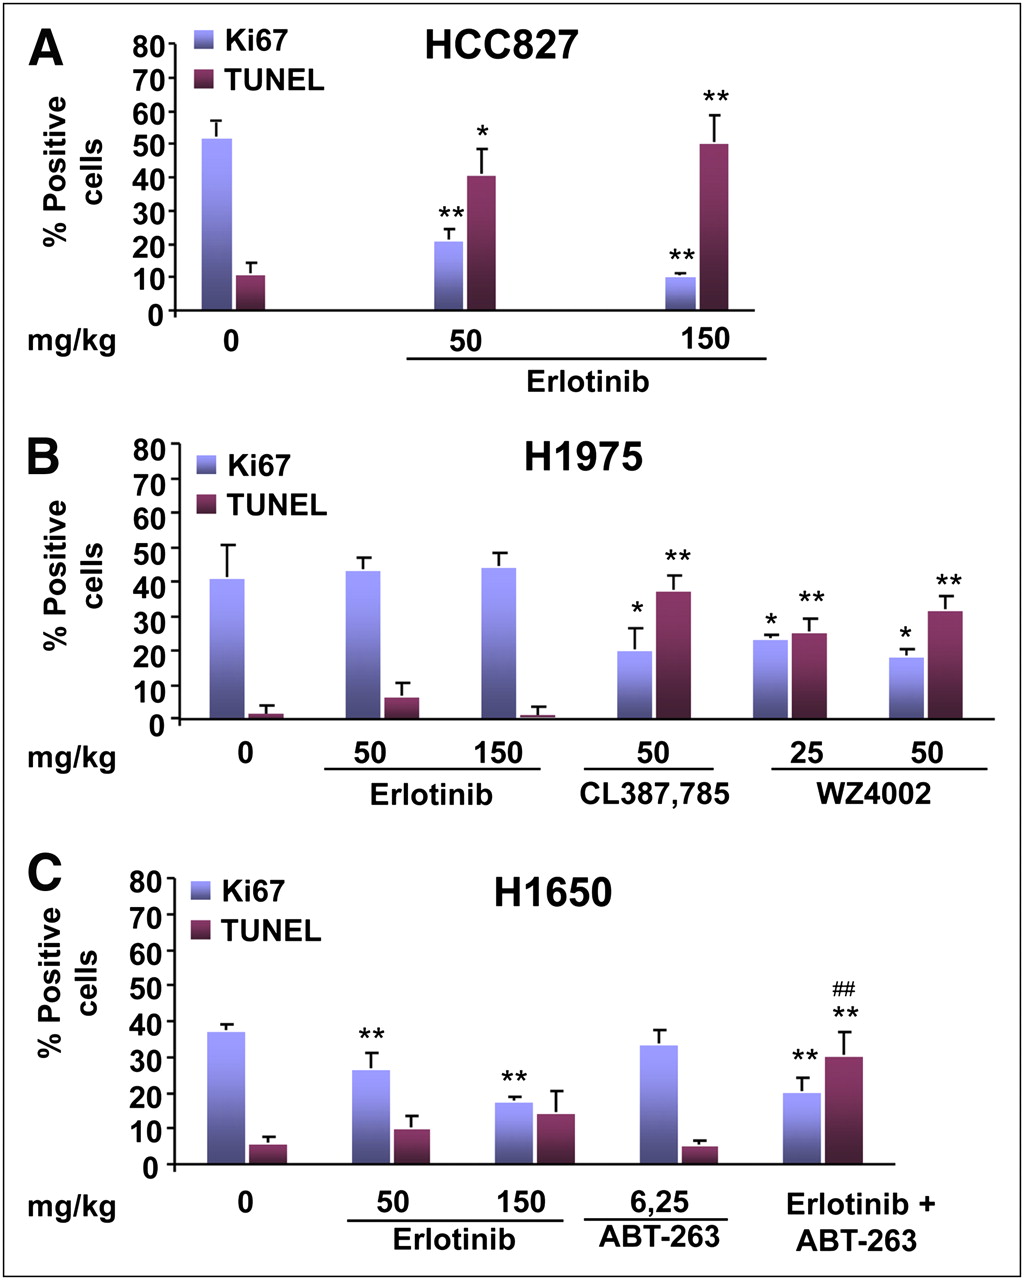
Rate of proliferation and percentage of apoptotic cells in tumor sections. Blue columns indicate percentage of tumor cells positively stained with anti-Ki67 antibody, whereas red columns indicate percentage of apoptotic cells in tumor sections (mean ± SD) before and after indicated treatment. Asterisks indicate statistically significant differences in each parameter between treated tumors and untreated controls (*P < 0.05, **P < 0.01). Number symbols indicate statistically significant differences in each parameter induced by combination treatment (erlotinib at 50 mg/kg plus ABT-263 at 6.25 mg/kg) vs. erlotinib alone (50 mg/kg) (##P < 0.01).
DISCUSSION
This study showed that a persistently high level of uptake of 18F-FLT after treatment with a reversible EGFR TKI can successfully identify NSCLC cells that are resistant because of the occurrence in the EGFR kinase domain of a T790M secondary mutation that prevents EGFR TKI binding and subsequent growth arrest. The reduction in 18F-FLT uptake after 3 d of treatment with irreversible EGFR TKIs, such as CL-387,785 and WZ4002, demonstrated the reversal of T790M-mediated resistance and the successful induction of growth arrest in association with enhanced apoptosis, as documented by Ki67 staining and a TUNEL assay.
About one-half of cancers that become refractory to EGFR TKIs harbor the T790M secondary mutation, which represents the most prevalent mechanism of resistance in patients with NSCLC (30). According to Sequist et al. (30), molecular analyses of repeated lung biopsies from such patients are needed to identify different mechanisms of acquired resistance. A potential clinical application of our observations could be the development of a test for responsiveness to EGFR TKI treatment using noninvasive imaging. The information provided by such a test may help in the selection of patients as candidates for therapy with reversible or irreversible EGFR TKIs and in the development of therapeutic strategies for overcoming resistance in patients with refractory NSCLC.
Several studies have reported on the use of 18F-FLT to evaluate tumor responses to both conventional and molecularly targeted therapy (31–33). In particular, Ullrich et al. (29) reported a prompt reduction in 18F-FLT uptake in sensitive PC9 and HCC827 xenografts and persistently enhanced tracer uptake in resistant H1975 tumors after 2–4 d of erlotinib treatment. Our findings are in agreement with these observations and confirmed that 18F-FLT provides a faithful visualization of tumor cell proliferation and is a sensitive tool for detecting the antiproliferative effects of targeted anticancer agents. In addition, our findings indicate that imaging studies with 18F-FLT can identify the successful reversal of resistance by CL-387,785 and WZ4002, which can neutralize the underlying molecular mechanism. We hypothesize that a similar approach using Met inhibitors in combination with EGFR TKIs may be adopted to detect noninvasively the reversal of resistance that is due to Met amplification.
A consistent body of evidence has indicated that resistance to EGFR inhibition can be modulated by alterations in the intrinsic apoptotic pathway that is controlled by Bcl-2 family members. Dynamic interactions among the proapoptotic and antiapoptotic proteins of the Bcl-2 family ultimately regulate mitochondrial membrane permeabilization, the release of cytochrome c from mitochondria, and the subsequent activation of effector caspases. The exposure of sensitive cells to EGFR TKIs induces the upregulation of proapoptotic BH3-only protein Bim, which interacts with the BH3 domain–binding site of antiapoptotic Bcl-2 proteins, thus facilitating the apoptotic cascade. Downregulation of Bim by small interfering RNA reduces gefitinib-induced apoptosis (16), and overexpression of Bcl-2 inhibits cell death on exposure to erlotinib (15), thus causing resistance. Recently, a class of compounds that inhibit antiapoptotic Bcl-2 proteins by mimicking the BH3 domain interaction of the proapoptotic BH3-only proteins was introduced and tested in clinical trials (20). One of these molecules, ABT-263, was shown to enhance the efficacy of taxanes in NSCLC (19). We used this compound in an attempt to overcome the resistance to EGFR TKIs of H1650 cells, which have been reported to have impaired upregulation of Bim in response to erlotinib and relatively high levels of Bcl-xL. The addition of ABT-263 did not affect 18F-FLT uptake but significantly increased the percentage of apoptotic cells in tumor sections, thus indicating a synergistic effect of the 2 drugs on apoptosis. Therefore, we believe that, to monitor such a synergistic effect, a second tracer such as 99mTc-hydrazinonicotinamide–annexin V or 18F-labeled 2-(5-fluoropentyl)-2-methyl malonic acid is needed to reveal the effective induction of apoptosis.
CONCLUSION
T790M-mediated resistance to erlotinib treatment can be revealed early after the initiation of therapy by persistently enhanced 18F-FLT uptake in tumors, indicating the lack of an antiproliferative effect. This observation may provide clues for the selection of patients as candidates for treatment with irreversible EGFR TKIs that are able to induce growth arrest in tumors harboring the EGFR T790M mutation. Patients showing a reduction in 18F-FLT uptake after treatment with erlotinib may benefit from combination treatment with ABT-263, which can interact with Bcl-xL/Bcl-2, thus facilitating the apoptotic cascade and eventually overcoming the resistance to EGFR TKIs that is due to impaired upregulation of Bim in response to erlotinib.
DISCLOSURE STATEMENT
The costs of publication of this article were defrayed in part by the payment of page charges. Therefore, and solely to indicate this fact, this article is hereby marked “advertisement” in accordance with 18 USC section 1734.
Acknowledgments
This work was partly supported by the Ministry of University and Research, MERIT–MEdical Research in ITaly (Project No. RBNE08YFN3_008) and AIRC, Associazione Italiana per la Ricerca sul Cancro (project no. 11756). No other potential conflict of interest relevant to this article was reported.
Footnotes
Published online Feb. 13, 2012.
- © 2012 by the Society of Nuclear Medicine, Inc.
REFERENCES
- Received for publication August 4, 2011.
- Accepted for publication October 25, 2011.


Jump to section
Related Articles
Cited By...
- Inositol Trisphosphate Receptor Type 3-mediated Enhancement of EGFR and MET Cotargeting Efficacy in Non-Small Cell Lung Cancer Detected by 18F-fluorothymidine
- Reversal of Warburg Effect and Reactivation of Oxidative Phosphorylation by Differential Inhibition of EGFR Signaling Pathways in Non-Small Cell Lung Cancer
- Monitoring Reversal of MET-Mediated Resistance to EGFR Tyrosine Kinase Inhibitors in Non-Small Cell Lung Cancer Using 3'-Deoxy-3'-[18F]-Fluorothymidine Positron Emission Tomography
- PET Imaging of Proliferation with Pyrimidines