


Abstract
Comprehensive molecular analysis of individual tumors provides great potential for personalized cancer therapy. However, the presence of a particular genetic alteration is often insufficient to predict therapeutic efficacy. Drugs with distinct mechanisms of action can affect the biology of tumors in specific and unique ways. Therefore, assays that can measure drug-induced perturbations of defined functional tumor properties can be highly complementary to genomic analysis. PET provides the capacity to noninvasively measure the dynamics of various tumor biologic processes in vivo. Here, we review the underlying biochemical and biologic basis for a variety of PET tracers and how they may be used to better optimize cancer therapy.
- precision medicine
- PET imaging tracers
- early response biomarkers
- pharmacodynamic imaging
- personalized cancer therapy
The era of personalized or precision medicine, in which therapies are chosen on the basis of specific molecular features of an individual patient’s tumor, has seen dramatic advances both in the number of therapies that can be offered to a patient and the molecular analyses used to identify actionable therapeutic targets. However, despite an expanding arsenal of drugs, coupled with a wealth of deep-sequencing data across many human malignancies, therapeutic targeting of actionable molecular alterations has yielded mixed results. In some cancer patients, molecularly targeted therapies have shown remarkable efficacy (1,2), yet responses can be highly variable among a patient population, despite the presence of a common molecular alteration. For example, approximately 40% of patients with BRAF mutant melanoma do not respond to BRAF inhibitors, whereas EGFR-targeted therapy is ineffective in about 30% of patients with EGFR mutant lung cancer (2,3). This variation in response can be attributed, at least in part, to a panoply of intrinsic resistance mechanisms that can preclude drug responses, to tumor levels that are insufficient to effectively engage the target, and to incomplete tumor sampling, possibly due to biopsy sampling error or multiple metastases (4). Accordingly, mutational signatures acquired from a patient biopsy cannot alone—in many instances—provide sufficient information to predict whether an individual tumor will respond to a specific therapy.
Given that genomic data provide no direct information on biologic function, particularly in response to a drug perturbation, there is an urgent need to develop in vivo assays that can rapidly assess whether a given therapy has engaged its intended target or induced a biologic effect on the tumor. Such an assay could heighten confidence that the correct drug and dose are selected for a particular patient, potentially sparing unnecessary side effects and costs. However, conventional methods to assess drug response are typically anatomically based and conducted after multiple rounds of therapy over the course of weeks to months (5). These methods leave clinicians inferring the biologic effect of a particular drug, resulting in a lengthy time during which the efficacy of the drug on a patient’s tumor remains unknown.
PET has emerged as a defining imaging technology to noninvasively and quantitatively measure functional processes or biomarkers in vivo (6). By coupling well-designed PET imaging probes with an understanding of the biology of disease, scientists and clinicians have begun to use PET imaging to provide a rapid, personalized assessment of the efficacy of a variety of therapies in humans. Monitoring of tumor response to therapy based on the activity of critical functional or biochemical pathways, rather than on size alone, represents a fundamental advance in our ability to investigate the biology of cancer in vivo and to rapidly measure the impact of treatments on specific biologic processes.
Perhaps key to the most effective integration of PET imaging in cancer therapy is a deep understanding of the functional process that a given PET tracer measures, and the interaction of a specific drug with that process. Different classes of anticancer agents have distinct mechanisms of action; thus, the effect on tumor biology can vary among drugs. With an underlying knowledge of how a given drug perturbs a particular cellular function, one can, ideally, match the drug with the PET tracer to obtain an in vivo assessment of whether the drug has engaged its target and disrupted a specific biochemical process of the tumor. Although engagement and disruption do not necessarily always equate to a therapeutic response, such an assessment can nevertheless provide valuable insight into drug pharmacodynamics in a noninvasive manner. Having this functional information to complement molecular signatures from biopsies could greatly accelerate drug development and facilitate appropriate drug dosing and scheduling (Fig. 1).
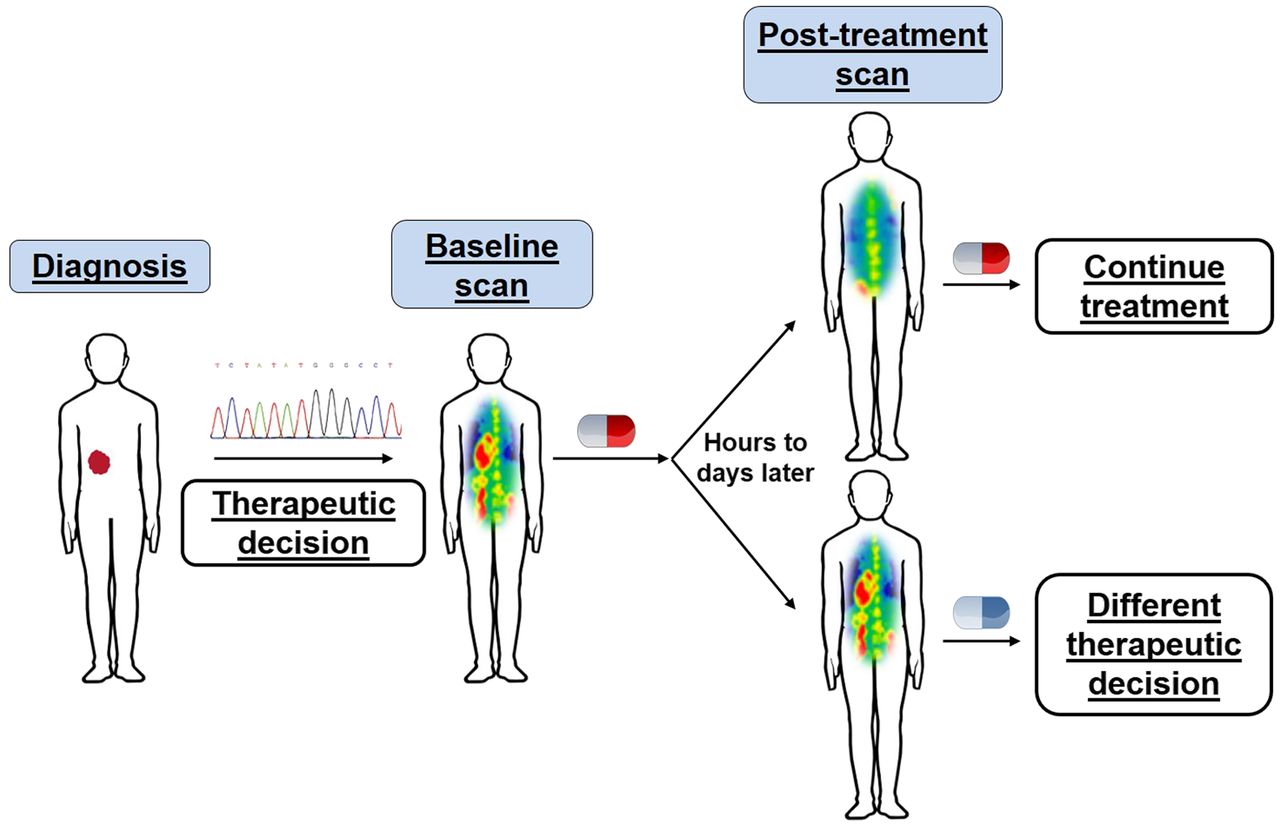
Personalized medicine through integrated genomic and in vivo functional profiling. In parallel to genomic profiling, PET imaging permits visualization of drug-induced changes in specific biochemical processes, providing insight into drug–target engagement or alterations in tumor phenotype with particular therapy. This information can enable physicians to make rapid decisions on whether to continue or alter therapy.
Here we describe the underlying biologic and biochemical basis of various classes of PET probes used in cancer imaging. Accordingly, much of this review focuses on preclinical work that supports the potential application of these probes for real-time clinical assessment of functional processes in vivo. The ultimate goal is to provide a brief overview of how PET imaging can be implemented to provide useful information for drug discovery, development, and deployment in complex living organisms. This review is not intended to be comprehensive but, rather, to provide select examples of where well-understood biology coupled with well-designed PET imaging tracers can be used to develop robust assays to measure the activity of, and perturbations of, important functional processes of cancers.
METABOLIC MEASUREMENTS OF THERAPEUTIC RESPONSES
Glucose Metabolism
By far the most widely used PET tracer for oncologic applications is the radiolabeled glucose analog 18F-FDG. 18F-FDG PET is frequently used for tumor grading and staging, as well as to make early predictions on therapeutic response. Importantly, drug-mediated reductions in 18F-FDG uptake often precede changes in tumor volume. The value of 18F-FDG is rooted in the observation that most malignant tumors display heightened rates of glycolysis relative to their nonmalignant counterparts (7). This rewired metabolism—a phenomenon often termed the Warburg effect—is characterized by elevated glycolytic flux for rapid synthesis of ATP, reducing equivalents, and biosynthetic intermediates for nucleic acids, proteins, and lipids, all to support tumor growth, proliferation, and survival (8). Given the elevated demands for glucose, significant evidence now supports that interfering with tumor glucose metabolism via genetic or pharmacologic targeting of glycolytic proteins can have dramatic antitumor effects (9–11). Accordingly, altered glucose metabolism is considered a hallmark of cancer.
NOTEWORTHY
 Noninvasive PET imaging permits quantitative measurements of drug-induced perturbations of functional tumor processes; these alterations often precede changes in tumor size.
- Understanding the functional process that a PET tracer measures, and how a specific drug engages this process, can allow for the most effective coupling of a PET tracer and a drug to assess pharmacodynamics or predict therapeutic response.
- Functional profiling using PET can complement molecular diagnostics to facilitate cancer drug development and deployment.


Although the Warburg effect was described nearly a century ago, only recently has oncogenic signaling been found responsible for this metabolic phenotype. A variety of oncogenic mutations commonly seen in cancers drive heightened glucose metabolism. These include genetic alterations in the receptor tyrosine kinase (RTK)/RAS/phosphotidylinositol-3-OH kinase (PI3K) pathway (12), as well as elevated levels of protooncogenes such as myc and loss of tumor suppressors such as Rb and p53 (8). The mechanisms by which these alterations lead to enhanced glycolysis are varied and can occur at any level of biology, including changes in enzyme transcription, translation, localization, and activity, among others. For example, activation of Akt by RTK-PI3K signaling can promote glucose consumption via expression or translocation of glucose transporters and hexokinase II, the critical facilitative transporters and enzyme responsible for efficient cellular glucose transport and metabolism, respectively (8,13,14). Recent work in melanoma shows that mutant BRAF signaling through mitogen-activated protein kinase can stimulate tumor glucose uptake through similar mechanisms (15). Moreover, the transcription factor MYC—which can be regulated by growth factor signaling (16)—stimulates the expression of glucose transporters and hexokinase II, as well as the splicing of pyruvate kinase isozyme M2 for enhanced glycolytic flux (17,18).
These studies accentuate the critical role of oncogenic signaling in regulating the metabolism necessary for tumor growth and survival. Consequently, acute inhibition of these signaling cascades with molecularly targeted therapies can attenuate glucose metabolism and disrupt the metabolic homeostasis of the tumor (14,15,19). Importantly, data suggest that decreased glucose metabolism contributes to the therapeutic response to targeted agents (20). As such, sustained oncogenic signaling in the presence of a drug, which can be a consequence of pharmacodynamic failure or drug resistance (intrinsic or adaptive), can be associated with persistent tumor glycolytic activity (15). Thus, the efficacy of targeted drugs may be in part due to their ability to reduce tumor glucose metabolism.
Given the recent advances in our understanding of the mechanistic underpinnings of tumor glucose metabolism, how can 18F-FDG PET imaging be leveraged to aid in personalized medicine? Like glucose, 18F-FDG is transported into the cell via glucose transporters, whereby it is subsequently phosphorylated by hexokinase to 18F-FDG-6-phosphate. However, in contrast to glucose-6-phosphate, 18F-FDG-6-phosphate is unable to proceed down the glycolytic pathway. Accordingly, the accumulation of 18F-FDG-6-phosphate in tumors is a direct measure of the transport and initial phosphorylation of glucose and, under steady-state conditions, can be a measure of total glucose flux (21). These processes are regulated by aberrant oncogenic signaling. Because of this causal relationship, significant evidence supports that rapid changes in tumor 18F-FDG uptake are reflective of robust inhibition of driver oncogenic cascades (i.e., pathways necessary for tumorigenesis) and are predictive of therapeutic outcome at kinetics that precede changes in tumor volume.
Several studies support this premise. For example, Su et al. demonstrated that treatment of EGFR mutant lung cancer cells with the EGFR inhibitor gefitinib can elicit a 50% reduction in 18F-FDG uptake within 2 h of drug administration (22). Reduced 18F-FDG accumulation was a result of reduced glucose transporter localization at the plasma membrane from inhibition of EGFR signaling. Notably, decreased 18F-FDG uptake occurred before changes in cell proliferation and viability in cell culture, and the metabolic changes identified in vitro were also observed in vivo; therefore, rapid changes in 18F-FDG uptake with PET were predictive of therapeutic response (Fig. 2). Similar results were recently found in NF1 mutant tumors; however, here a combination of targeted agents (e.g., mitogen-activated protein kinase and mammalian target of rapamycin [mTOR] inhibition) was required for robust inhibition of 18F-FDG consumption (20). Attenuated 18F-FDG consumption was observed within hours of the combination treatment and could predict therapeutic outcome. Although clinical studies are beyond the scope of this review, they largely mirror what has been identified in preclinical studies: rapid changes in 18F-FDG uptake—in some cases as early as 24–48 h after treatment—can predict a therapeutic response to oncogene-targeted therapy (23,24). Thus, 18F-FDG PET may be particularly valuable for quickly evaluating whether a new therapy or therapeutic strategy that either directly or indirectly targets glucose uptake can elicit an important functional tumor response.
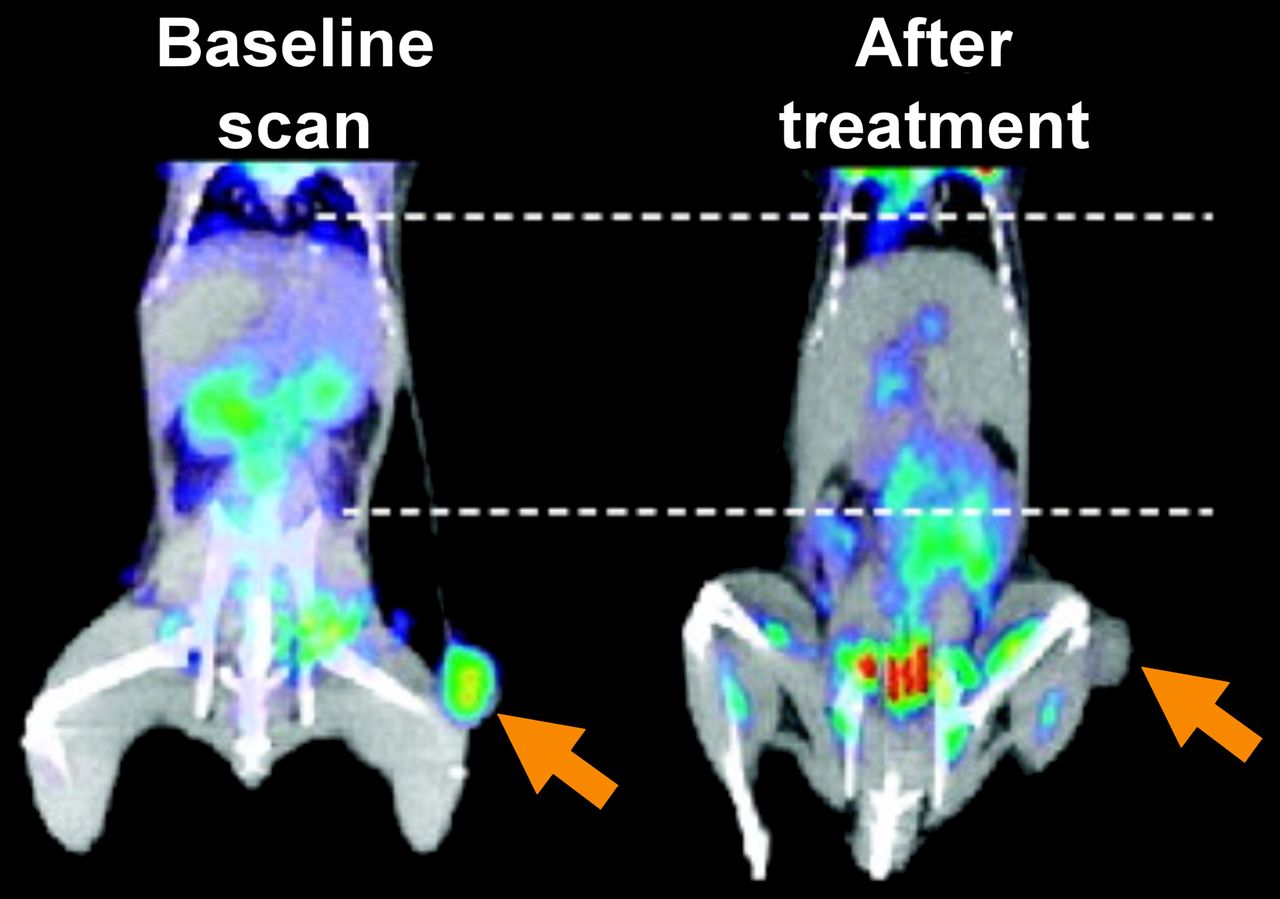
Efficacy of targeting aberrant oncogenic signaling predicted through rapid changes in glucose consumption on 18F-FDG PET. Mice with xenograft of H3255 lung cancer cells were imaged with 18F-FDG before and 2 h after treatment with EGFR inhibitor, gefitinib. (Adapted with permission of (22).)
Amino Acid Metabolism
Glutamine
Work spanning several decades has shown that glutamine can be an essential nutrient for cancer cell growth and survival (25,26). Like glucose, enhanced glutamine metabolism is driven by specific oncogenes and proteins, including MYC, mTOR, KRAS, and hypoxia-inducible factor 2α, through increased expression of the glutamine transporters ASCT2 and SN2, glutaminase, and aspartate transaminase (25,27–29). Consumed glutamine can aid a variety of metabolic processes, such as by contributing nitrogen for the synthesis of nucleic acids, proteins, and hexosamines and contributing carbon for anaplerosis (25). The precise role of consumed glutamine in vivo remains controversial (29,30). However, it is apparent that a variety of cancers alter their glutamine metabolism compared with surrounding tissue and that targeting glutamine metabolism can be therapeutically efficacious (27–29).
On the basis of the numerous ways glutamine can contribute to tumorigenesis, various glutamine-based PET imaging probes have been developed, of which 4-18F-(2S,4R)-fluoroglutamine (18F-FGln) is the best studied (31,32). As 18F-FGln is consumed by cells but minimally metabolized, the utility of 18F-glutamine PET imaging for monitoring therapeutic efficacy will likely depend, in large part, on how the intended drug target regulates glutamine transport or intracellular pool sizes. For example, glutaminase inhibition can alter glutamine consumption, and recent work demonstrated that 18F-FGln PET could accurately measure inhibition of pharmacologic glutaminase, the enzyme responsible for converting glutamine to glutamate, in breast cancer xenografts (33). Importantly, because glutaminase can be important for tumor growth (34), and drugs targeting glutaminase have entered clinical trials, 18F-FGln PET may be useful for rapidly evaluating pharmacodynamics in humans and for predicting therapeutic efficacy. Moreover, given the described role of important oncogenic drivers in regulating glutamine metabolism (e.g., MYC and mTOR), this would suggest potential utility for 18F-FGln PET as a surrogate for disrupting glutamine consumption with drugs affecting these signaling pathways. Additional studies are required to fully understand the possible value of glutamine-based PET in cancer therapy discovery and development.
Other Amino Acids
In addition to glutamine, tumors consume a variety of other amino acids to synthesize protein and to contribute carbons for anaplerosis. Which amino acids are consumed and how those amino acids are used likely depend on the tissue of origin and the genetic drivers of the tumor (35,36). To measure the consumption of these amino acids, PET imaging probes based on the structures of amino acids have been developed, including 18F-fluoroethyl-tryosine, 18F-fluoro-l-dihydroxy-phenylalanine, and l-[methyl-11C]-methionine (37–39). Various preclinical studies suggest that these tracers can be used to monitor early responses to therapies (40–42). For example, in recent work by Lückerath et al., treatment of multiple-myeloma xenografts with the proteasome inhibitor bortezomib could attenuate tumor l-[methyl-11C]-methionine accumulation within 24 h of treatment. The reduced uptake occurred before measurable changes in 18F-FDG accumulation or tumor proliferation and, importantly, was predictive of overall survival (40). Though this and other examples provide evidence that amino acid PET tracers can be used to rapidly monitor treatment response, the underlying biology connecting how specific therapies affect the accumulation of these probes is unknown. Studies in this area can prove particularly challenging, as the cellular fate of amino acids is complex. Unlike glucose, which is consumed and rapidly catabolized, amino acids can be readily interconverted and the influx of one amino acid can drive the efflux of another, and vice versa (43). Thus, the rate of accumulation of an amino acid (or its companion PET tracer) does not necessarily reflect the cellular use of that amino acid. Future work is required to precisely determine whether and how a specific drug perturbs amino acid uptake and the biologic relevance of this perturbation. Such information could aid in determining the value of these amino acid tracers for early therapy monitoring and, potentially, for drug development.
Nucleotide Metabolism
Uninhibited cellular proliferation is a fundamental characteristic of cancer. Loss of cell cycle regulators and proapoptotic proteins, combined with aberrant oncogenic drivers, including growth factor receptors, leads to rapid and repeated progression through the cell cycle (44–46). During the cell cycle, cells must synthesize adequate levels of deoxynucleotide triphosphate (dNTP) pools to replicate or repair their DNA. To accommodate this demand, cells can produce dNTPs either de novo from metabolic precursors, including glucose and glutamine, or by salvaging deoxynucleosides from the extracellular milieu (47). Although still incompletely understood, it is likely that malignant cells favor de novo dNTP synthesis over salvage but can switch between the two for DNA replication, depending on environmental factors (48).
Given the importance of dNTP biosynthesis for cancer cell proliferation, considerable efforts have been aimed at developing PET probes to noninvasively measure nucleotide metabolism. Although a tracer for de novo dNTP production has yet to be developed, several imaging agents for measuring nucleoside salvage activity have been evaluated both preclinically and clinically. One notable example is the radiolabeled thymidine analog, 3′-deoxy-3′-18F-fluorothymidine (18F-FLT), which is a substrate for thymidine kinase 1—the rate-limiting enzyme in the salvage of thymidine and deoxyuridine. As thymidine kinase 1 expression and activity peak during the S phase of the cell cycle (47), labeled thymidine incorporation is commonly used for monitoring cell proliferation (49,50).
This relationship between thymidine kinase 1 expression and the cell cycle has led a variety of groups to use 18F-flourothymidine as a surrogate for attenuated cell cycle progression with therapy. This use has been demonstrated in preclinical and clinical studies, whereby a decrease in tumor 18F-flourothymidine accumulation in response to therapy predicted therapeutic efficacy before changes in tumor size. In one preclinical example, Waldherr et al. studied the kinetics of 18F-flourothymidine accumulation in a mouse xenograft model of an EGFR-overexpressed epidermoid carcinoma cell line. Tumor 18F-flourothymidine accumulation significantly decreased within 48 h of treatment with an EGFR tyrosine kinase inhibitor, and notably, the decrease occurred 2 wk before changes in tumor size were identified (51). Similarly, Li et al. showed that early changes in 18F-flourothymidine uptake could predict therapeutic response to heat-shock-protein inhibition in ALK-positive anaplastic large cell lymphoma. Attenuated 18F-flourothymidine accumulation was associated with a decrease in proliferation markers and, notably, preceded changes in 18F-FDG uptake (52).
However, despite the evidence supporting a correlation between changes in 18F-flourothymidine accumulation and decreased cell cycle progression, recent studies suggest, in some cases, a disconnect between thymidine kinase levels and conventional markers of cell cycle progression, such as Ki-67 expression (53,54). Thus, as with other PET tracers, when new uses for 18F-flourothymidine are being developed, it will be essential to understand how a given drug affects thymidine salvage (e.g., thymidine kinase expression and activity) and, subsequently, whether that effect is associated with a specific tumor phenotype.
In addition to PET tracers that image thymidine salvage, PET tracers have also been developed that measure deoxycytidine metabolism. These include 1-(2′-deoxy-2′-18F-fluoro-d-arabinofuranosyl)cytosine (18F-d-FAC), 1-(2′-deoxy-2′-18F-fluoro-l-arabinofuranosyl)cytosine (18F-l-FAC), 1-(2′-deoxy-2′-18F-fluoro-l-arabinofuranosyl)-5-methylcytosine (18F-l-FMAC), and 2-chloro-2′-deoxy-2′-18F-fluoro-9-d-arabinofuranosyl-adenine (18F-CFA) (collectively referred as 18F-FAC analogs), of which 18F-l-FAC, 18F-l-FMAC, and 18F-CFA have been tested in patients (55,56). All these probes are substrates for deoxycytidine kinase (dCK), whose canonical function is to phosphorylate recycled deoxycytidine, deoxyguanosine, and deoxyadenosine from the extracellular milieu. Although the precise functions of dCK in human disease are still not fully understood, recent work has shown that dCK is critical for supplying dNTPs during hematopoiesis to prevent stalled DNA replication and can promote resistance to therapeutic inhibition of de novo deoxycytidine triphosphate biosynthesis in leukemia (48,57,58). Additionally, dCK is required to activate a variety of nucleoside analog antimetabolite prodrugs, including gemcitabine, cytarabine, and fludarabine (59).
Given the described roles of dCK in cancer metabolism and treatment, various studies suggest that PET imaging with tracers that measure dCK activity may have value in evaluating and developing new therapies. For example, in one study, 18F-FAC uptake in leukemia xenografts effectively identified tumors with high dCK levels that were sensitive to a nucleoside analog prodrug, whereas low to absent 18F-FAC accumulation delineated tumors that lacked dCK and were insensitive to a nucleoside analog prodrug (60). Thus, one could hypothesize that imaging tumor dCK activity provides an in vivo assessment of the potential to activate a nucleoside prodrug and, conceivably, to predict the therapeutic response to that prodrug.
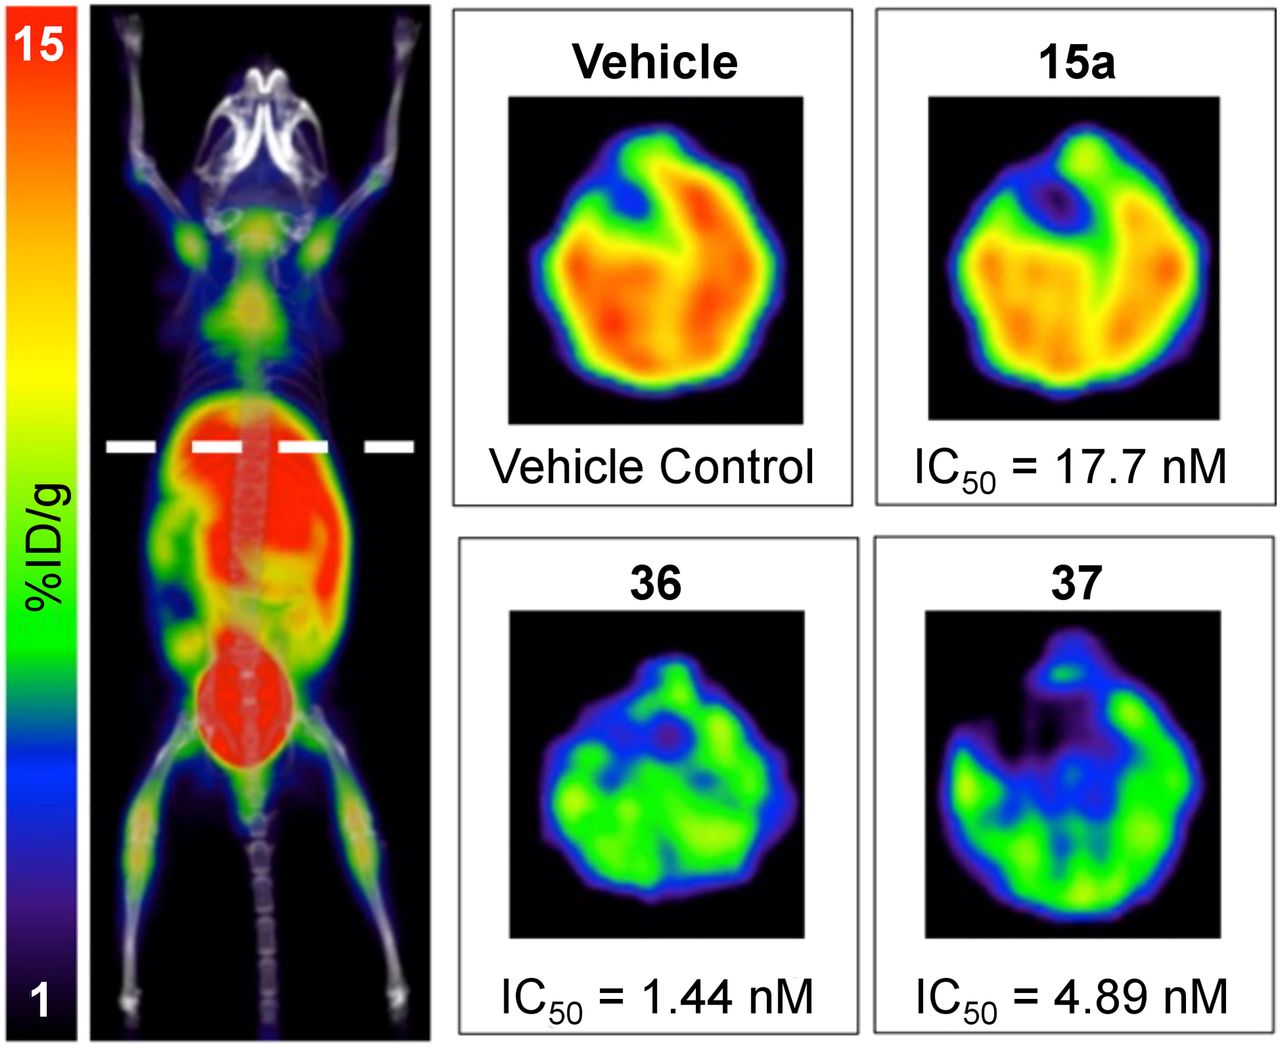
More recent applications for 18F-FAC analogs and PET imaging have focused on using PET imaging to facilitate the development of small-molecule inhibitors of dCK. Here, preclinical 18F-l-FAC imaging was incorporated to quickly assess and rank in vitro lead compounds for their efficacy in blocking dCK activity in vivo: imaging was performed 4 h after mice were treated with one dose of the inhibitor (Fig. 3). Those compounds that had the greatest effect on 18F-l-FAC accumulation in vivo were chosen for further studies. Importantly, the most potent compounds in in vitro assays were not the most potent compounds in vivo, demonstrating the consequence of the PET assay in identifying the optimal drug candidate (61). Further studies confirmed the efficacy of the identified compound in vivo (48). This work demonstrated the value of PET imaging for drug development that might be extended into human clinical studies.

18F-FAC PET monitoring of dCK activity during the development of small-molecule dCK inhibitors. Mice were treated with different dCK inhibitors (15a, 36, and 37) or vehicle, and livers were imaged in vivo. Relative activity of inhibitors in vivo was different from activity in cell culture (half-maximal inhibitory concentration [IC50] is listed below each image), demonstrating the power of the 18F-FAC PET assay in identifying the most potent in vivo dCK inhibitor. (Adapted with permission of (61).)
Acetate Metabolism
Acetyl coenzyme A is a key intermediate metabolite and can be used to produce energy, provide precursors for fatty acid synthesis (a process catalyzed by the enzyme fatty acid synthase [FASN]), and regulate gene expression through protein acetylation (62). In mammalian cells, acetyl coenzyme A is produced from pyruvate through the action of pyruvate dehydrogenase, from citrate through the action of adenosine triphosphate citrate lyase, or from acetate through the action of acetyl coenzyme A synthetase 1 or 2 (ACSS1 or ACSS2) (63). Acetate itself can be salvaged from extracellular space (62). ACSS2 is overexpressed in a variety of tumor types, including breast, ovary, lung, and metastatic prostate cancer, and ACSS2 expression is higher in high-grade than low-grade gliomas (30,64,65). ACSS2 expression increases with increased stage of invasive ductal carcinomas, and high ACSS2 expression correlates with worse overall survival in triple-negative breast cancer and grades II and III astrocytomas and oligoastrocytomas (30,64,65). Additionally, acetate can be used as a carbon source and can be oxidized through the tricarboxylic acid cycle in human glioblastoma and in brain metastases from breast and non–small cell lung cancer (30), can be incorporated into fatty acids and lipids, and can contribute to histone acetylation in hepatocellular carcinoma and breast cancer cell lines (64,65). Knockdown of ACSS2 in glioblastoma, prostate, hepatocellular, and breast cancer cell lines limits cell viability in vitro (30,65,66), whereas genetic abrogation of ACSS2 can alter tumorigenesis in vivo (64,65). Thus, acetyl coenzyme A biosynthesis may represent a targetable Achilles heel in cancer cells.
11C-acetate is a PET imaging probe that has been developed to quantify and image acetate consumption (67). 11C-acetate accumulates at greater levels in tumors with high protein expression of ACSS2, and importantly, knockdown of ACSS2 decreases accumulation of 14C-acetate and 11C-acetate in tumors (64,66), suggesting that 11C-acetate PET might be used to monitor ACSS2 protein levels. Recently, a small-molecule inhibitor of ACSS2 with efficacy in cells has been described (64), and given the important role of ACSS2 in the growth of various tumor types, it is likely that additional small-molecule ACSS2 inhibitors are being developed. Similarly, 11C-acetate accumulation is correlated with FASN levels, and small-molecule inhibitors of FASN block 11C-acetate consumption (68,69). One can envision the use of 11C-acetate PET imaging to rapidly identify whether an FASN or ACSS2 inhibitor is reaching and saturating its target in vivo.
IN VIVO MONITORING OF TARGET PROTEIN EXPRESSION AND ACTIVITY USING PET
In addition to having measurable effects on metabolism, cancer therapies can also alter the expression, localization, or activity of a variety of proteins. Many of these proteins are cell-surface or excreted proteins and thus accessible to radiolabeled antibodies, antibody fragments, and protein ligands. As is the case with metabolic imaging probes, understanding the core biology by which the levels or localization of a protein target affects tumor function provides an opportunity to develop rational imaging approaches to measure the dynamics of these targets after drug perturbations in vivo. Thus, in contrast to tissue sampling for pharmacodynamic or pharmacokinetic measurements, which can be fraught with sampling bias, some recently developed PET tracers may enable one to obtain whole-body, real-time assessments of the presence of a drug target or the effect of the drug on a specific target.
Imaging Androgen Receptor Signaling
Hormone signaling can play important roles in the development and survival of various cancers, most notably those related to the sex organs, including breast and prostate cancer (70,71). The androgen receptor (AR) is amplified in more than 40% of cases of metastatic prostate cancer (70), and androgen signaling is thought to be a strong driver of prostate cancer growth and metastasis. Thus, significant efforts have been aimed at developing new PET tracers as a means to noninvasively detect AR-positive prostate cancer and evaluate the dynamics of AR signaling after AR therapy. For example, the dihydrotestosterone analog 18F-fluoro-5-dihydrotestosterone (18F-FDHT) binds with high selectivity to AR, and importantly, 18F-FDHT PET imaging was able to quantify the pharmacodynamics of new antiandrogens in clinical studies (72). The same is true of other hormone receptors, including the estrogen receptor and the progesterone receptor, for which PET tracers have been developed and have shown utility in measuring early responses to hormone therapy (73).
Although 18F-FDHT can be valuable for determining androgen receptor occupancy, it does not provide direct information on AR signaling. Thus, imaging AR transcriptional targets has become an appealing method to quantitate AR activity in vivo. For example, the expression of prostate-specific membrane antigen (PSMA) is directly regulated by AR, with PSMA levels increasing with decreased AR activity (74). Various small-molecule and antibody-based PET tracers have been developed to image PSMA (75). Consistent with the biology of AR and PSMA, recent work suggests that tracers of PSMA expression can be used to provide an early indication that AR-directed therapies are effectively inhibiting AR activity. In one preclinical example, after 6 d of treatment with an antiandrogen, mice carrying prostate cancer xenografts showed an increased tumor accumulation of a 64Cu-labeled antibody directed against PSMA (Fig. 4) (76).
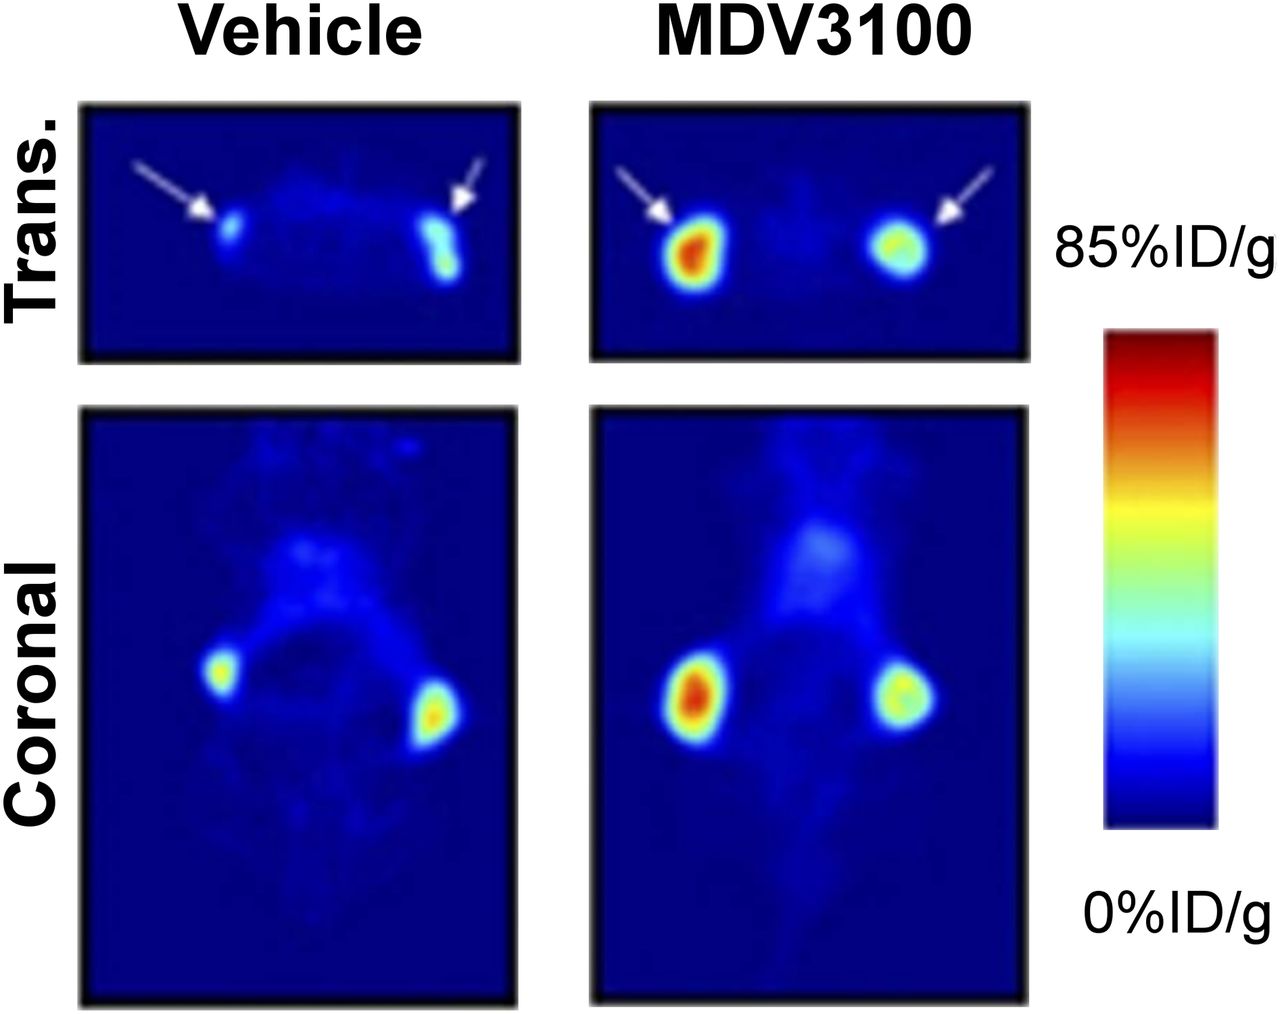
In vivo measurements of the biochemical response to hormone therapy for prostate cancer. PET images are of mice with prostate cancer xenografts treated with vehicle or the antiadrogen MDV3100 and injected with 64Cu-J591, a radiolabeled antibody directed against PSMA. %ID = percentage injected dose; trans. = transaxial. (Adapted from (76).)
In addition to PSMA-targeted PET probes for measuring AR activity, probes have been developed against the AR target gene product prostate-specific antigen (PSA). For example, Sawyers et al. recently demonstrated that when labeled with 89Zr, 5A10—a monoclonal antibody that recognizes free PSA—can localize to AR-driven preclinical prostate cancer xenografts, including bone metastasis models (77). Notably, 89Zr-5A10 could detect pharmacologic inhibition of AR activity in preclinical models early after treatment. Together, these studies suggest that imaging of AR target genes is feasible and can be useful for monitoring the early dynamics of AR activity in response to antiandrogen therapy.
Imaging Oncogenic Drivers
With the increasing number of novel cancer drugs against oncogenic drivers, there have been significant efforts to develop PET tracers to noninvasively measure the expression or activity of specific drivers. These could potentially be useful for developing in vivo assays to understand drug–target interactions. For example, direct imaging of RTKs—which are frequent oncogenic drivers in cancer—can be performed using radiolabeled antibodies, antibody fragments, and small molecules (78–80). If the binding of the radiolabeled antibody to an RTK is affected by targeting of that RTK with specific inhibitors (e.g., small molecule or antibody), these radiolabeled antibodies can also be used to directly quantify target inhibition.
This concept was recently demonstrated through the use of 89Zr-labeled trastuzumab, a therapeutic antibody directed against human epidermal growth factor receptor 2 (HER2), to monitor the pharmacodynamics of a small-molecule HER2 tyrosine kinase inhibitor in gastric tumors (78). 89Zr-trastuzumab could delineate HER2-positive gastric cancer. Notably, inhibition of tumor HER2 activity with a HER2 tyrosine kinase inhibitor led to decreased HER2 surface expression, which could be identified through reduced 89Zr-trastuzumab binding. Thus, PET can provide a rapid, quantitative readout of the initial step in a therapeutic mechanism of action, namely inhibition of target, and might be used to confirm target engagement.
Although RTKs represent an important class of oncogenic drivers, alterations in downstream signaling pathways (e.g., PI3K-Akt-mTOR, RAS–mitogen-activated protein kinase, and MYC) are also highly prevalent in many malignancies. However, radiolabeled peptides and antibodies cannot readily access the intracellular compartment of live cells. Thus, akin to imaging cell-surface PSMA as a surrogate for AR activity, recent work has taken similar approaches to image oncogenic signal transduction. For example, as MYC directly regulates the expression of the cell-surface protein transferrin receptor 1, Holland et al. radiolabeled transferrin with 89Zr and demonstrated that it could detect MYC-driven prostate cancer in mouse models (81). Future studies are required to test whether 89Zr-transferrin is useful to evaluate the pharmacodynamics of MYC-targeted therapy; however, these studies emphasize the potential value of using PET probes to measure the dynamics of specific nodes in oncogenic signaling pathways.
PET Tracers for Immunooncologic Applications
The durable clinical responses to new immunotherapies that have been observed in many cancer patients have elicited tremendous interest in identifying predictive biomarkers of response to these classes of drug. As T-cell tumor infiltration and activity are perhaps the most important factor in the response to immunotherapies (82), significant efforts are now under way to noninvasively measure the extent of effector T-cell infiltration in the tumor and to characterize the microenvironment for potential immunomodulatory effects (83). Such measurements could be valuable for monitoring the dynamics of effector T-cell accumulation and potentially predicting the degree of immune response against a tumor.
Thus far, most of these immuno-PET imaging agents have been engineered radiolabeled antibodies or antibody fragments against immune cell antigens. For example, Tavaré et al. recently demonstrated that a 89Zr-labeled antibody fragment against CD8—a cell surface marker of cytotoxic T cells—could specifically detect CD8-positive T cells in vivo with PET and noninvasively monitor the changes in these cytotoxic T-cell numbers after immunotherapy (84). In a separate study, in an effort to monitor the innate immune response, radiolabeled antibody fragments against class II major histocompatibility complex and CD11b were generated and, notably, could successfully detect tumor-infiltrating myeloid cells (85).
Although these PET tracers can provide valuable insight into the dynamics and localization of specific immune cell populations, they cannot directly inform on their activity. Metabolic tracers, such 18F-FDG, 18F-flourothymidine, and 18F-FAC (and their analogs), have shown utility in assessing immune cell activation (86,87); however, because tumor cells can also readily accumulate these probes, questions remain on whether these metabolic probes can distinguish tumor cells from infiltrating immune cells. Additional studies are required to determine which probes are best suited for a specific immunotherapeutic application. Thus, although the use of PET for oncologic immunotherapy applications is still in its infancy, there is great potential to incorporate PET imaging for drug and biomarker development into this burgeoning area of cancer research.
SUMMARY
Personalized medicine, with its emphasis on patient- and tumor-specific treatments, will require new assays for determining early in the course of a treatment whether that treatment is having the desired effect on the tumor. These assays should complement genomics and molecular testing and, ideally, be noninvasive, work across multiple sites in the body, and be coupled to the biology of the tumor. PET imaging provides an excellent platform on which to develop these assays. As PET tracers can be derived from several sources (e.g., metabolites, drugs, and proteins), one will be able to select the most appropriate PET assay for a particular drug.
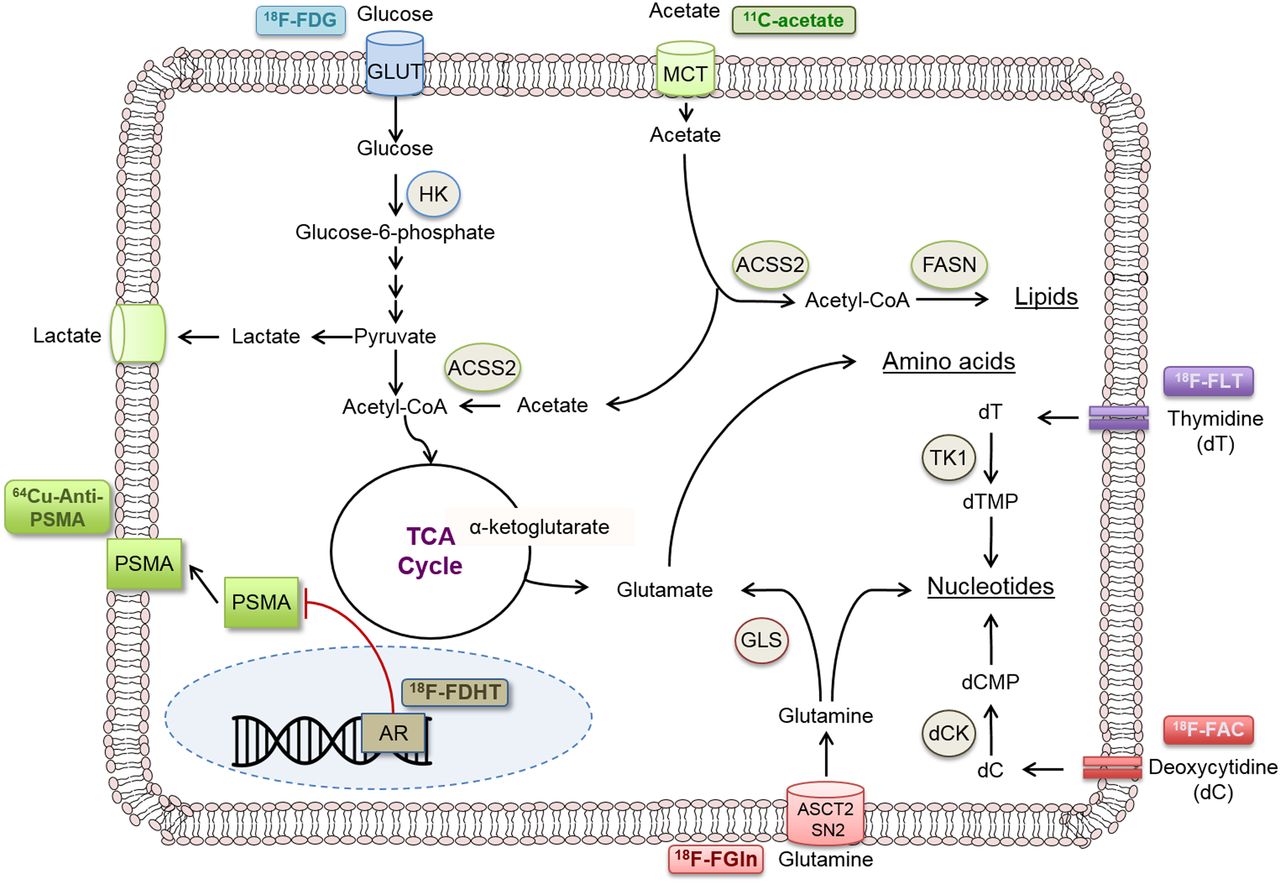
However, perhaps the most critical aspect of this approach is knowing what precisely the PET tracer is measuring. This knowledge requires insight into the biologic pathway that the probe is targeting (Fig. 5), which, in many cases, is still being reconciled. Additional studies are needed to connect the early effects of therapies on biologic pathways for which PET tracers have been developed as well as novel pathways for the development of new PET tracers. However, one can imagine a future in which every therapy has an accompanying assay to rapidly determine whether that therapy is having an effect on the individual patient’s tumor.

Selected PET probes for various functional tumorigenic (metabolic and other) pathways. CoA = coenzyme A; dC = deoxycytidine; dCMP = deoxycytidine monophosphate; dT = thymidine; dTMP = thymidine monophosphate; GLUT = glucose transporter; HK = hexokinase; TCA = tricarboxylic acid cycle; TK1 = thymidine kinase 1.
DISCLOSURE
No potential conflict of interest relevant to this article was reported.
Footnotes
Published online Apr. 6, 2017.
- © 2017 by the Society of Nuclear Medicine and Molecular Imaging.
REFERENCES
- 1.↵
- 2.↵
- 3.↵
- 4.↵
- 5.↵
- 6.↵
- 7.↵
- 8.↵
- 9.↵
- 10.
- 11.↵
- 12.↵
- 13.↵
- 14.↵
- 15.↵
- 16.↵
- 17.↵
- 18.↵
- 19.↵
- 20.↵
- 21.↵
- 22.↵
- 23.↵
- 24.↵
- 25.↵
- 26.↵
- 27.↵
- 28.
- 29.↵
- 30.↵
- 31.↵
- 32.↵
- 33.↵
- 34.↵
- 35.↵
- 36.↵
- 37.↵
- 38.
- 39.↵
- 40.↵
- 41.
- 42.↵
- 43.↵
- 44.↵
- 45.
- 46.↵
- 47.↵
- 48.↵
- 49.↵
- 50.↵
- 51.↵
- 52.↵
- 53.↵
- 54.↵
- 55.↵
- 56.↵
- 57.↵
- 58.↵
- 59.↵
- 60.↵
- 61.↵
- 62.↵
- 63.↵
- 64.↵
- 65.↵
- 66.↵
- 67.↵
- 68.↵
- 69.↵
- 70.↵
- 71.↵
- 72.↵
- 73.↵
- 74.↵
- 75.↵
- 76.↵
- 77.↵
- 78.↵
- 79.
- 80.↵
- 81.↵
- 82.↵
- 83.↵
- 84.↵
- 85.↵
- 86.↵
- 87.↵
- Received for publication February 15, 2017.
- Accepted for publication March 27, 2017.


