


Abstract
The significant presence of nontumor cell populations within tumors can complicate the assessment of in vivo tumor metabolism during therapy. To more clearly define the impact of cytotoxic agents, we compared early changes in the uptake of 6 PET tracers in cultured glioma cells. Doxorubicin (1 μmol/L), cisplatin (10 μmol/L), and 5-fluorouracil (10 mmol/L) were selected to target different aspects of cellular metabolism. Methods: The tracers were 2 extracellular σ-receptor ligands, 18F-FE-SA5845 (nonsubtype selective) and 11C-SA4503 (σ-1), the nucleoside 3′-deoxy-3′-18F-fluorothymidine (18F-FLT), 11C-choline, 11C-methionine, and 18F-FDG. C6 glioma cells were grown as monolayers and exposed to cytotoxic agents at concentrations at least 1 order of magnitude higher than the concentration for 50% growth inhibition of this cell line. Effects on cellular parameters were measured after 0, 1, 2, 3, 4, and 24 h. Results: All treatments resulted in a decline in cell numbers within 24 h. The binding of the σ-ligands 11C-SA4503 and 18F-FE-SA5845 and the uptake of 11C-choline (normalized for the number of viable cells) were strongly increased. The uptake of 18F-FDG showed little change, and cellular accumulation of 18F-FLT and 11C-methionine was decreased. Uptake of 18F-FLT and 11C-methionine was related to the fraction of cells in S-phase, but not under all conditions: (a) doxorubicin caused a more rapid decline in 18F-FLT uptake than in the S-phase fraction because of depletion of cellular adenosine triphosphate, and (b) cisplatin inhibited the transport of 11C-methionine across the tumor cell membrane. Conclusion: Increased binding of σ-ligands and an increased uptake of 11C-choline after chemotherapy may reflect active membrane repair in damaged cells. 18F-FLT and 11C-methionine behaved as proliferation markers. However, the accumulation of 18F-FDG reflected not the proliferation rate but, rather, the number of viable cells per well.
Although the most widely used radiopharmaceutical in clinical oncology is 18F-FDG, this glucose analog is not useful under all circumstances. High physiologic uptake of glucose in the healthy brain and strong accumulation of radioactivity in the urinary bladder limit the use of 18F-FDG for tumor detection in the central nervous system (1) and in the lower part of the abdomen (2). A high rate of false-positive lesions further restricts the use of 18F-FDG for certain applications (3,4). 18F-FDG is not tumor cell specific and it can also accumulate in other cells—for example, active macrophages (4). This lack of specificity is a pitfall in the monitoring of therapy control with 18F-FDG PET after chemotherapy (5). Thus, there is opportunity for the development of alternative imaging agents that lack some of the disadvantages of 18F-FDG.
11C- and 18F-labeled amino acids, nucleosides, and cholines have been developed as radiopharmaceuticals to target elevated synthesis of proteins, DNA, and biomembranes in malignant tissue (6,4,7–9). σ-Receptor ligands, which have been proposed as novel radiopharmaceuticals for tumor imaging, are also proliferation markers (10). These radiotracers track the synthesis of cell membrane lipids (11).
Oncologic tracers can be used not only for tumor detection but also for evaluation of the tumor response to treatment. Metabolic changes induced by chemotherapy precede the morphologic changes. Radiolabeled compounds that track different aspects of cell metabolism may show different uptake kinetics after therapy. The uptake of an ideal tracer would show a rapid change in responding tumors and the magnitude of this change would correspond to the final therapy outcome.
Various radiopharmaceuticals have been examined, comparatively, as early response indicators of chemotherapy. Sato et al. (12) measured uptake changes of 2 nucleosides (18F-5-fluoro-2′-deoxyuridine, 14C-thymidine), 1 amino acid (14C-methionine), and a glucose analog (3H-deoxyglucose) in rat glioma after in vivo chemotherapy with 1-(4-amino-2-methyl-5-pyrimidinyl)methyl-3-(2-chloroethyl)-3-nitrosourea (ACNU). Schaider et al. (13) monitored the uptake of 2 amino acids (3H-α-aminoisobutyric acid and l-[14C-methyl]methionine), a nucleoside (3H-thymidine), and a glucose analog (18F-FDG) in a human colon carcinoma cell line during in vitro chemotherapy with dinaline. Takeda et al (14) measured sequential changes in DNA synthesis, glucose use, protein synthesis, and peripheral benzodiazepine receptor density in C6 tumors within rat brain in vivo during chemotherapy with nitrosoureas. To the best of our knowledge, treatment responses of σ-receptor ligands have never been compared with those of established PET tracers (18F-FDG, 3′-deoxy-3′-fluorothymidine [18F-FLT], 11C-methionine) and of 11C-choline. Therefore, we decided to measure changes in the uptake of the σ-1 ligand 11C-SA4503 and the nonsubtype-selective σ-ligand 18F-FE-SA5845, 18F-FLT, 11C-choline, 11C-methionine, and 18F-FDG during 3 forms of chemotherapy in vitro.
A considerable (and unknown) fraction of the total mass of in vivo tumors consists of normal cells. Human breast cancers have been reported to contain 19%−64% of macrophages (15) and up to 10% of lymphocytes (16). Thus, nontumor cells may contribute significantly to the radioactive signal being measured and their presence complicates the assessment of changes in tumor metabolism during therapy. In vitro models contain only tumor cells. Changes in tracer uptake in these models are a more direct reflection of metabolic impact within tumor cells. Thus, in vitro data can be more easily interpreted than results from in vivo studies.
For our own in vitro chemotherapy model we used cisplatin, doxorubicin, and 5-fluorouracil, compounds that interact with DNA (17), topoisomerase II (18), and thymidylate synthetase (19), respectively. The agents were administered to C6 glioma cells in concentrations that were >1 order of magnitude greater than the concentration for 50% growth inhibition (GIC50) (20). The C6 line was chosen because it had also been used in our previous work on σ-ligands (21,22).
MATERIALS AND METHODS
Culture Media and Drugs
Cisplatin (cis-diammineplatinum(II) dichloride) was obtained from Sigma. Fluracedyl (5-fluorouracil solution, 50 mg/mL) and doxorubicin were purchased from Pharmachemie. Dulbecco's minimum essential medium (DMEM), fetal calf serum (FCS), and trypsin were from Invitrogen.
Radiopharmaceuticals
11C-Methionine, 11C-choline, 18F-FLT, and 18F-FDG were prepared by standard procedures reported in the literature (22). 18F-FE-SA5845 and 11C-SA4503 were prepared by reaction of 18F-fluoroethyl tosylate and 11C-methyl iodide, respectively, with the appropriate 4-O-methyl compound (23). All radiochemical purities were >95%.
Cell Culture and Treatment with Cytostatic Agents
C6 rat glioma cells obtained from the American Type Culture Collection were cultured in monolayers in DMEM supplemented with 5% FCS in a humidified atmosphere of 5% CO2/95% air at 37°C. Before each experiment, the cells were seeded in 12-well plates (Costar) with 1.3 mL of DMEM supplemented with 5% FCS per well. After 24 h at 37°C, monolayers were established. Cytotoxic agents (final concentration in culture medium: 1 μmol/L doxorubicin, 10 μmol/L cisplatin, 10 mmol/L 5-fluorouracil) were then added to the wells 24, 4, 3, 2, and 1 h before addition of radiotracer.
Incubation with Radiotracer
Experiments were performed in quadruplicate. Studies of radiotracer uptake were performed in monolayers grown at the bottom of 12-well plates. At time zero, 2 MBq of a radiotracer (11C-methionine, 11C-choline, 11C-SA4503, 18F-FDG, 18F-FLT, or 18F-FE-SA5485) in 50 μL of saline were added to each well. At the end of incubation (60 min), the medium was quickly removed and the monolayer was washed 3 times with chilled phosphate-buffered saline (PBS). Cells were then treated with 0.2 mL of trypsin. When the cells had detached from the bottom of the well (within 5 min), 1 mL of DMEM was added to stop the proteolytic action. Cell clumps were removed by repeated (at least 10-fold) pipetting of the trypsin/DMEM mixture. Radioactivity in the cell suspension (1.2 mL) was assessed using a γ-counter (Compugamma 1282 CS; LKB-Wallac). A 50-μL sample of the suspension was mixed with 50 μL of trypan blue (0.4% solution in PBS) and used for cell counting. Cell numbers were manually determined, using a phase-contrast microscope (Olympus), a Bürker bright-line chamber (depth, 0.1 mm; 0.0025-mm2 squares), and a hand-tally counter.
Propidium Iodide (PI) Staining and Flow Cytometric Analysis
C6 cells were grown and harvested as described; 2 wells from a 12-well plate were pooled. The cell samples were washed twice with PBS containing 5 mmol/L MgCl2. After each washing step, a cell pellet was collected by short centrifugation (5 min, 2,000 rpm; Hettich tabletop centrifuge). The washed cells were fixed in 2 mL of 80% ethanol/acetone (1:1, v/v) at 4°C for at least 18 h. Fixed cells were washed once with 5 mL PBS containing 5 mmol/L MgCl2 and the pellet was resuspended in 20 μL of DNase-free RNase A (Sigma) and incubated for 30 min at 37°C. At the end of the incubation, 400 μL PI (Sigma) was added (a solution of 10 μg/mL in PBS with 5 mmol/L MgCl2) and the mixture was stored in the refrigerator (4°C) for at least 18 h. Cellular DNA content was determined with a FACSCalibur (Becton Dickinson). Data were plotted using CellQuest software (Becton Dickinson); at least 5,000 events were analyzed for each sample.
Thymidine Kinase Assay
C6 cells were grown and harvested as described; 4 wells from a 12-well plate were pooled. A cell pellet was collected by a short centrifugation (as above). The pellet was resuspended in 0.5 mL of ice-cold lysis buffer (20 mmol/L Tris-HCl, pH 8.1, 40 mmol/L KCl, 1 mmol/L ethylenediaminetetraacetic acid, 10% glycerol, 1 mmol/L dithiothreitol (DTT), 1 mmol/L phenylmethylsulfonylfluoride, 1 μg/mL aprotinin). The cells were lysed by repeated sonication at 0°C. Cell and membrane fragments were removed from the lysate by centrifugation (Hettich Mikrofuge, 5 min, 12,000 ×g).
The enzyme reaction mixture (ERM) contained 80 mmol/L potassium phosphate buffer, pH 7.6, 160 mmol/L KCl, 100 mmol/L NaF, 4 mg/mL bovine serum albumin, 20 mmol/L adenosine triphosphate (ATP)-MgCl2, and 4 mmol/L DTT. Equal volumes of cell lysate (0.5 mL) and ERM (0.5 mL) were mixed and incubated with 2 MBq 18F-FLT in a closed glass vial for 60 min at 37°C. Two samples (50 μL) were taken from each vial and pipetted onto Whatman DE-81 filters. One filter remained untreated; the other filter was washed 3 times with a 4 mmol/L ammonium formiate solution and 3 times with ethanol. Radioactivity on the filters was determined with a γ-counter (as above). Activity on the washed filter represented 18F-FLT phosphates, whereas the activity on the untreated filter represented 18F-FLT phosphates plus unreacted 18F-FLT. A blank incubation (0.5 mL lysis buffer without C6 cells) was run in parallel during each experiment.
Preliminary experiments indicated that the thymidine kinase assay was linear for incubation times up to 90 min. Therefore, an incubation time of 60 min was chosen in subsequent experiments. Radioactivity in blank incubations was <3% of that in cell lysates after 60 min.
ATP Assay
Cellular ATP was measured with a kit based on firefly (Photinus pyralis) luciferase (ATPlite Luminescence ATP Detection Assay System; Perkin-Elmer). The bioluminescence was quantified using a Lumicount microplate luminometer (Packard Instruments Co.). A reaction blank and a standard curve with 7 concentrations of ATP were run in parallel. The assay was linear over a large range of ATP concentrations (5 × 10⁻⁹ to 10−6 mol/L) and of cell numbers in the assay. Samples were diluted to ensure that the concentration of ATP was within the range of the calibration curve.
Statistics
Differences between groups were examined using 1-way ANOVA. A P value < 0.05 was considered statistically significant.
RESULTS
Cell Number
The number of viable cells per well decreased as a result of chemotherapy. The 3 cytostatic agents inhibited cellular proliferation with different time courses (Fig. 1). The effect of doxorubicin (1 μmol/L) was relatively rapid. A statistically significant cell loss was already observed after 3 h of incubation, and a progressive decline (to 64% ± 2% of control; P < 0.0001) occurred between 3 and 24 h. Cisplatin (10 μmol/L) caused no significant decrease in cell numbers during the initial 4 h, but a highly significant cell loss (to 63% ± 3% of control; P < 0.0001) occurred between 4 and 24 h. Incubation of cells with 5-fluorouracil (10 mmol/L) caused a very rapid cell loss. Cell numbers decreased already within 1 h, and a very strong decrease (to 15% ± 2% of control; P < 0.0001) was observed after 24 h.
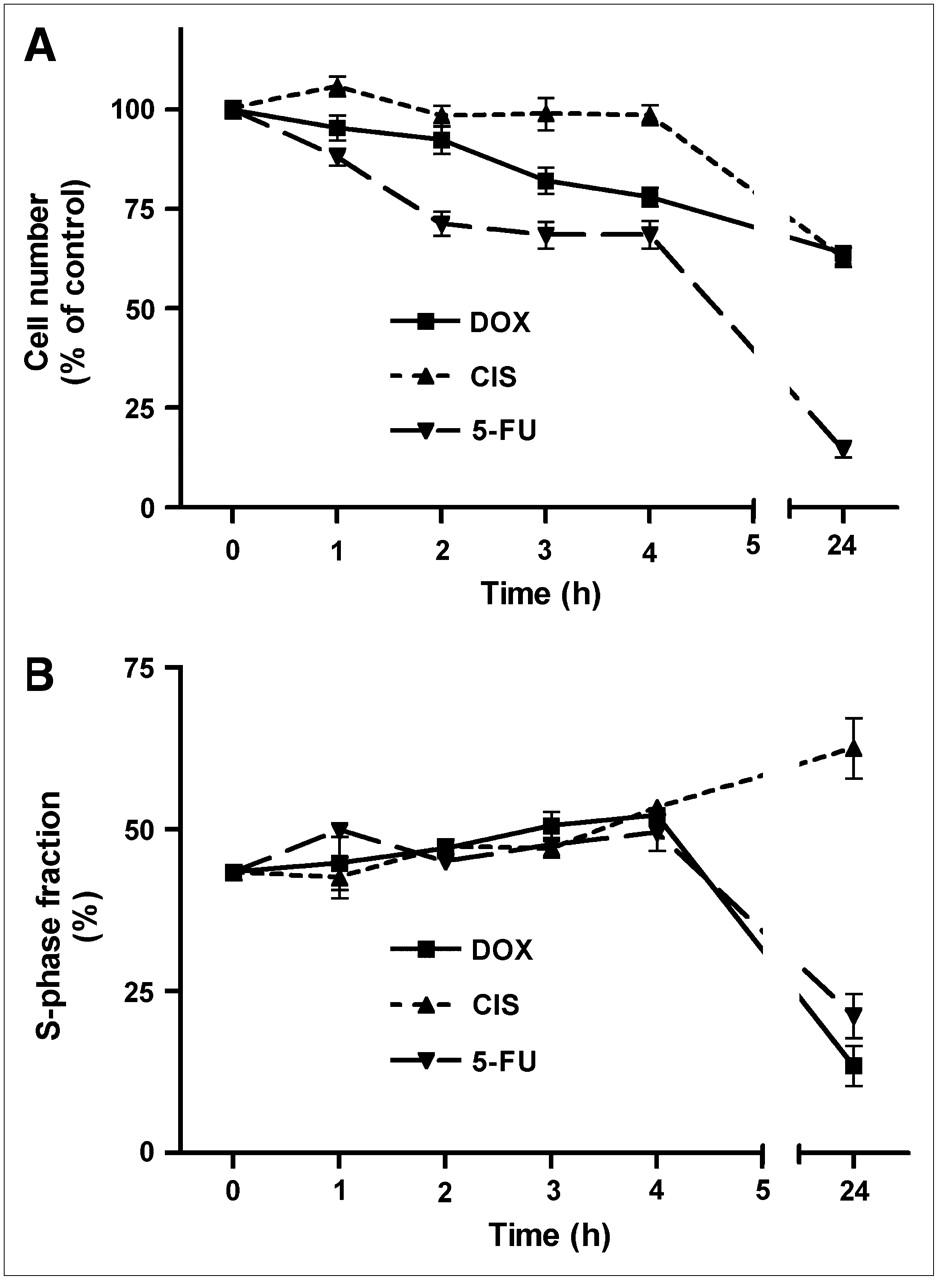
Decreases in cell number (A) and changes in S-phase fraction (B) after onset of chemotherapy. Data are plotted as mean ± SEM. DOX = doxorubicin; CIS = cisplatin; 5-FU = 5-fluorouracil.
Fraction of Cells in S-phase
The 3 cytostatic agents also had different effects on the fraction of cells in S-phase (Fig. 1). During the first 4 h of treatment, all compounds caused a slight increase in this parameter. However, whereas doxorubicin and 5-fluorouracil caused a significant decrease in the relative numbers of cells in S-phase after 24 h, cisplatin had the opposite effect (Fig. 1). The S-phase fraction was changed from 43% ± 1% at time zero to 14% ± 3% (doxorubicin; P < 0.0001), 63% ± 5% (cisplatin; P < 0.0005), and 21% ± 3% (5-fluorouracil; P = 0.0001) after 24 h of treatment.
11C-SA4503
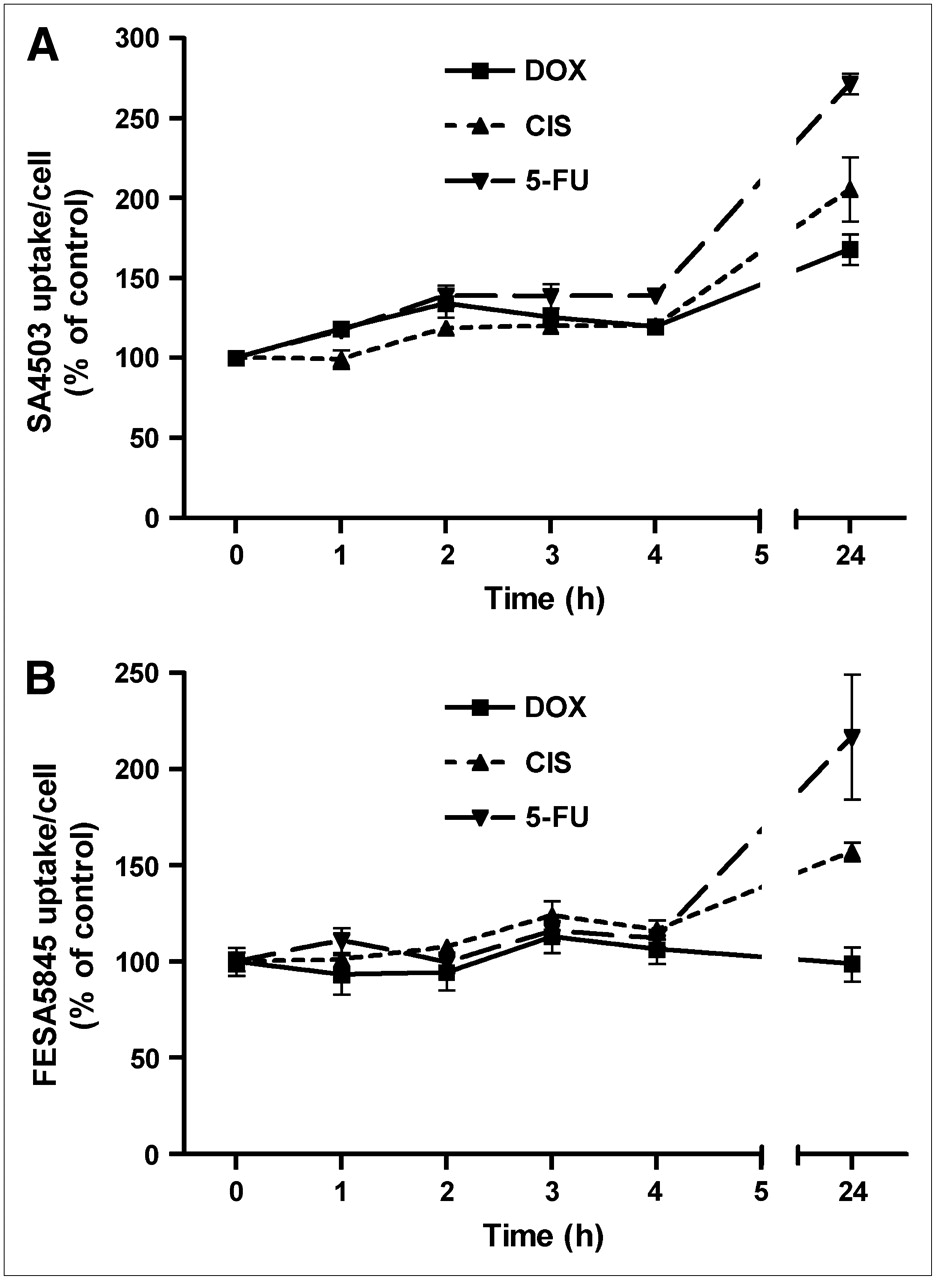
Cytostatic agents caused an increase in the binding of the σ-1 ligand 11C-SA4503 to C6 cells (Fig. 2). A statistically significant increase of tracer binding was already noted within 1 h of treatment with doxorubicin or 5-fluorouracil and within 2 h of incubation with cisplatin. After 24 h of treatment, SA4503 uptake per cell was increased to 168% ± 9% (doxorubicin; P = 0.0005), 206% ± 20% (cisplatin; P = 0.002), and 272% ± 7% of control (5-fluorouracil; P < 0.0001).

Cellular binding of σ-ligands 11C-SA4503 (A) and 18F-FE-SA5845 (B) during 24 h of chemotherapy. Data are plotted as mean ± SEM. DOX = doxorubicin; CIS = cisplatin; 5-FU = 5-fluorouracil.
18F-FE-SA5845
Cellular binding of the nonsubtype selective σ-ligand 18F-FE-SA5845 responded less strongly than that of the σ-1 agonist 11C-SA4503 to chemotherapy. During 24 h of treatment of cells with doxorubicin, the binding of 18F-FE-SA5845 per cell did not show any change (Fig. 2). However, a significant increase of 18F-FE-SA5845 binding was observed after 3, 4, and 24 h of treatment with cisplatin and after 24 h of incubation with 5-fluorouracil. 18F-FE-SA5845 binding was increased to 157% ± 5% (cisplatin; P = 0.0001) and 217% ± 32% of control (5-fluorouracil; P = 0.01) after 24 h of treatment.
11C-Choline
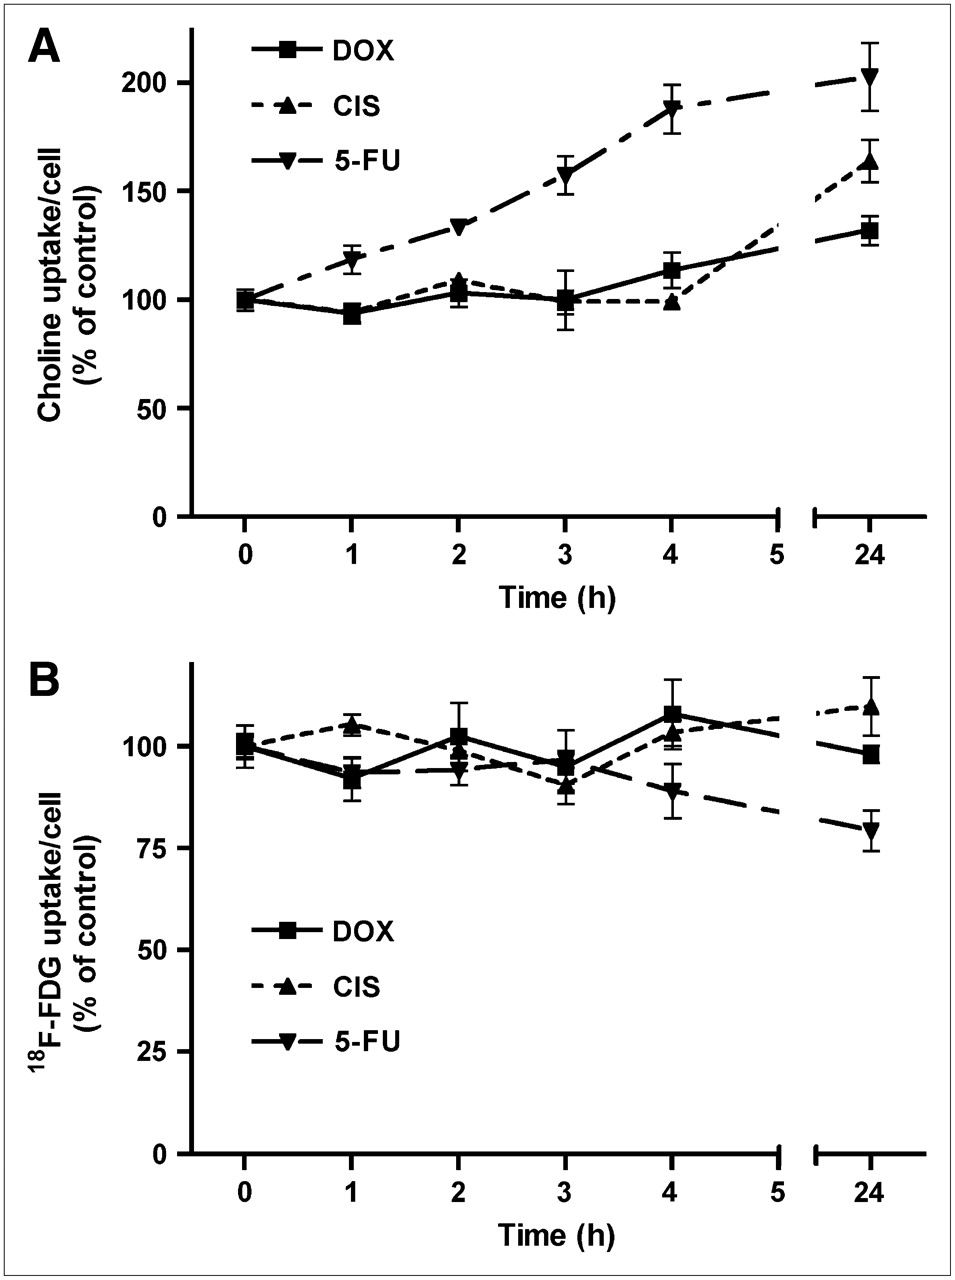
During the initial 4 h of treatment with doxorubicin and cisplatin, uptake of 11C-choline per viable cell remained constant, but a rapid increase (within 1 h) was induced by 5-fluorouracil (Fig. 3). 11C-Choline uptake was significantly increased by all treatments after 24 h, to 132% ± 7% (doxorubicin; P < 0.01), 164% ± 10% (cisplatin; P < 0.001), and 203% ± 16% of control (5-fluorouracil; P < 0.001).

Uptake of 11C-choline (A) and of 18F-FDG per cell (B) during 24 h of chemotherapy. Data are plotted as mean ± SEM. DOX = doxorubicin; CIS = cisplatin; 5-FU = 5-fluorouracil.
18F-FDG
During treatment of C6 cells with doxorubicin and cisplatin, uptake of 18F-FDG per cell remained constant throughout the entire study period (Fig. 3). After treatment with 5-fluorouracil, 18F-FDG uptake remained constant during the initial 4 h. However, this cytostatic agent induced a small decrease in 18F-FDG uptake after 24 h (to 79% ± 5% of control, P < 0.005; Fig. 3).
11C-Methionine
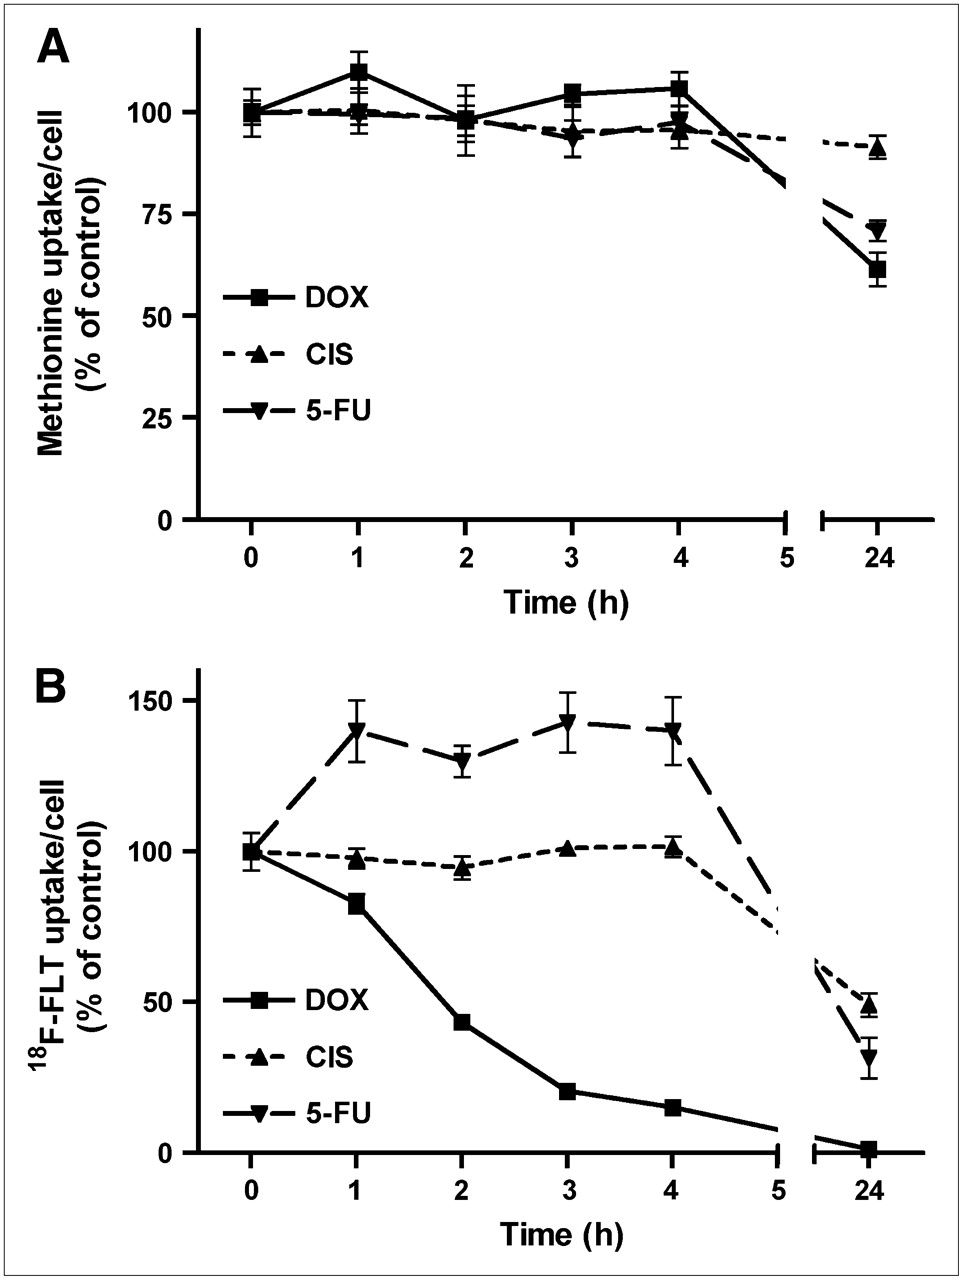
The uptake of 11C-methionine per cell was depressed by chemotherapy, although this was a relatively late effect (Fig. 4). During the initial 4 h of treatment with all cytostatic agents, cellular uptake of the amino acid remained constant. A statistically significant decline occurred after 24 h, to 62% ± 4% (doxorubicin; P < 0.002), 91% ± 3% (cisplatin; P = 0.05), and 71% ± 3% of control (5-fluorouracil, P < 0.005).

Uptake of 11C-methionine (A) and of 18F-FLT per cell (B) during 24 h of chemotherapy. Data are plotted as mean ± SEM. On some curves, error bars are within size of symbols and, therefore, are not visible. DOX = doxorubicin; CIS = cisplatin; 5-FU = 5-fluorouracil.
18F-FLT
Uptake of the nucleoside 18F-FLT showed the strongest response to chemotherapy of all studied PET tracers (Fig. 4). A rapid and significant decrease (within 1 h) was observed after treatment of cells with doxorubicin; after 24 h of treatment 18F-FLT uptake was almost completely suppressed (1.3% ± 0.2% of control; P < 0.0001). A less rapid decrease occurred during chemotherapy with cisplatin. 18F-FLT uptake was not significantly altered during the initial 4 h of cisplatin treatment, but a strong decrease (to 49% ± 4% of control; P < 0.0001) occurred after 24 h. Incubation of cells with 5-fluorouracil had a biphasic effect on cellular 18F-FLT uptake. During the initial 4 h of treatment, uptake of the nucleoside was significantly increased (from 100% ± 6% to 143% ± 10%; P = 0.01), but it was strongly depressed after 24 h (to 32% ± 7% of control; P = 0.0001).
Activity of Cellular Thymidine Kinase
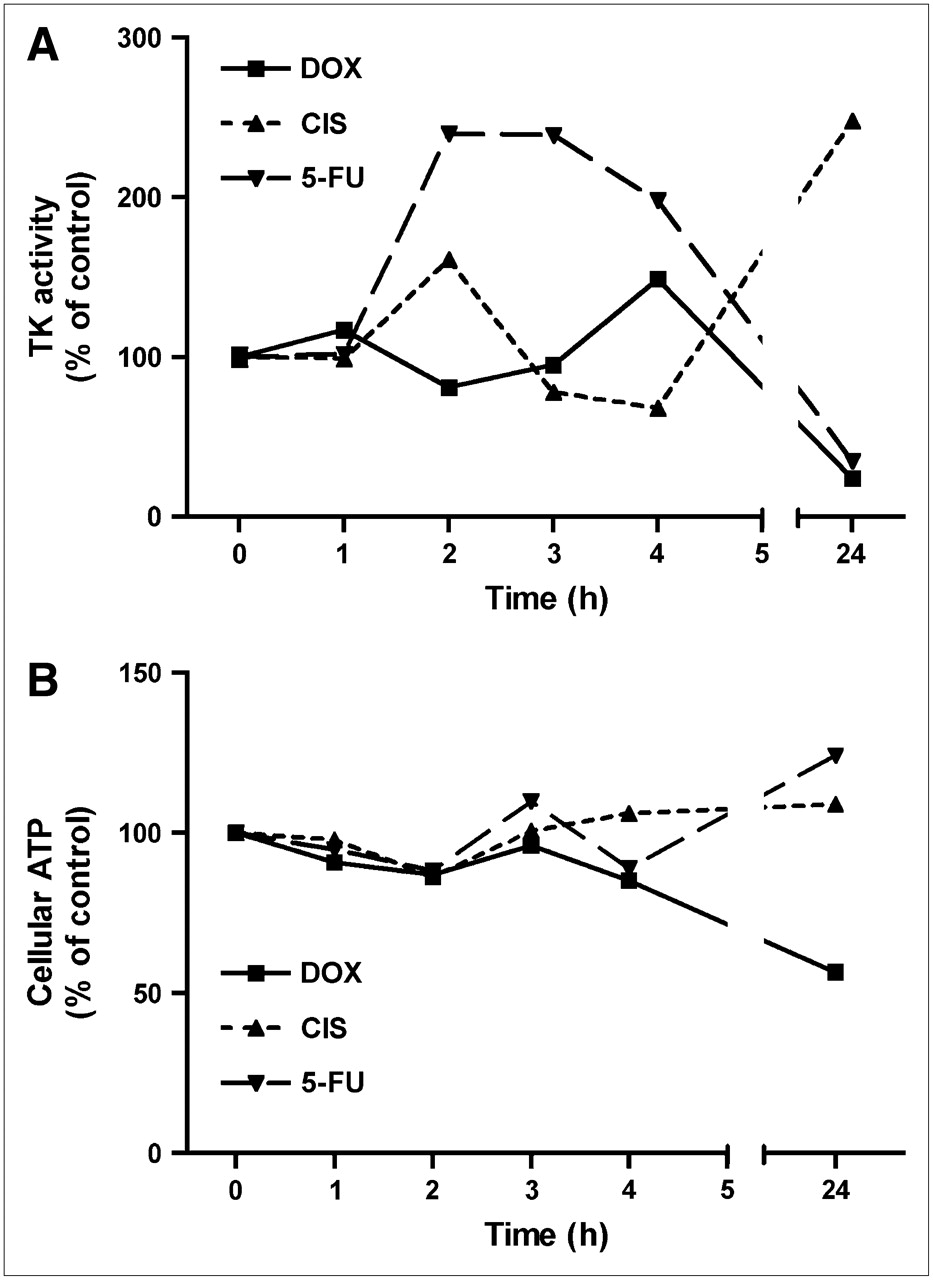
The activity of cellular thymidine kinase (normalized for the number of viable cells) showed a similar pattern of changes after 24 h of treatment with cytostatic agents as the fraction of cells in S-phase (Fig. 5). Doxorubicin and 5-fluorouracil caused a significant decrease in cellular thymidine kinase activity after 24 h (P < 0.0002 in both cases), whereas cisplatin caused an increase (P < 0.005; Fig. 5). There was much variability in the enzyme data after 2−4 h of treatment. 5-Fluorouracil induced a transient increase in enzyme activity during this period (P < 0.0001), followed by a subsequent decline (P < 0.0002; Fig. 5).

Effect of chemotherapy on activity of cellular thymidine kinase (TK) (A) and on cellular ATP content (B). Data are plotted as mean ± SEM. Error bars are within size of symbols. DOX = doxorubicin; CIS = cisplatin; 5-FU = 5-fluorouracil.
Cellular ATP Content
The amount of ATP per cell was decreased during 24 h of treatment with doxorubicin (to 60% ± 2% of control; P < 0.01) but was virtually unchanged after treatment with cisplatin and 5-fluorouracil (Fig. 5).
DISCUSSION
Cell Number
On the basis of the doses used, we expected a reduction in cell numbers after treatment of C6 cells with cytostatic agents. The dose of doxorubicin that we administered was >7 times higher than the GIC50 for this cell line (24). Doses of cisplatin and 5-fluorouracil were also an order of magnitude higher than those required for 50% growth inhibition (20,25). The reduction in the number of viable C6 cells that we observed after 24 h of treatment with cytostatic agents (Fig. 1) is very similar to values reported in the literature (20,26).
S-Phase Fraction
In our in vitro chemotherapy model, cytostatic agents had different effects on the fraction of cells in S-phase after 24 h. Doxorubicin and 5-fluorouracil decreased the S-phase fraction, in contrast to cisplatin (Fig. 1). Reports in the literature indicate that doxorubicin and 5-fluorouracil induce G2–M arrest (27) and combined G1/G2 arrest (28), respectively, with corresponding decreases in the fraction of cells in S-phase. In contrast, cisplatin initially blocks C6 cells in the S-phase, resulting in a transient increase in the S-phase fraction. Only after longer periods of treatment with cisplatin (≥3 d), a fair number of cells are blocked at the premitotic G2-phase of the cell cycle (26).
Tracer Response to Treatment
Three responses of tracer uptake to chemotherapy were observed in the current study: (a) increased uptake (σ-ligands 11C-SA4503 and 18F-FE-SA5845, 11C-choline; Figs. 2 and 3), (b) relatively little change in cell-specific uptake (18F-FDG; Fig. 3), and (c) decreased uptake (11C-methionine, 18F-FLT; Fig. 4).
To our knowledge, there are no published reports about changes in uptake of σ-ligands in tumors or tumor cells after chemotherapy. Our data indicate that the cellular uptake of these tracers is initially increased (Figs. 2 and 3). The increased uptake of σ-ligands (and of 11C-choline) may be related to an enhancement of lipid synthesis caused by repair mechanisms (11). 11C-SA4503 and 18F-FE-SA5845 have different subtype selectivities and, therefore, may show different tracer kinetics. 11C-SA4503 binds to the σ-1 subtype only, whereas 18F-FE-SA5845 has considerable affinity to both σ-1 and σ-2 receptors (23). The stronger increase of 11C-SA4503-uptake than of 18F-FE-SA5845-uptake after chemotherapy (Fig. 2) suggests that the σ-1 and σ-2 receptor populations respond differently to treatment with cytostatic agents.
A study in the literature has indicated that radiolabeled choline is not very suitable for evaluation of cytotoxic effects as the uptake of 3H-choline (and also of 18F-FDG) in prostate tumor cells did not show any decrease after treatment of the cells with 2-methoxyestradiol (29). Our own data indicate that uptake of 11C-choline in C6 cells is increased after 24 h of antitumor therapy in contrast to that of the proliferation marker 18F-FLT (Figs. 3 and 4).
A relatively small response of 18F-FDG uptake to chemotherapy, compared with the response of radiolabeled nucleosides, has often been reported. In murine RIF-1 tumors, the 5-fluorouracil–induced reduction in 18F-FLT uptake was more rapid and significantly more pronounced than that of 18F-FDG (30). Similar observations were made in a hormone-responsive rat tumor model, using radioiodinated 5-iodo-2′-deoxyuridine and 3H-deoxyglucose (31). In OSC-1 tumor cells grown in vitro, cisplatin induced a significant and dose-dependent reduction in the uptake of 18F-FLT, whereas the uptake of 18F-FDG was unchanged after 24 h (32). Fleischmannova et al. (33) observed a 54% decline in the uptake of 3H-thymidine in C6 rat glioma cells after 20 h of treatment with 10 μg cisplatin/mL, close to the value that we observed for 18F-FLT (Fig. 4).
Because the uptake of 18F-FDG per cell showed little change during most forms of chemotherapy (Fig. 3), 18F-FDG appeared to trace the number of viable cells per well rather than the proliferative rate of the cells. Higashi et al. (34) reached the same conclusion in a human ovarian adenocarcinoma cell line. 18F-FDG uptake was largely unchanged as carcinoma cells progressed through the growth cycle, but cellular 3H-thymidine uptake decreased when the cells progressed from the lag phase to the plateau phase. The authors concluded that, in their cell line, 18F-FDG measured a substantially different parameter (viable cell number) than 3H-thymidine (proliferative rate). Rasey et al. (35) reported a much greater variation in the uptake of 18F-FLT than of 14C-deoxyglucose as a function of the growth rate in human lung carcinoma cells.
Sato et al. (12) studied changes in the uptake of 2 radiolabeled nucleosides, one amino acid and a glucose analog in a rat glioma (KEG-1) after chemotherapy. They observed an immediate, sharp fall in nucleoside uptake (18F-5-fluoro-2′-deoxyuridine and 14C-thymidine), a moderate fall in the uptake of 14C-methionine and, only after a long interval (>1 wk), any decline in the uptake of 3H-deoxyglucose after treatment of the animals with ACNU. These findings are very similar to our own in vitro observations (Figs. 3 and 4).
S-Phase Fraction and Tracer Uptake
We observed a significant correlation between the uptake of 11C-methionine after treatment of cells with doxorubicin or 5-fluorouracil and the fraction of cells in S-phase (n = 11; r = 0.94; P < 0.0001). However, this correlation did not hold for 11C-methionine uptake after cisplatin treatment. The increase in the S-phase fraction after cisplatin treatment was not accompanied by an increased cellular uptake of 11C-methionine (compare Figs. 1 and 4). The aberrant behavior of 11C-methionine uptake after cisplatin treatment can be attributed to the fact that cisplatin inhibits not only cell division but also the transport of amino acids across the tumor cell membrane. This side effect of cisplatin treatment has been noted previously, using 14C-methionine and L1210 murine leukemia cells (36) or C6 and P388 tumors grown in rats in vivo (37,38).
18F-FLT uptake after 0, 1, 2, 4, and 24 h of treatment of cells with 5-fluorouracil and after 24 h of treatment with doxorubicin also showed a significant relationship with the fraction of cells in S-phase (n = 7; r = 0.99; P < 0.0001). This observation is in accordance with studies in the literature that reported close, or fairly close, correlations between the fraction of tumor cells in S-phase and the cellular uptake of 18F-FLT (35,39). However, we did not observe any correlation between 18F-FLT uptake and the S-phase fraction after treatment of C6 cells with cisplatin or after 1, 2, 3, or 4 h of incubation with doxorubicin. Under such conditions, uptake of the nucleoside was reduced in contrast to the S-phase fraction, which remained high (compare Figs. 1 and 4). Cellular trapping of 18F-FLT is dependent on the activity of thymidine kinase 1 (TK1) (35,40). The activity of this enzyme is determined not only by the fraction of cells in S-phase and the corresponding level of TK1 expression but also by the availability of the cofactor ATP (30). Decreased trapping of 18F-FLT in the presence of a continuing high expression of the TK1 protein may occur in tumor cells when cellular ATP levels fall (30). A bioluminescence assay that we performed indicated that cellular ATP content was decreased after treatment of C6 cells with doxorubicin but not after treatment with cisplatin or 5-fluorouracil (Fig. 5). Thus, the effect of doxorubicin on 18F-FLT uptake may be related to depletion of the cellular ATP pool in the presence of the cytostatic agent, but the mechanism of the cisplatin effect is as yet unknown. Cisplatin may interfere not only with amino acid transport but also with the transport of nucleosides across the tumor cell membrane (35).
No correlation was observed between the cellular uptake of 11C-choline, 11C-SA4503, 18F-FDG, or 18F-FE-SA5845 and the fraction of cells in S-phase under the conditions of this study.
CONCLUSION
The 6 PET tracers that we studied showed different uptake kinetics after therapy. Increased binding of σ-ligands and an increased uptake of 11C-choline may reflect active membrane repair in damaged cells. Uptake of 18F-FLT and 11C-methionine showed a decline; these tracers acted as proliferation markers. Accumulation of 18F-FDG reflected not proliferation rate, but the number of viable cells per well.
Cellular uptake of the nucleoside 18F-FLT and binding of the σ-1 receptor ligand 11C-SA4503 showed the most rapid changes after the onset of chemotherapy. On the basis of these data from an in vitro model, 18F-FLT appears more suitable as an early predictor of therapeutic response than 18F-FDG. If rapid increases in the binding of 11C-SA4503 are also observed in vivo and are related to the final therapy outcome, 11C-SA4503 may be useful for therapy monitoring and may provide information complementary to 18F-FLT.
Acknowledgments
We thank Geert Mesander (Pathology and Laboratory Medicine, University Medical Center Groningen [UMCG]) for skillful assistance during the flow cytometric analysis and Annelies Draaisma (Pharmacokinetics and Drug Delivery, UMCG) for help with the bioluminescent ATP assay.
Footnotes
-
COPYRIGHT © 2006 by the Society of Nuclear Medicine, Inc.
References
- Received for publication March 30, 2006.
- Accepted for publication May 15, 2006.


Jump to section
Related Articles
Cited By...
- Radiopharmaceuticals in Preclinical and Clinical Development for Monitoring of Therapy with PET
- Evaluation of D-18F-FMT, 18F-FDG, L-11C-MET, and 18F-FLT for Monitoring the Response of Tumors to Radiotherapy in Mice
- Cytotoxicity of {sigma}-Receptor Ligands Is Associated with Major Changes of Cellular Metabolism and Complete Occupancy of the {sigma}-2 Subpopulation
- Imaging of Cell Proliferation: Status and Prospects
- Treatment of Breast Tumor Cells In Vitro with the Mitochondrial Membrane Potential Dissipater Valinomycin Increases 18F-FDG Incorporation
- Rapid Reduction of {sigma}1-Receptor Binding and 18F-FDG Uptake in Rat Gliomas After In Vivo Treatment with Doxorubicin