


Abstract
σ-Receptors are strongly overexpressed in most rodent and human tumors and are proliferation markers. To evaluate the potential of a radiolabeled σ1-ligand for therapy monitoring, we compared early changes of 11C-1-(3,4-dimethoxyphenethyl)-4-(3-phenylpropyl)piperazine (11C-SA4503) binding and 18F-FDG uptake in gliomas after in vivo chemotherapy. Methods: C6 cells (2.5 × 10⁶) were subcutaneously injected into the right shoulder of male Wistar rats. After 7 d, the tumor volume was 0.60 ± 0.08 cm3. Animals then received either saline or doxorubicin (8 mg/kg, intraperitoneally). One control and 1 treated rat were imaged simultaneously, 24 or 48 h after treatment, under pentobarbital anesthesia. Rodents (n = 20) were scanned first with 11C-SA4503 (25 MBq, intravenously) followed more than 100 min afterward by 18F-FDG (20 MBq, intravenously), using a dedicated small-animal PET camera (60-min protocol, tumors in the field of view). Tumor homogenates were prepared and subjected to σ-receptor assays. The biodistribution of 18F-FDG was assessed. Results: Tumors appeared 4–5 d after inoculation and grew exponentially. No significant reduction of tumor growth was visible within 48 h after doxorubicin treatment. Both PET tracers visualized the tumors and showed reduced uptake after chemotherapy (11C-SA4503: 26.5% ± 6.5% at 24 h, 26.5% ± 7.5% at 48 h; 18F-FDG: 22.6% ± 3.2% at 24 h, 27.4% ± 3.2% at 48 h; ex vivo 18F-FDG: 22.4% ± 5.4% at 24 h, 31.7% ± 12.7% at 48 h). σ1-Receptor density in treated tumors was also reduced (from 172 ± 35 to 125 ± 28 fmol/mg of protein). Conclusion: Both 11C-SA4503 binding and 18F-FDG uptake declined in gliomas after chemotherapy. Decreased binding of 11C-SA4503 corresponded to a loss of σ1-receptors from the tumors. Changes in tracer uptake preceded the morphologic changes by at least 48 h.
Sigma receptors are a unique class of binding sites in the brain, liver, and kidney and in endocrine, immune, and reproductive tissues. Both the σ1- and the σ2-subtypes are strongly overexpressed in tumors and tumor cell lines (1–3). Antagonists for σ1-receptors and agonists for σ2-receptors may be used as antineoplastic agents (4–6). σ1-Receptor antagonists are cytotoxic and trigger caspase-dependent apoptosis. These compounds may be a novel approach to the treatment of cancer, because in therapeutic doses they have few side effects (3,5,6). σ2-Agonists can induce cellular apoptosis via a caspase-independent mechanism (7–9). By decreasing the expression of P-glycoprotein, which acts as an efflux pump for antitumor agents, σ2-agonists may also increase the efficacy of chemotherapy in tumor cells (4,9).
Expression of both subtypes of σ-receptors in tumor cells and in solid tumors is related to cellular proliferation (3,10,11). A recent study on a large number of human cell lines showed that cancer cells express much higher levels of σ1-receptors than do corresponding noncancerous cells (3). Across all cell lines tested, the normal cells possessed the lowest levels of σ1-receptor whereas the most metastatic cell lines had the highest levels of σ1-receptor expression (3). In normal cells, σ1-antagonists, σ2-agonists, and a σ1-receptor–silencing construct were ineffective, but in cancer cells, such compounds significantly inhibited proliferation and cellular adhesion (3). Some investigators have claimed that the σ1-receptor is an interesting new marker to identify patients with primary breast carcinomas who could benefit from an adjuvant therapy (12).
Patient response to anticancer treatment may be assessed by measuring tumor shrinkage, using ultrasound, CT, or MRI. However, tumor volume changes may not occur until several weeks or even months after the start of the therapy. Quick decisions on treatment modification in nonresponders cannot be based on measurements of tumor volume only. Because biochemical changes in tumors generally precede the anatomic changes, nuclear medicine techniques may provide important data for therapy evaluation. Positron-emitting σ-ligands may be useful for detecting and staging tumors, monitoring the effects of chemotherapy, and predicting the therapeutic outcome. Preclinical studies of our group have indicated that σ-ligands show greater tumor selectivity (13) and more rapid changes of cellular uptake after in vitro therapy (14) than does the established PET tracer 18F-FDG. However, no data were published on the use of radiolabeled σ-ligands for imaging tumor response in vivo. We therefore examined changes in the binding of a σ1-ligand, 11C-1-(3,4-dimethoxyphenethyl)-4-(3-phenylpropyl)piperazine (11C-SA4503), in an in vivo model with high expression of σ-receptors, the C6 rat glioma, after treatment of animals with the cytotoxic agent doxorubicin.
MATERIALS AND METHODS
Materials
11C-SA4503 was made by reaction of 11C-methyl iodide with the appropriate 4-O-methyl compound (15). The decay-corrected radiochemical yield was 9%–11%, and the specific radioactivity was greater than 11 TBq/mmol at the time of injection. 18F-FDG was prepared by the Hamacher method (nucleophilic fluorination reaction followed by deprotection). The specific radioactivity was always more than 10 (usually between 50 and 100) TBq/mmol. All radiochemical purities were greater than 95%.
Animal Model
C6 glioma cells (2.5 × 10⁶, in a 1:1 mixture of Matrigel [Becton Dickinson] and Dulbecco's minimal essential medium with 7.5% fetal calf serum) were subcutaneously injected into the right shoulder of male Wistar rats. The body weight of the animals and tumor volume, measured with calipers in 3 dimensions, were scored 2, 5, 6, 7, 8, and 9 d after inoculation. On day 7, the tumor volume was 0.60 ± 0.08 cm3 (mean ± SEM). Control animals were then injected with saline (carrier, 1 mL, intraperitoneally), whereas treated animals received doxorubicin (8 mg/kg of body weight, in 1 mL of saline). The animal experiments were performed by licensed investigators in compliance with the Law on Animal Experiments of The Netherlands. The protocol was approved by the Committee on Animal Ethics of the University of Groningen. Twenty animals were used in total (5 for each time point of the control and treated groups). The rats were maintained at a regime of 12 h of light and 12 h of dark and were fed standard laboratory chow ad libitum.
PET Scanning
All rats were scanned 24 or 48 h after treatment (i.e., on day 8 or 9 after inoculation, n = 5 in each group), under anesthesia with sodium pentobarbital (60 mg/kg of body weight, intraperitoneally). We used pentobarbital rather than ketamine because ketamine (particularly the R-enantiomer) binds to σ-receptors and reduces the target-to-nontarget ratios of σ-ligands (16). A catheter for tracer injection was placed into a lateral tail vein. One control and 1 treated rat were scanned simultaneously in each scan session. The 2 animals were maintained in a fixed position and scanned first with 11C-SA4503 (25 MBq, intravenously), followed after more than 5 half-lives of 11C by 18F-FDG (20 MBq, intravenously). The tracers were administered as a 0.3- to 0.5-mL bolus via the indwelling venous catheter. The doxorubicin-treated rat was injected first, followed after 0.5 min by the saline-treated animal. The camera (microPET Focus 220; Siemens/Concorde) was started during injection of the doxorubicin-treated rat. A list-mode protocol was used (60 min, tumors in the field of view).
List-mode data were reframed into a dynamic sequence of 4 × 60 s, 3 × 120 s, 4 × 300 s, and 3 × 600 s frames. The data were reconstructed per time frame using an iterative reconstruction algorithm (2-dimensional ordered-subsets expectation maximization). The final datasets consisted of 95 slices with a slice thickness of 0.8 mm, and an in-plane image matrix of 128 × 128 pixels of size 1 × 1 mm2. Datasets were fully corrected for random coincidences, scatter, and attenuation. A separate transmission scan was acquired for attenuation correction.
Three-dimensional regions of interest were manually drawn around the entire tumor, brain, and peripheral area of the right lung, avoiding hilar structures. Unlike the liver metastasis rat model reported previously (17), the tumor-to-background contrast in the present animal model was sufficiently high, and the profile near the edges sufficiently steep, to obtain hand-drawn contours with good accuracy. Time–activity curves and volumes (cm3) for the regions of interest were calculated, using standard software (AsiPro VM 6.2.5.0; Siemens-Concorde). Time–activity curves were normalized for body weight and injected dose as indicated in the figure legends. Tumor uptake of radioactivity (mean value in kBq/cm3) was calculated using data from the 3 last frames of each scan.
Biodistribution of 18F-FDG
After the scanning period, the anesthetized animals were terminated. Blood was collected, and plasma and a cell fraction were obtained from the blood sample by short centrifugation (5 min at 1,000g). Several tissues (Table 1) were excised. The complete tumor was removed and separated from muscle and skin. All tissue samples were weighed. One half of the tumor was used for γ-counting, and the other half for in vitro assays of σ-receptor density. Radioactivity in tissue samples was measured using a CompuGamma CS 1282 counter (LKB-Wallac), applying a decay correction. The results were expressed as dimensionless standardized uptake values, which are defined as [tissue activity concentration (MBq/g) × body weight (g)/injected dose (MBq)].
Biodistribution of 18F-FDG After Treatment
In Vitro Assays of σ-Receptor Density
Weighed tumor samples were kept on ice after biopsy and homogenized as soon as possible in a 10-fold volume of chilled sucrose buffer (50 mM Tris-HCl, pH 7.4, containing 0.32 M sucrose), using an Ultra-Turrax mixer (ILA Innovative Laborarmaturen GmbH). The homogenates were stored in a low-temperature freezer at −80°C. After the end of the experiment, the samples were used for σ-receptor assays.
σ1-Receptor binding was assessed by incubating rat tumor membranes (500–750 μg of protein) in triplicate with various concentrations of 3H-(+)-pentazocine in 0.5 mL of 50 mM Tris-HCl (pH 7.8) for 90 min at 37°C. Nonspecific binding was determined in the presence of 10 μM (+)-pentazocine.
σ2-Receptor assays were performed by incubating tumor membranes in triplicate with various concentrations of 3H-1,3-di-(2-tolyl)guanidine in 0.5 mL of 50 mM Tris-HCl (pH 7.8) for 90 min at 37°C, in the presence of 1 μM (+)-pentazocine to mask σ1 sites. Nonspecific binding was determined in the presence of 10 μM 3H-1,3-di-(2-tolyl)guanidine and 1 μM (+)-pentazocine.
At the end of incubation, the samples were quickly diluted with buffer, passed through glass-fiber filters (GF/B; Whatman) and washed twice with ice-cold buffer. The level of bound radioactivity retained on the filter was measured in a γ-scintillation counter (ARC-600; Aloka). Affinity (Kd) and receptor density (Bmax) values in saturation binding studies were calculated with the Prism computer program (GraphPad Software, Inc.).
Statistical Analysis
Differences between groups were tested with the 2-sample t test. A dual-tail probability of less than 0.05 was considered statistically significant.
RESULTS
Gain of Body Weight and Tumor Growth
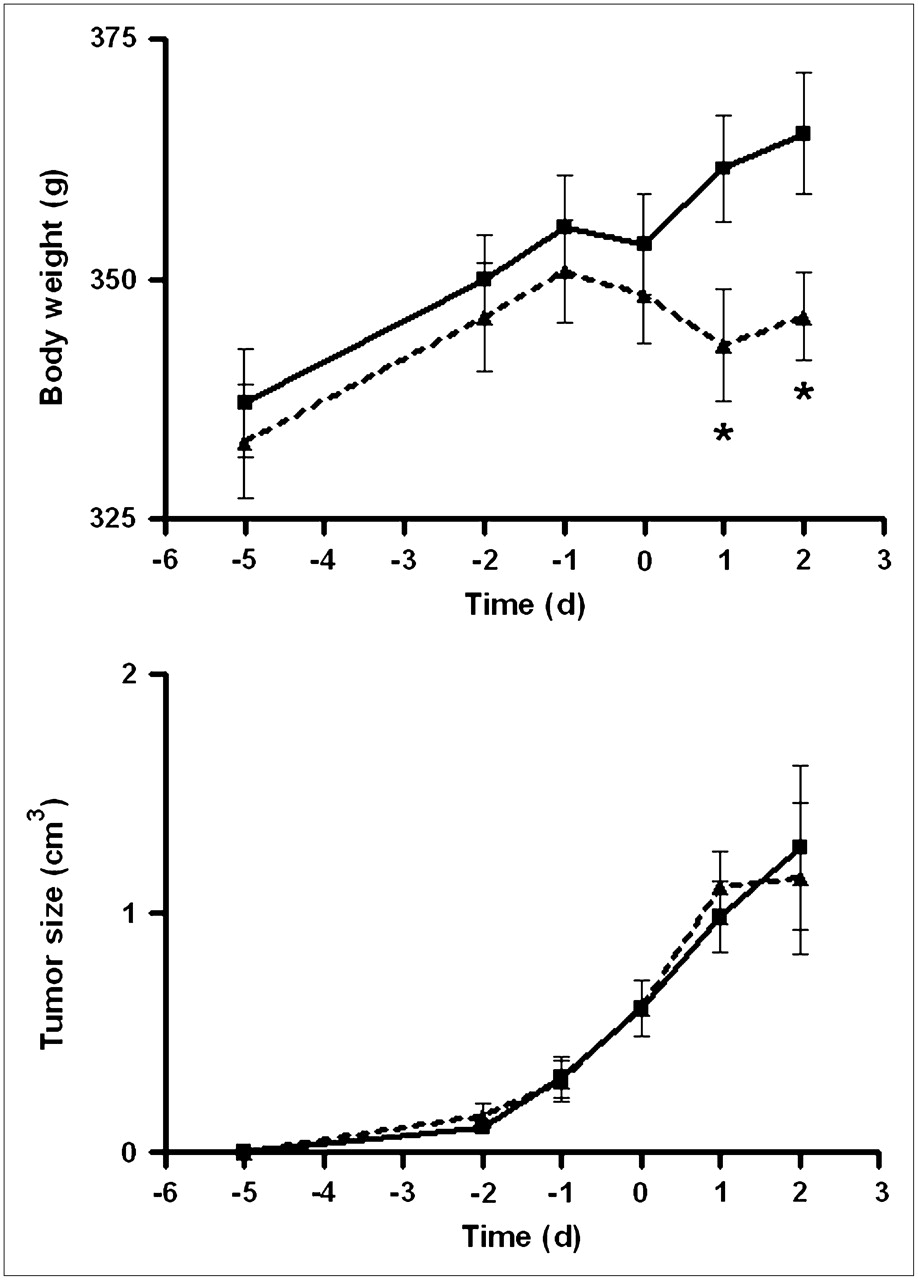
The body weight of saline-treated rats showed a steady increase (from 337 ± 6 g on day 2 to 365 ± 6 g on day 9 after inoculation, mean ± SEM; Fig. 1). In doxorubicin-treated rats, body weight increased until the day of treatment (from 333 ± 6 g on day 2 to 348 ± 5 g on day 7) but remained steady thereafter (345 ± 6 g on day 9). In both groups, tumors appeared 4–5 d after inoculation and grew exponentially. No significant reduction of tumor growth occurred within 48 h in doxorubicin-treated rats.

Increase of body weight and growth of C6 tumors during experiments. Day zero is time of treatment with saline or doxorubicin. Dotted line connects data points of doxorubicin-treated rats; solid line, those of saline-treated group. Differences between groups (t test, P < 0.05) are indicated by asterisks.
Tumor Visualization on PET
All tumors were well visualized, both by the σ1-ligand 11C-SA4503 and by the glucose analog 18F-FDG (Fig. 2). The distribution of the 2 tracers within the tumors was heterogeneous and generally lower in central necrotic areas than at the tumor rim. However, areas of the tumor volume with high metabolic activity (i.e., high 18F-FDG uptake) and areas with elevated binding of the σ1-ligand did not always match. A clear example of a discrepancy between glucose consumption and 11C-SA4503 binding is presented in Figure 2. These scans were made of an animal from the saline-treated control group.
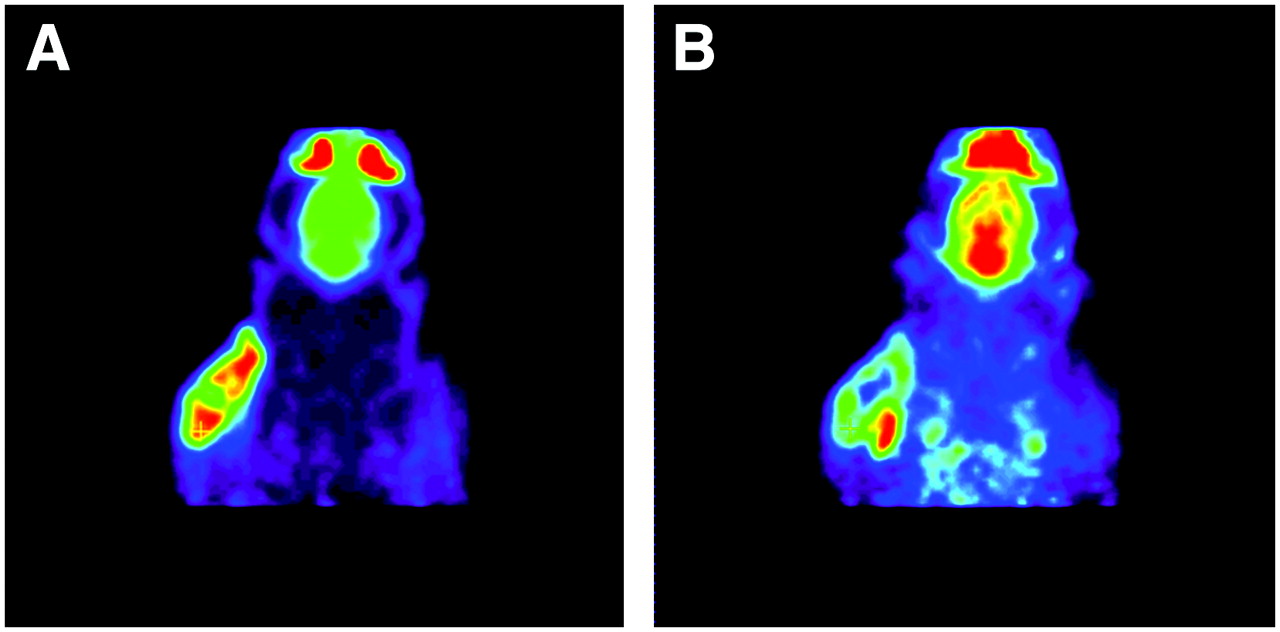
Images of same plane of same rat obtained with 18F-FDG PET (A) and 11C-SA4503 PET (B). Images are summed data from 1 to 60 min after injection. Tumor is well visualized by both tracers, but areas with strong 18F-FDG uptake and those with elevated binding of σ1-receptor ligand do not match. Active areas in scans, from top to bottom, are nasal epithelium and Harderian glands, brain, and tumor.
Regional differences in the cerebral uptake of 18F-FDG were small because of the pentobarbital anesthesia. In contrast, local differences in 11C-SA4503 uptake could be readily observed (Fig. 2).
Tumor volumes estimated from 11C-SA4503 PET images were generally 20%–25% larger than volumes estimated from 18F-FDG PET because of the fact that 11C-SA4503 binding but not 18F-FDG uptake was observed in tissue areas outside but close to the tumor (Figs. 2 and 3). Plots of tumor uptake of radioactivity versus tumor size indicated higher 11C-SA4503 binding and 18F-FDG uptake in tumors from saline-treated animals than in tumors from doxorubicin-treated rats. The difference was most striking at tumor sizes greater than 1 cm3.
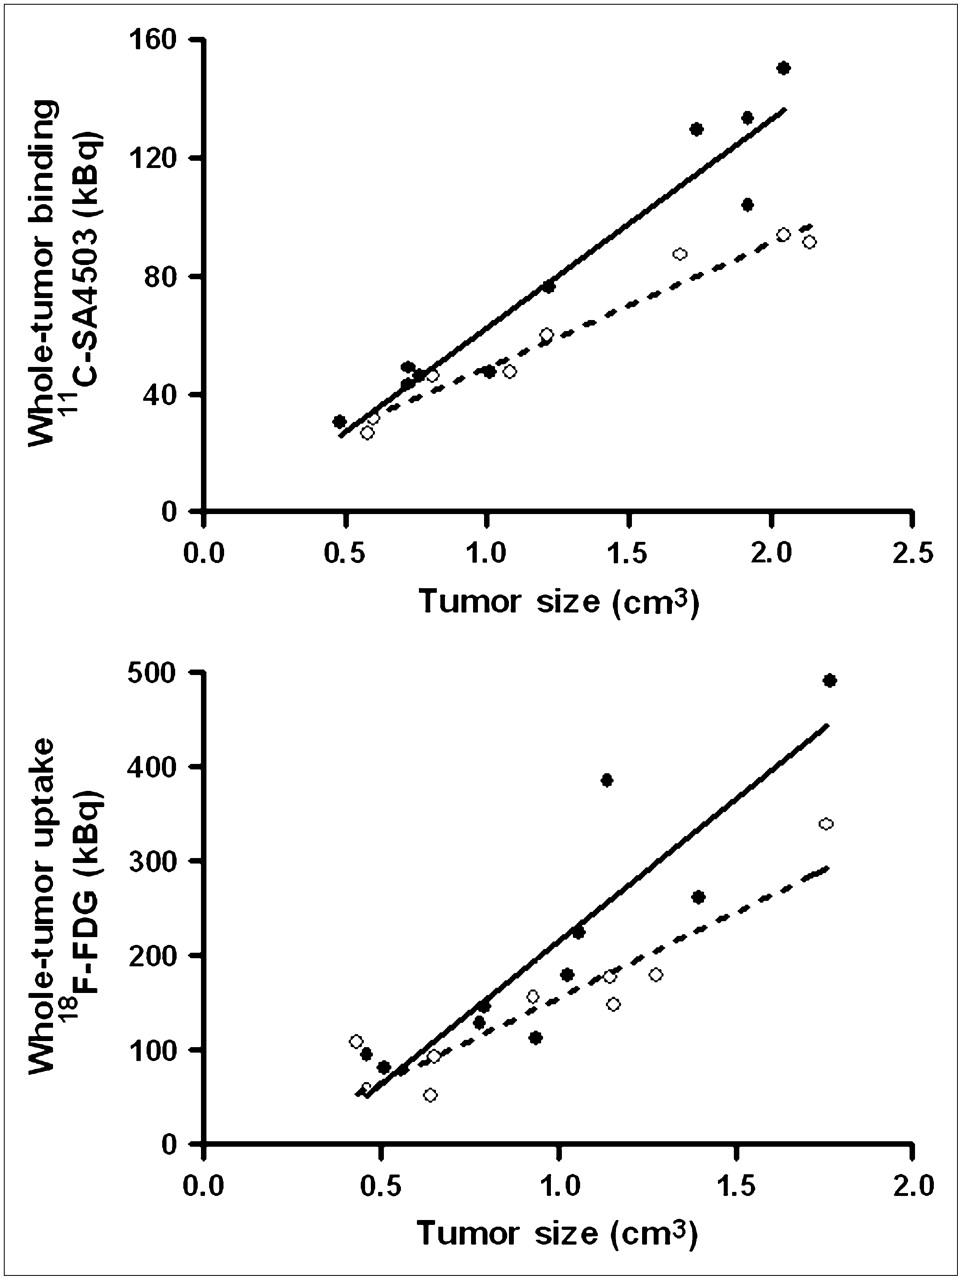
Total uptake of radioactivity in entire tumor (30–60 min after injection) plotted against tumor volume, both estimated from PET scans. Dotted regression line is fitted through data points of doxorubicin-treated rats; solid line, through those of saline-treated group.
Kinetics of 11C-SA4503 Binding
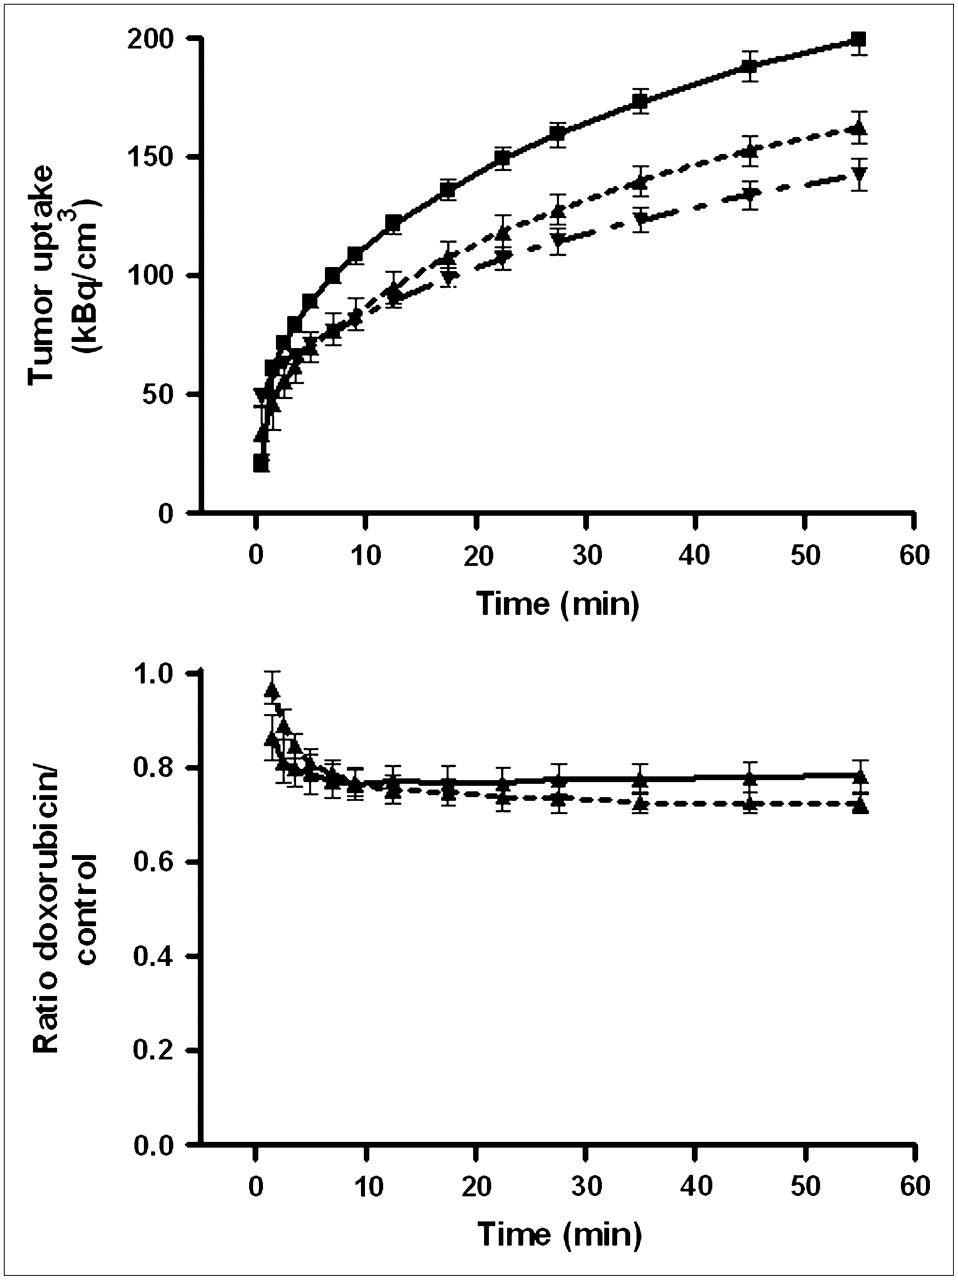
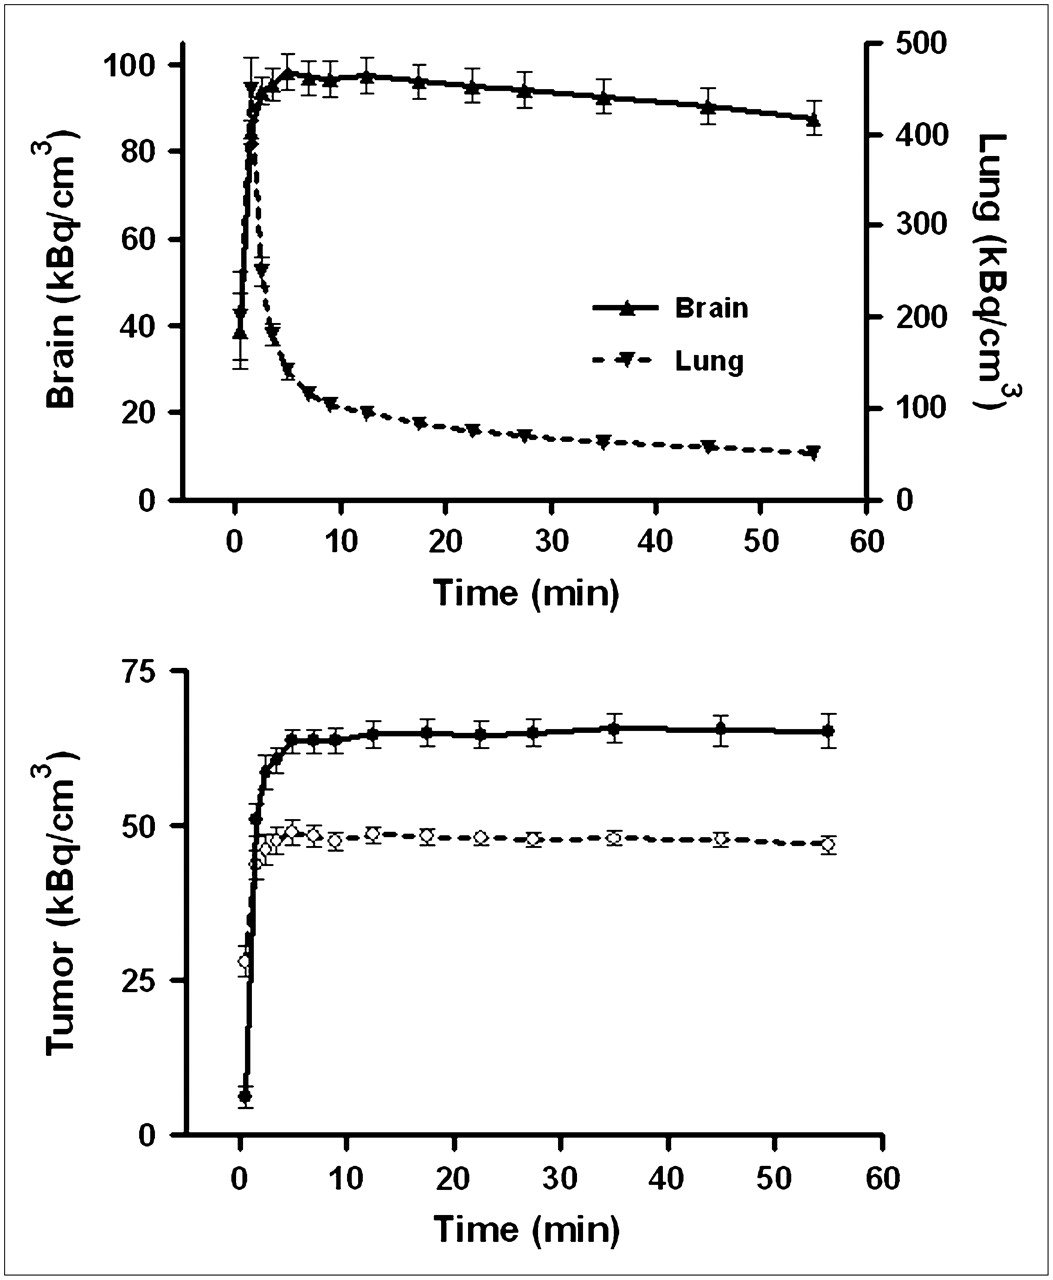
Tumor uptake of 11C-SA4503-derived radioactivity was rapid. A plateau value was reached within 5 min, and no appreciable washout occurred during the scanning period (Fig. 4). Slightly different tracer kinetics were observed in the brain. Here, a maximum was also rapidly reached but was followed by significant washout at intervals greater than 15 min (half-life, 4–5 h). Rat lung, a tissue with a negligible amount of σ1-receptors, showed a different time–activity curve. Pulmonary radioactivity reached a sharp peak 1–2 min after tracer injection, followed by a rapid decline.

Kinetics of 11C-SA4503 in various tissues. (Top) Time–activity curves for brain and lung of saline-treated rats. (Bottom) Tracer binding to C6 tumors in doxorubicin-treated animals (dotted line) and saline-treated rats (solid line). Because data obtained after 24 h and after 48 h did not differ, all data were combined. Mean tissue uptake normalized to body weight of 350 g and injected dose of 25 MBq is plotted; error bars indicate SEM. Saline and doxorubicin groups are significantly different at intervals greater than 3 min (not indicated). Tracer was injected 0.5 min earlier into doxorubicin-treated animals than into saline-treated rats.
Tumor binding of 11C-SA4503 was reduced by doxorubicin treatment (Fig. 4). The reductions at intervals of 24 and 48 h after chemotherapy were similar (−26.5% ± 6.5% and −26.5% ± 7.5%, respectively).
Kinetics of 18F-FDG uptake
Tumor uptake of 18F-FDG was less rapid than that of the σ1-ligand. Even 60 min after tracer injection, plateau values of radioactivity had yet to be reached (Fig. 5). However, the effect of doxorubicin treatment on 18F-FDG uptake could easily be quantified, because the ratio of tracer uptake in doxorubicin-treated and saline-treated tumors was stable at postinjection intervals greater than 30 min.
(Top) Kinetics of 18F-FDG uptake by C6 tumors in vivo. Data points with connecting lines represent (from top to bottom) saline-treated animals, animals 24 h after treatment with doxorubicin, and animals 48 h after treatment with doxorubicin. Mean tissue uptake normalized to body weight of 350 g and injected dose of 20 MBq is plotted; error bars indicate SEM. Saline- and doxorubicin-treated groups differ significantly at intervals greater than 5 min (not indicated). Tracer was injected 0.5 min earlier into doxorubicin-treated animals than into saline-treated rats. (Bottom) Ratio of tracer uptake in doxorubicin- and saline-treated tumors 24 h (solid line) and 48 h (dashed line) after treatment.
Tumor uptake of 18F-FDG was reduced by doxorubicin. Inhibition of tracer uptake was slightly greater at 48 h than at 24 h after chemotherapy (−27.4% ± 3.2% and −22.6% ± 3.2%, respectively; Fig. 5). The effect of doxorubicin on tumor uptake of both PET tracers (11C-SA4503 and 18F-FDG) was not significantly different.
Biodistribution of 18F-FDG
Treatment of animals with doxorubicin affected the biodistribution of 18F-FDG (Table 1). Reductions in 18F-FDG uptake were observed in the cerebral cortex (after 24 h only), in the submandibular gland (after 48 h only), and in C6 tumors (both at 24 h and at 48 h). Increases of 18F-FDG uptake occurred in adipose tissue and the large intestine (both at 24 h and at 48 h) and in the small intestine and pancreas (at 48 h only).
Changes of σ-Receptor Populations in Tumors After Doxorubicin Treatment
The results of in vitro receptor assays in tumor samples are presented in Table 2. Some tissue samples were too small for a complete saturation binding assay. Because binding data could be acquired for only a limited number of samples, data for the 24- and 48-h treatment periods were combined to allow statistical analysis. Neither the in vivo PET data (Fig. 4) nor the limited data from the in vitro assays suggested that there was any difference in σ-binding between the 24- and 48-h time points.
Changes of σ-Receptor Populations in C6 Tumors After Doxorubicin Treatment
The Bmax of σ1-receptors within the tumors was significantly reduced after doxorubicin treatment (Table 2). σ2-Receptor density appeared to be reduced as well, but this difference did not reach statistical significance (P = 0.07) because of a large variance within the doxorubicin-treated group. The Kd values of σ1-receptors for 3H-(+)-pentazocine, and of σ2-receptors for 3H-1,3-di-(2-tolyl)guanidine, were not altered after doxorubicin treatment.
DISCUSSION
Compared with normal tissue, many tumor cell lines and in vivo tumors express relatively high densities of σ1-receptors (1–3). In breast cancer cell lines, σ1-receptor density appears to be related to cellular proliferation (3). σ1-Antagonists have shown therapeutic potential for the treatment of cancer (4–6). Therefore, we decided to examine changes in σ1-receptor density after treatment of tumor-bearing rats with doxorubicin. We also determined whether such changes could be detected with PET, using a positron-emitting σ1-receptor ligand, 11C-SA4503.
The dose of doxorubicin (8 mg/kg of body weight) that we applied was relatively high, corresponding to 80% of the lethal dose (LD50) for intravenous administration in rats (18) and 55%–80% of the lethal dose (LD50) for intraperitoneal administration in mice (19,20). The transient decline of body weight of rats that we observed after a single intraperitoneal dose of doxorubicin was also noticed in other studies (21) and was apparently related to a temporary reduction of food intake. Animal mortality did not occur, nor was it expected, because mortality related to anthracycline cardiotoxicity is normally encountered only at intervals greater than 6 wk after doxorubicin treatment (21).
Both PET tracers visualized all C6 tumors (size, 0.5–2.5 g), although a higher tumor-to-background contrast was reached in 18F-FDG scans than in 11C-SA4503 scans (Fig. 2). Plots of tumor uptake of radioactivity versus tumor size (Fig. 3) indicate that larger tumors are more sensitive to doxorubicin treatment and that the fraction of the total tumor volume that is necrotic is increased after chemotherapy.
The kinetics of 11C-SA4503–derived radioactivity that we observed in brain, tumor, and lung of male Wistar rats were similar to those observed previously in male Donryu rats bearing AH109A hepatoma (22). We observed significant washout of 11C-SA4503 from the brain during a 1-h study period but complete retention of the tracer in C6 gliomas (Fig. 4). Different tracer kinetics in tumor and brain have also been reported for 125I-(2-piperidinylaminoethyl)5-iodobenzamide. This radioiodinated σ1-receptor ligand was cleared from normal tissues after 24 h but was retained in tumor xenografts (23). The mechanism underlying prolonged retention of σ-ligands in tumor cells is unknown, but this phenomenon could make tumors more sensitive than normal tissue to treatment with σ1-antagonists (9).
In the present study, σ1-receptor density in tumors was significantly decreased (27%) after a single intraperitoneal administration of doxorubicin (Table 2). Tumor uptake of the σ1-agonist 11C-SA4503 in PET scans was likewise decreased (26% at both treatment intervals; Fig. 4). Because the in vivo uptake of 11C-SA4503 reflects not only specific but also nonspecific binding (16), the doxorubicin-induced decline of tumor uptake of 11C-SA4503 that we observed on PET scans (Fig. 4) may be related not only to a loss of σ1-receptors from treated tumors but also to a small reduction in tumor blood flow. Anthracycline treatment is known to reduce perfusion in rodent tumors (24–26). In vitro binding studies have indicated a specific binding fraction of 78% ± 6% for 11C-SA4503 in C6 cells (16), whereas the tumor-to-muscle and tumor-to-plasma concentration ratios of 11C-SA4503 observed in vivo showed a 60%–86% decline after treatment of animals with haloperidol (16).
18F-FDG uptake in C6 tumors was also diminished after administration of doxorubicin. The decline estimated from PET scans (22.6% ± 3.2% at 24 h and 27.4% ± 3.2% at 48 h; Fig. 5) was similar to that observed ex vivo after tissue excision (22.4% ± 5.4% and 31.7% ± 12.7%; Table 1). Our study on doxorubicin, cisplatin, and 5-fluorouracil treatment of C6 cells grown in vitro (14) and the studies of other researchers on animal models (27,28) suggest that this early decline of 18F-FDG uptake in treated tumors indicates a reduction of the viable cell fraction within the tumor. Larger variance in the biodistribution data (Table 1) than in the PET scans (Fig. 5) is due to the fact that only part of the tumor was used for ex vivo γ-counting, the other part being used for σ-receptor assays.
Single injections of doxorubicin (2–10 mg/kg) are known to cause transient and dose-dependent injury to rapidly dividing tissues. Initial decreases in proliferation of the intestinal mucosa are followed by a compensatory epithelial hyperplasia in rodents (29,30). The decreases and increases of 18F-FDG uptake that we observed in adipose tissue, the pancreas, the salivary gland, and the large and small intestines after doxorubicin treatment (Table 1) may thus be related to initial cell damage followed by active repair.
CONCLUSION
Binding of the σ1-ligand 11C-SA4503 and uptake of the glucose tracer 18F-FDG showed equally rapid and equally large declines in C6 gliomas after in vivo chemotherapy with doxorubicin. Decreased binding of 11C-SA4503 corresponded to a loss of σ1-receptors from the tumors. Changes in tracer uptake preceded the morphologic changes by at least 48 h.
Footnotes
-
COPYRIGHT © 2007 by the Society of Nuclear Medicine, Inc.
References
- Received for publication March 27, 2007.
- Accepted for publication May 7, 2007.


Jump to section
Related Articles
Cited By...
- In Vivo Responses of Human A375M Melanoma to a {sigma} Ligand: 18F-FDG PET Imaging
- Small-Animal PET with a {sigma}-Ligand, 11C-SA4503, Detects Spontaneous Pituitary Tumors in Aged Rats
- Multifunctional Nanoparticles: Cost Versus Benefit of Adding Targeting and Imaging Capabilities
- Evaluation of D-18F-FMT, 18F-FDG, L-11C-MET, and 18F-FLT for Monitoring the Response of Tumors to Radiotherapy in Mice