


Abstract
Pituitary tumors are often detected only after death or at late stages of the disease when they are macroadenomas with a low surgical cure rate. Spontaneous pituitary tumors occur in rats over 1 y of age. In an ongoing study of changes in σ-1 agonist binding related to aging, several of our rats developed such tumors. The aim of the current study was to assess the kinetics of 11C-SA4503 (11C-labeled 1-[2-(3,4-dimethoxyphenthyl)]-4-(3-phenylpropyl)-piperazine dihydrochloride) in tumor and brain and to evaluate the utility of this tracer in the detection of pituitary tumors. Methods: Small-animal PET scans of the brain region of male Wistar Hannover rats (age, 18–32 mo) were acquired using the σ-1 agonist tracer 11C-SA4503. The time-dependent uptake of 11C in the entire brain, tumor or normal pituitary, and thyroid was measured. A 2-tissue-compartment model was fitted to the PET data, using metabolite-corrected plasma radioactivity as the input function. Results: Pituitary tumors showed up as bright hot spots in the scans. The total distribution volume (VT) of the tracer was significantly higher in the tumor than in the normal pituitary. Surprisingly, a higher VT was also seen in the brain and thyroid tissue of animals with pituitary tumors than in healthy rats. The increase in VT in the brain and thyroid was not related to a change in nondisplaceable binding potential (BPND) but rather to an increase in the partition coefficient (K1/k2) of 11C-SA4503. The increase in VT in the tumor on the other hand was accompanied by a significant increase in BPND. Western blotting analysis indicated that pituitary tumors overexpressed σ-1 receptors. Conclusion: The overexpression of σ-1 receptors in spontaneous pituitary tumors is detected as an increase in uptake and BPND of 11C-SA4503. Therefore, this tracer may have promise for the detection of pituitary adenomas, using PET.
Pituitary tumors (adenomas of the pituitary gland) are among the 5 most common intracranial neoplasms (1,2). Pituitary adenomas grow slowly and metastasize rarely (3). Despite their benign nature, they can cause significant morbidity (4). For example, pituitary tumors can lead to Cushing syndrome, pituitary hyperthyroidism, acromegaly, Nelson syndrome, or impotence (5,6). Unfortunately, pituitary tumors are difficult to diagnose and often remain undetected until postmortem examination or during late-stage disease (7,8). At late stages, most pituitary tumors will be macroadenomas with a low surgical cure rate (3). Diagnostic problems arise from the fact that they can manifest by varying symptoms. Functioning tumors hypersecrete various hormones (e.g., prolactin, thyroid-stimulating hormone, and growth hormone), and nonfunctioning tumors (nonsecreting) grow usually undetected until they compress surrounding structures (e.g., optic nerves) or prevent normal functioning of the pituitary gland (9). In addition, large pituitary tumors occasionally can cause fatal damage to the brain due to a sustained increase in intracranial pressure (10).
Because hormonal or symptom examination gives a rather poor differential diagnosis, current diagnostic methods include imaging techniques such as CT or MR imaging. CT and MR imaging allow avoidance of biopsies and significantly improve pituitary tumor localization (9,11,12). However, CT and MR imaging cannot distinguish between tumor and scar tissue or monitor biochemical and functional aspects of the tumor.
There is no tracer of first choice for pituitary tumor imaging using nuclear medicine (4), although such lesions have been visualized with, for example, 18F-FDG, radioactively labeled somatostatin analogs such as 111In-pentetreotide, and dopamine D2 receptor–targeting radiopharmaceuticals such as 18F-fluoroethyl-spiperone (1,4,7). The widespread use of 18F-FDG in PET imaging over the last 2 decades increased the detection of incidentalomas of the pituitary gland (7,13). However, pituitary tumors are slow-growing and highly differentiated, making 18F-FDG unsuitable for their imaging (4). Furthermore, 18F-FDG poorly distinguishes between nonneoplastic and neoplastic lesions, benign lesions and malignant lesions, and inflammation, and accumulation of this tracer in the pituitary gives an ambiguous interpretation (7,13–15). Huyn et al. showed that only 40.8% of the patients with focal pituitary 18F-FDG accumulation presented with pathologic lesions (7). On the other hand, somatostatin receptor and dopamine D2 receptor–targeting radiopharmaceuticals have only limited clinical usefulness, because expression of these receptors depends on the hormones that the pituitary tumor secretes (e.g., higher expression of somatostatin receptors in tumors producing growth hormone or thyroid-stimulating hormone, and higher expression of dopamine D2 receptors in nonsecretive tumors) (4,12,16).
Tumor cells frequently overexpress σ-receptors. Sigma receptors are unique transmembrane proteins classified into 2 subtypes, σ-1 and σ-2 (17). σ-1 receptors have been studied in more detail than σ-2 receptors since the σ-1 but not the σ-2 gene has been sequenced and cloned (18). σ-1 receptors were shown to be an intraorganelle signaling and cell survival modulator at the endoplasmic reticulum–mitochondria junctions (19). The σ-2 subtype was recently identified as the progesterone receptor membrane component 1 (20). σ-1 receptors are expressed at rather high densities in the brain and pituitary gland (21). However, the presence of σ-1 receptors in pituitary tumors has not yet been examined.
11C-SA4503 (11C-labeled 1-[2-(3,4-dimethoxyphenthyl)]-4-(3-phenylpropyl)-piperazine dihydrochloride) is a ligand with high affinity for σ-1 (inhibitory concentration of 50%, 17.4 nM) and lower affinity for σ-2 receptors (1,784 nM) and is commonly used for PET (17). We have previously reported that small-animal PET with 11C-SA4503 shows high tracer accumulation in the mammalian brain (22). 11C-SA4503 was already tested in healthy volunteers and in patients with Alzheimer disease (23) or Parkinson disease (17,24). Furthermore, small-animal PET with 11C-SA4503 in rats successfully detected subcutaneously grown C6 gliomas, had 10-fold C6 tumor selectivity over turpentine-induced sterile inflammation, and after systemic doxorubicin treatment showed an early decrease in tumor uptake that corresponded to a loss of σ-1 receptors from the tumors (25,26).
In the current study, we examined if spontaneously developed pituitary tumors in aged rats can be detected and distinguished from the normal pituitary by small-animal PET imaging with 11C-SA4503. Also, we performed kinetic analysis of tracer uptake in the brain, pituitary tumors, and thyroid gland, using a 2-tissue-compartment model fit to assess changes in partition coefficient (K1/k2), nondisplaceable binding potential (BPND), and total distribution volume (VT). Finally, the impact of a pituitary tumor on uptake of 11C-SA4503 in peripheral organs was examined, since a pituitary tumor may affect the vascular properties and perfusion of other tissues because of altered hormone levels.
MATERIALS AND METHODS
11C-SA503 Synthesis
The radioligand 11C-SA4503 was prepared by reaction of 11C-methyl iodide with 1-[2-(4-hydroxy-3-methoxy-penthyl)]-4-(3-phenylpropyl)piperazine dihydrochloride (4-O-demethyl SA4503), according to a published method (27). The decay-corrected radiochemical yield was about 24%, the specific radioactivity was greater than 100 TBq/mmol at the moment of injection, and radiochemical purity was greater than 98%. The 11C-SA4503 solution had a pH of 6.0 to 7.0.
Animal Model
Experiments were performed on male Wistar Hannover rats aged 18–32 mo. The animals were either purchased from Harlan or acquired from Semmelweis University. It was previously reported that more than 37% of male Wistar Hannover rats older than 1 y may develop pituitary tumors (28). Additional pituitary tumors and normal pituitary tissue for Western blotting were obtained from rats of similar ages from Semmelweis University. The rats were housed in polycarbonate cages on a layer of wood shavings in a room with constant temperature (21°C ± 2°C) and a fixed 12-h light–dark regime (light phase from 7:00 am to 7:00 pm). Food (standard laboratory chow, RMH-B; Hope Farms) and water were available ad libitum. After arrival, the rats were acclimatized for at least 7 d. Experiments were performed by licensed investigators in compliance with the Law on Animal Experiments in The Netherlands. The protocol was approved by the Committee on Animal Ethics of the University of Groningen. Animals were assigned to the healthy control (n = 8) or tumor-bearing group (n = 5) after autopsy.
Arterial Blood Sampling
Before PET scanning, an arterial cannula was placed in each rat for blood sampling and determination of the time course of radioactivity in plasma. For this purpose, the rats were anesthetized with isoflurane in medicinal air (5% for induction and 2% for maintenance). An incision was made parallel to the femoral artery. The femoral artery was separated from the femoral vein and temporarily ligated to prevent leakage of blood. A small incision was made in the artery, and a cannula was inserted (0.8-mm outer diameter, 0.4-mm inner diameter). The cannula was secured to the artery with a suture and attached to a syringe filled with heparinized saline.
From each rat, 15 arterial blood samples (0.1–0.15 mL) were collected at 0.25, 0.5, 0.75, 1, 1.25, 1.5, 2.0, 3, 5, 7.5, 10, 15, 30, 60, and 90 min after 11C-SA4503 injection and the start of the small-animal PET scan. Plasma was obtained from the blood by centrifugation (5 min in an Eppendorf-type centrifuge at 13,000 rpm). Radioactivity in plasma samples was determined using a calibrated γ-counter (CompuGamma CS 1282; LKB-Wallac). Plasma data were corrected for radioactive metabolites on the basis of the age of the rat.
In a separate group of animals, larger volumes of blood ranging from 0.4 to 1.6 mL were collected at 5, 10, 20, 40, and 60 min, and a metabolite analysis was performed using a method similar to one previously published for 11C-SA4503 (29). Briefly, plasma was obtained by centrifugation (2 min in an Eppendorf-type centrifuge at 13,000 rpm) and deproteinized using one third the volume of 20% trichloroacetic acid in acetonitrile. The mixture was centrifuged for 2 min at 13,000 rpm, and the supernatant was injected in a reversed-phase high-performance liquid chromatography system to separate the parent tracer and metabolites. A MicroBondapak C18 (7.8 × 300 mm) column and a mobile phase consisting of a mixture of acetonitrile and 50 mM sodium acetate buffer (pH 7.2; 1/1, v/v) at a flow rate of 3 mL/min were used. The eluate was collected in 30-s fractions for 15 min, and radioactivity in the samples was measured using a γ-counter.
PET Scan
Two rats were scanned simultaneously in each scan session, using a small-animal PET camera (microPET Focus 220; Siemens/Concorde). They were placed in the camera in transaxial position with their heads and necks in the field of view. First, a transmission scan of 515 s with a 57Co point source was obtained for attenuation and scatter correction of 511-keV photons by tissue. Subsequently, the first rat was injected through the penile vein with 11C-SA4503 (31 ± 16 MBq, volume < 1 mL). The emission scan was started with tracer injection of the first rat, and the second animal was injected a few minutes later. A list-mode protocol was used with a 90-min acquisition time (analysis performed for the first 74 min from tracer injection). Reconstructions were performed using microPET Manager 2.3.3.6 (Siemens). The list-mode data of the emission scans were reframed into a dynamic sequence of 8 × 30 s, 3 × 60 s, 2 × 120 s, 2 × 180 s, 3 × 300 s, 3 × 600 s, 1 × 720 s, 1 × 960 s frames. The data were reconstructed per time frame using an iterative algorithm (2-dimensional ordered-subsets expectation maximization with Fourier rebinning, 4 iterations, and 16 subsets). The final datasets consisted of 95 slices with a slice thickness of 0.8 mm and an in-plane image matrix of 128 × 128 pixels. Voxel size was 0.5 × 0.5 × 0.8 mm. The linear resolution at the center of the field of view was about 1.5 mm. Datasets were fully corrected for decay, random coincidences, scatter, and attenuation.
PET Data Analysis
The images obtained from the scan were coregistered with an MR imaging template (30) for drawing the 3-dimensional regions of interest over the whole brain and healthy pituitary. Regions of interest were also drawn over the thyroid and pituitary tumor using Inveon Research Workplace software (Siemens). Time–activity curves were calculated for each of these regions. Tracer uptake was expressed as a PET standardized uptake value (SUV), assuming a specific gravity of 1 g/cm3 for brain tissue and blood plasma. The parameter SUV is defined as [tissue activity concentration (MBq/g) × animal body weight (g)/injected dose (MBq)].
Kinetic analysis was performed by fitting a standard 4-parameter, 2-tissue-compartment model to the dynamic PET data, using metabolite-corrected plasma radioactivity from arterial blood samples as the input function. The 2-tissue-compartment model was described previously (31); its parameters are rate constant for transport from arterial plasma to tissue (K1), tissue to arterial plasma (k2), free compartment to bound compartment in tissue (k3), and bound compartment to free compartment in tissue (k4). When plasma data were not available, a population average corrected for injected dose and weight of individual animal was used as input. Software routines for Matlab 7 (The MathWorks), written by Dr. Antoon T.M. Willemsen (University Medical Center Groningen), were used for curve fitting. The blood volume was fixed at 0.036, and the rate constants K1, k2, k3, and k4 were estimated from the curve fit. The partition coefficient was calculated as K1/k2, BPND was calculated as k3/k4, and VT was calculated as K1/k2 × (1+ k3/k4).
Ex Vivo Biodistribution
After the scanning period, the animals were terminated by extirpation of the heart. Blood was immediately collected, and plasma and a cell fraction were separated by a short period of centrifugation (5 min at 1,000g). Several tissues (Table 1) were excised. All tissue samples were weighed. Radioactivity in tissue samples and in a sample of the injected tracer solution (infusate) was measured using a γ-counter with automatic decay correction. The data are presented as SUV. Tissue-to-plasma and pituitary- or tumor-to-brain concentration ratios of radioactivity were calculated.
Biodistribution of 11C-SA4503 in Pituitary and Tumor
Western Blotting
A portion of the pituitary tumors (n = 5) and the entire pituitary of control animals (n = 5) were homogenized in lysis buffer containing 137 mM NaCl, 20 mM Tris-HCl (pH 8.0), 2% Nonidet P-40 (Shell Chemicals), 10% glycerol, and protease inhibitors. Total protein was used for analysis rather than a plasma membrane fraction, since most σ-1 receptors are known to be intracellular and the intracellular receptors are functionally important (17,19,21). Moreover, our ligand 11C-SA4503 visualizes the entire σ-1 receptor population because of its lipophilicity. The homogenate was sonicated for 30 s in a cold pack. Lysates were centrifuged for 15 min at 15,300g at 4°C. Supernatants were collected and stored at −20°C until use. The concentration of protein was determined with a Bradford assay. Twenty micrograms of protein were electrophoresed on 8%–12% (v/v) sodium dodecyl sulfate polyacrylamide gels. Proteins were electrotransferred onto polyvinylidene difluoride membranes (Amersham). The nonspecific binding of immunoproteins was blocked with 5% nonfat dry milk for 2 h at room temperature. After blocking, the membrane was incubated with primary antibodies overnight at 4°C. The primary antibody recognizing σ-1 receptors was ab89655, an anti-Sig-1R antibody purchased from AbCam. The membrane was rinsed in Tris-buffered saline containing 0.1% polysorbate 20 followed by 1 h of incubation with horseradish peroxidase–conjugated secondary antibody at room temperature. After incubation, the membranes were repeatedly washed in this same buffer and incubated with an enhanced chemiluminescence reagent (ECL Plus, RPN 2132; Amersham). The protein bands were visualized on x-ray films. The optical density of the protein bands was quantified using ImageJ (National Institutes of Health) and standardized to β-actin (1:2,000, SC-47778; Santa Cruz Biotechnology).
Statistics
All results are expressed as mean ± SEM. Differences between groups were examined by unpaired 2-tailed t testing or 2-way ANOVA, followed by a post hoc Bonferroni test, when applicable. A P value of less than 0.05 was considered statistically significant. Correlations were assessed using the Pearson correlation coefficient (r) and considered strong when r2 was at least 0.7 and significant when P was less than 0.05.
RESULTS
Tumor Visualization on PET Images
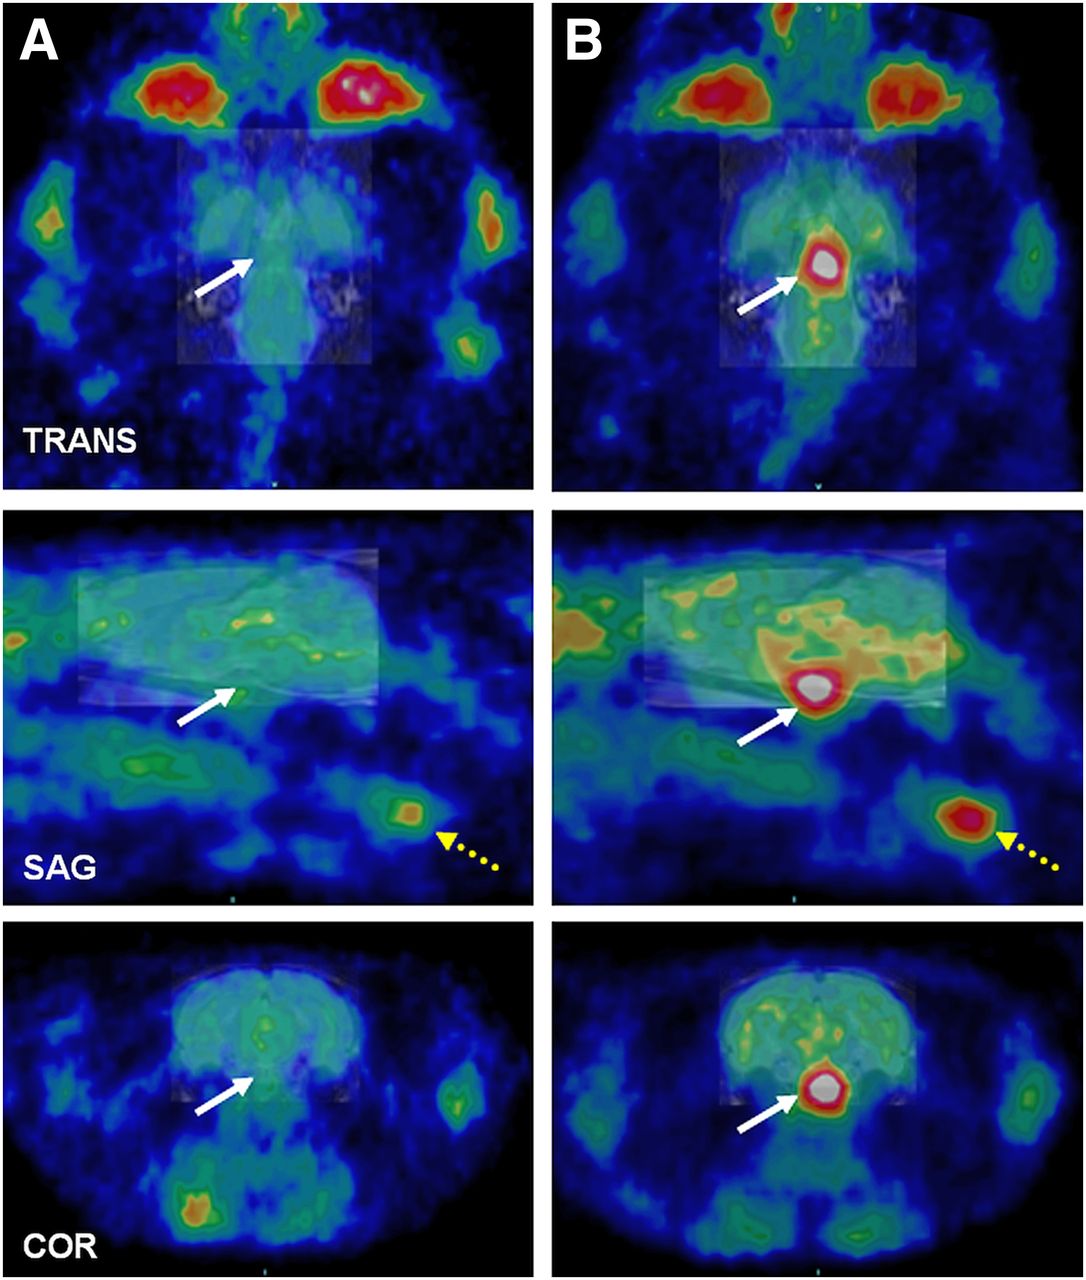
Spontaneous pituitary tumors developed in 38% of the aged rats. These tumors were clearly visible in the 11C-SA4503 scans (Fig. 1). The brains of animals with pituitary tumors also appeared to take up more tracer than normal brain. The thyroid glands were in the field of view, and they appeared to take up more tracer in the tumor-bearing rats than in the normal aged rats (Fig. 1).

11C-SA4503 small-animal PET images of healthy aged rat (A) and aged rat with spontaneous pituitary tumor weighing 17 mg (B). Solid arrows indicate healthy pituitary or pituitary tumor; dashed arrows indicate position of thyroid gland. COR = coronal; SAG = sagittal view; TRANS = transverse.
Kinetics of Radioactivity in Plasma and Brain
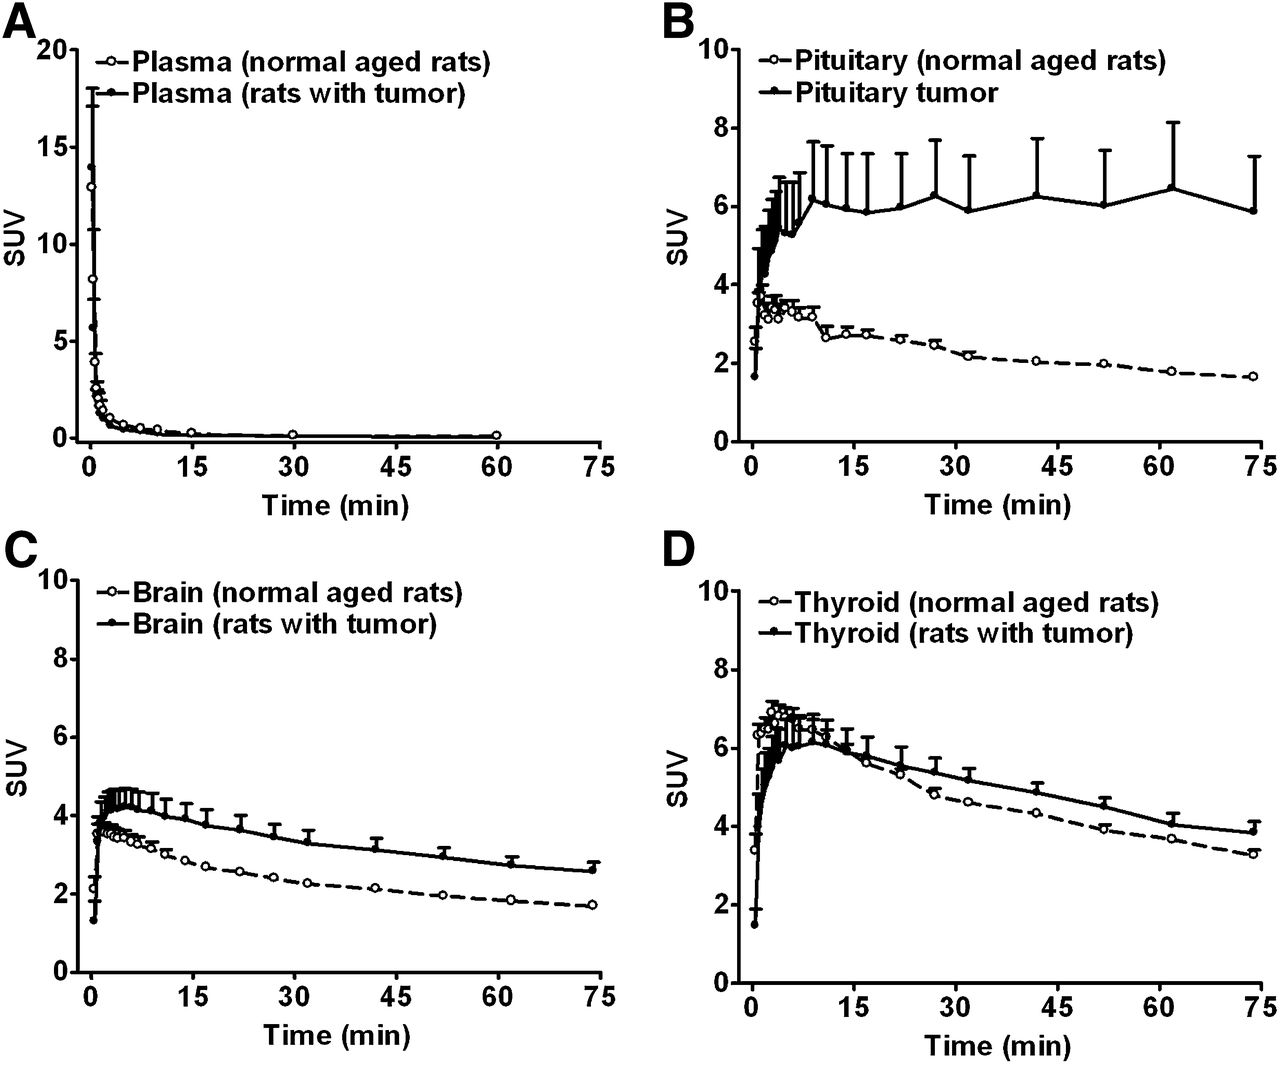
Metabolite analysis revealed that about 50% of the parent tracer remained intact at 60 min, but there was no significant difference between the groups. The kinetics of radioactivity in the plasma (metabolite-corrected, n = 4 each) after a bolus injection of 11C-SA4503 are shown in Figure 2A. Values from 4 normal rats and 1 rat with tumor were not included in this analysis because of nonavailability of plasma samples (failure of the cannula and changed kinetics due to a small depot during tracer injection). Rapid biexponential clearance was observed in both groups. The presence of the pituitary tumor did not significantly affect the plasma kinetics of the tracer. The area under the curve for normal rats was 18.0 ± 3.1; that for rats with tumor was 13.1 ± 0.8, (P = 0.1720).

Time–activity curves of 11C-SA4503 in plasma of normal (n = 5) and tumor-bearing (n = 4) rats (A), normal pituitary (n = 7) and pituitary tumors (n = 5) (B), brain of normal (n = 7) and tumor-bearing (n = 5) rats, (C), and thyroid of normal (n = 7) and tumor-bearing rats (n = 5) (D). Data are expressed as mean ± SEM; differences in area under curve were tested with unpaired 2-tailed t test.
The kinetics of 11C-SA4503 in the pituitary and pituitary tumor, the brain, and the thyroid are presented in Figures 2B–2D. Tracer uptake was rapid in normal brain, normal pituitary, and brain with tumor, with the peak appearing within 5 min of tracer injection, and was followed by a slow washout. Uptake in the pituitary tumor, although also rapid, plateaued within 10 min, and no appreciable washout was seen within the scanning duration. Uptake of the tracer was significantly higher in the tumor than in the normal pituitary and was about 3-fold higher by the end of the scan (area under the curve, 439.6 ± 104.4 vs. 166.6 ± 8.6, P < 0.05). Uptake was also higher in the tumor than in the brain of tumor-bearing rats and was about 2-fold higher by the end of the scan. Uptake was about 50% higher in the brain of tumor-bearing rats than in the brain of normal aged rats.

Kinetic modeling parameters of 11C-SA4503 in normal pituitary (n = 8) and pituitary tumor (n = 5) (A) and in brain of normal (n = 8) and tumor-bearing (n = 5) rats (B), and correlation of 11C-SA4503 kinetic parameters (VT, BPND, K1/k2) in thyroid and brain (C). Data are expressed as mean ± SEM and were tested with unpaired 2-tailed t test.
Kinetic Analysis
Using the metabolite-corrected arterial plasma as input, we fitted a 2-tissue-compartment model to regions of interest drawn around whole brain, normal pituitary, pituitary tumor, and thyroid. When plasma data were not available, a population average corrected for injected dose and weight of individual animal was used as input. The VT (Fig. 3A) of the tracer was significantly higher (P < 0.05) in tumor (105.0 ± 47.6) than in the normal pituitary (11.6 ± 1.0). Furthermore, the VT was higher in the brain tissue of animals with pituitary tumors than in the brain tissue of normal rats (25.5 ± 3.3 vs. 11.8 ± 1.2, P < 0.001) (Fig. 3B). Additionally, the VT was higher in the thyroid of rats with pituitary tumors than in the thyroid of normal rats (39.3 ± 5.5 vs. 23.1 ± 1.9, P < 0.01).
The higher VT in the tumor was associated with a significantly higher BPND (10.7 ± 1.7 vs. 4.6 ± 0.5, P < 0.01) and K1/k2 (10.5 ± 4.5 vs. 2.2 ± 0.3, P < 0.05) (Fig. 3A). On the other hand, the higher VT in the brain was not related to a change in BPND but was due to a higher partition coefficient (K1/k2) of 11C-SA4503 (6.6 ± 1.3 vs. 2.4 ± 0.4, P < 0.01, (Fig. 3B). Similarly, the higher VT in the thyroid was related to a higher K1/k2 (8.8 ± 1.3 vs. 5.1 ± 0.8, P < 0.05) rather than to BPND. Changes in VT and K1/k2 in the brain and thyroid were strongly correlated (R2 = 0.81, P < 0.0001, and R2 = 0.85, P < 0.0001, respectively). The correlation between changes in BPND was not as strong but still quite significant (R2 = 0.66, P = 0.0014) (Fig. 3C). However, changes in K1/k2 in brain and pituitary or tumor correlated only weakly (R2 = 0.38, P < 0.05), and changes in VT and BPND were not correlated at all (R2 = 0.19, P = 0.1372, and R2 = 0.02, P = 0.6622, respectively).
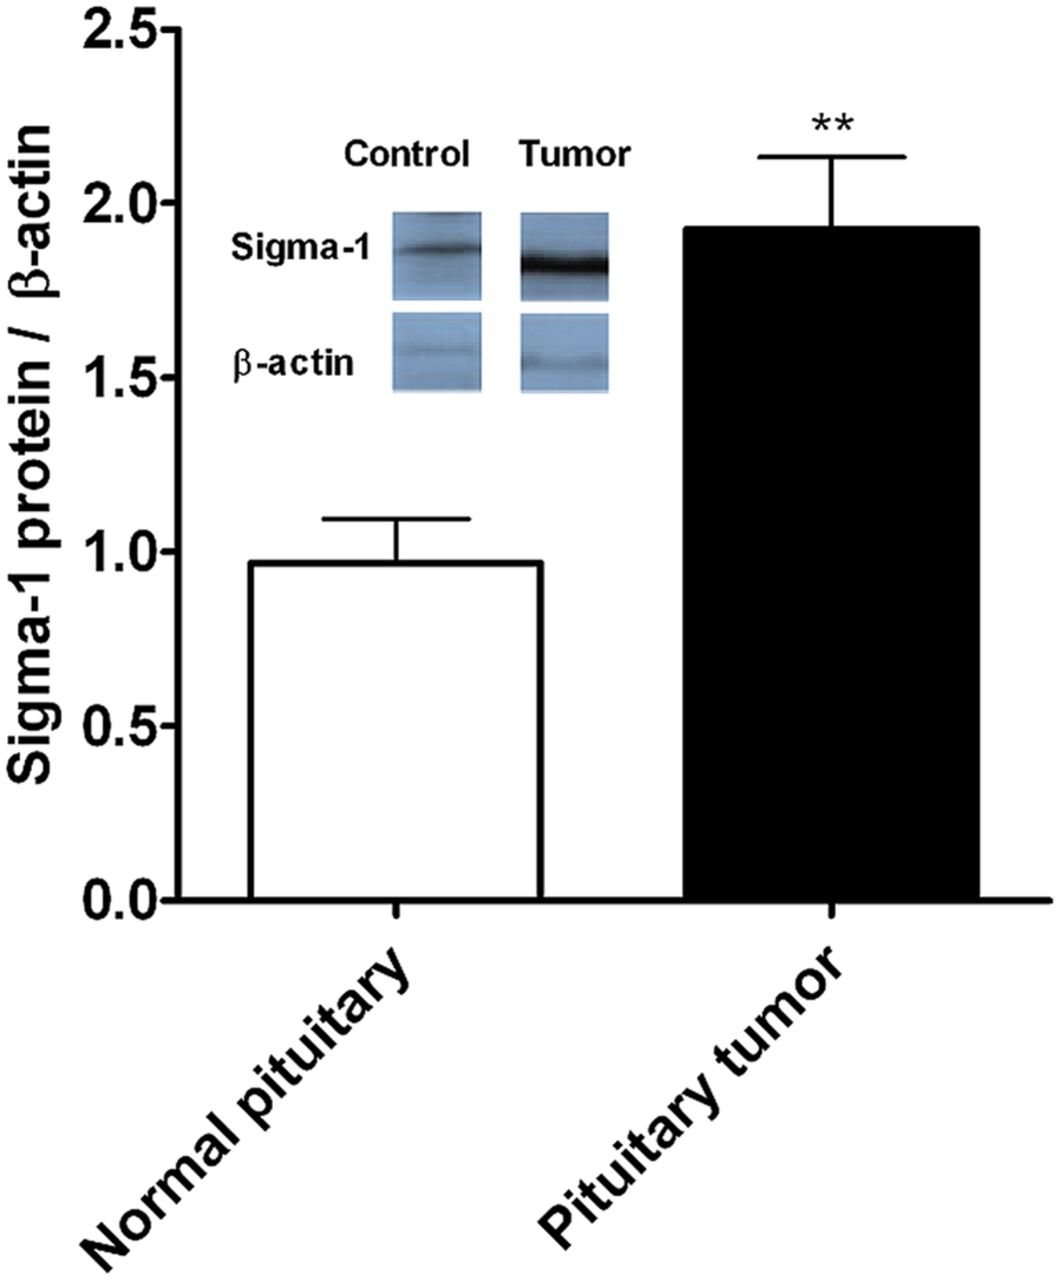
Ratio of σ-1 receptor protein to β-actin from Western blotting in normal pituitary (n = 5) and pituitary tumors (n = 5). Data are expressed as mean ± SEM and were tested with unpaired 2-tailed t test. Inset shows representative bands.
Biodistribution
The mass of a normal pituitary was 12.7 ± 3.3 mg (mean ± SD, n = 5; range, 8.6–17.7 mg). Spontaneous pituitary tumors weighed 70.5 ± 93.1 mg (mean ± SD, n = 8; range, 14.0–274.7 mg). The biodistribution data of 11C-SA4503 90 min after injection showed considerable uptake in the pituitary tumor (SUV, 10.3 ± 2.1)—about 3-fold higher than in the normal pituitary gland. The accumulation of 11C-SA4503 was about 100-fold higher in tumor tissue than in plasma and about 6-fold higher than in the adjacent brain (Table 1).
The biodistribution data for the brain areas and peripheral organs are listed in Table 2. The presence of the pituitary tumor was associated with a significantly higher SUV and tissue-to-plasma ratio of the tracer in all brain areas. SUVs in the peripheral organs of normal and tumor-bearing rats were not significantly different, but tissue-to-plasma ratios in the brain, small intestine, liver, and spleen of tumor-bearing animals were significantly higher.
Biodistribution of 11C-SA4503 in Brain and Peripheral Regions
Western Blotting
Western blotting was performed to quantify the σ-1 receptor proteins in the pituitary tumor and normal pituitary. Immunoreactive bands for σ-1 receptor proteins were visualized at 25 kDa. The ratio of σ-1 receptor protein to β-actin was significantly higher in the pituitary tumors than in normal pituitary (1.94 ± 0.21 vs. 0.97 ± 0.13, P < 0.01) (Fig. 4).
DISCUSSION
This study demonstrated that spontaneous pituitary tumors in aged rats can be detected and distinguished from normal pituitary and brain by small-animal PET imaging with the σ-1 ligand 11C-SA4503. To the best of our knowledge, this is the first report identifying σ-1 receptors in pituitary tumors.
For clear visualization of tumor lesions, the ratio of tracer uptake in tumor versus surrounding tissue must be >>1. In the biodistribution experiments, we observed an accumulation of 11C-SA4503 about 6-fold higher in the pituitary tumors than in the adjacent brain and about 100-fold higher than in plasma. Therefore, the pituitary tumors were easily visualized with 11C-SA4503.
Kinetic modeling indicated that VT in pituitary tumors increased (by 10-fold), compared with the normal pituitary. These changes in VT were related to increases in both K1/k2 and BPND (4.9-fold and 2.3-fold, respectively). Tracer VT in the brain of pituitary tumor–bearing rats was increased (by 2.4-fold), compared with the brain of healthy rats, because of an increase in K1/k2 (by 2.7-fold), whereas BPND was unaltered (Fig. 3A). Since the pituitary is adjacent to the brain, partial-volume effect could play a role in the increased VT in the brains of rats with pituitary tumor. However, the higher SUV in the brains of animals with pituitary tumor in the biodistribution study suggests that this effect is independent of partial-volume effects. A 1.7-fold increase in K1/k2 (but not BPND) was also observed in the thyroid gland of tumor-bearing rats (Fig. 3B).
Increases in the partition coefficient (K1/k2) of the tracer were observed not only in pituitary tumors but also in the brain and thyroid. Increases in K1/k2 are thus not limited to tumor tissue. Pituitary tumors are known to exert global effects on blood flow (32) and different effects on regional blood pressure (33). Altered tissue-to-plasma ratios of 11C-SA4503 in the brain, small intestine, liver, and spleen of tumor-bearing animals (Table 2) may be related to such phenomena, although additional data on hormone levels and tissue perfusion are required to prove the underlying mechanism.
A change in BPND could indicate a change in either receptor numbers or affinity. If the affinity of 11C-SA4503 to σ-1 receptors remains constant during malignant transformation, as has been reported for nonneural tumors (33), the observed increase in BPND in tumor tissue should reflect an upregulation of σ-1 receptors in pituitary tumors. Such upregulation would be consistent with the moderate (generally 2- to 3-fold) overexpression of σ-1 receptors in other tumor tissues (17,33,34). Our results from Western blotting also confirmed a 2-fold overexpression of σ-1 receptors in pituitary tumors. The reason for upregulation of σ-1 receptors in tumor tissue is unclear, but the upregulation may provide the tumor cells with an additional brake on apoptosis (35). Since BPND values in the brain and thyroid of tumor-bearing rats were not increased, σ-1 receptor expression in these organs appears to be unaffected by the pituitary tumor.
In this study, we did not find any correlation between BPND and tumor size. Similarly, in a study on 95 breast cancer patients, no correlation was observed between σ-1 receptor levels and tumor size, histologic grade, or expression of the proliferation marker, Ki-67, although a positive correlation was reported between σ-1 receptor levels, hormone receptor positivity (in particular progesterone receptor), Bcl-2 expression, and the period of disease-free survival (36). Low ratios (<1) of prosurvival Bcl-2 and proapoptotic Bax expression predominate in nonfunctioning pituitary tumors and pituitary microadenomas (37).
CONCLUSION
The very high uptake of 11C-SA4503 in pituitary adenomas indicates that testing of 11C-SA4503-PET in a clinical setting may be worthwhile. The fact that even very small tumors were clearly detected (lesion mass in Fig. 1 was 17 mg) suggests that 11C-SA4503 may be applied for the detection of microadenomas. Future studies are needed to answer the question of whether 11C-SA4503-PET can discriminate between symptomatic, hormone-secreting, and nonfunctioning (nonsymptomatic, nonsecretive) tumors.
DISCLOSURE
The costs of publication of this article were defrayed in part by the payment of page charges. Therefore, and solely to indicate this fact, this article is hereby marked “advertisement” in accordance with 18 USC section 1734. No potential conflict of interest relevant to this article was reported.
Footnotes
Published online Jun. 19, 2013.
- © 2013 by the Society of Nuclear Medicine and Molecular Imaging, Inc.
REFERENCES
- Received for publication October 18, 2012.
- Accepted for publication February 24, 2013.


Jump to section
Related Articles
Cited By...
- No citing articles found.