


Abstract
σ-ligands can kill tumor cells. Previously we have shown that a short in vitro incubation of C6 tumor cells with σ-ligands (24 h) results in a dose-dependent increase of cellular 18F-FDG uptake and that the magnitude of this increase is predictive of subsequent cell death. Here, we aimed to assess whether the σ-ligand rimcazole inhibits growth of A375M melanoma xenografts in nude mice and whether rimcazole treatment changes 18F-FDG uptake in vivo. Methods: Athymic mice were inoculated with A375M melanoma cells. After 2 wk, tumors had reached a size of 41 ± 6 mm3. We then started a 14-d treatment schedule with daily drug dosing. Control animals were injected with water and treated animals with rimcazole (26 mg/kg) in water. Three small-animal PET scans with 18F-FDG were obtained: on days 0, 7, and 14 of treatment. After the last scan, animals were terminated, and a biodistribution study was performed. Results: Rimcazole treatment resulted in a greater than 4-fold reduction of tumor weight in comparison to controls at day 14 (100 ± 26 vs. 436 ± 117 mg, respectively, P < 0.03). Treatment did not affect the levels of (nonradioactive) glucose in blood, σ-1 and σ-2 receptor expression in the tumor, animal weight, behavior, or appearance. Antitumor activity of rimcazole was accompanied by a transient increase of the tumor uptake of 18F-FDG (measured at day 7). Significant increases of 18F-FDG uptake at day 14 were observed in the liver and pancreas. Conclusion: Rimcazole strongly inhibited the growth of A375M melanoma xenografts. This growth inhibition is accompanied by an early increase of 18F-FDG uptake in the tumor.
Melanoma, a neoplasm arising from pigment-producing melanocytes, is highly metastatic and the most deadly dermatologic malignancy, because the disease is frequently diagnosed in the advanced stage and metastasized melanoma is refractory to current therapeutic modalities (such as radiotherapy, chemotherapy, and immunotherapy) (1). New targets that can induce melanoma cell death or overcome melanoma resistance may lead to improved treatment of refractory melanomas.
Melanomas possess moderate to high levels of σ-receptors (σRs), as shown by a pronounced uptake of several σ-ligands labeled for PET (2) or SPECT (3–5) and by immunohistochemical staining of σ-1 receptors in primary human melanomas (www.proteinatlas.com).
σRs are proteins integrated into cell membrane, endoplasmic reticulum, mitochondrial membrane, nuclear envelope, and lysosomes (6,7). There are 2 identified σR subtypes, σ-1 and σ-2 (recently identified as progesterone receptor membrane component 1, PGRMC1) (8–10). Steroid hormones, in particular progesterone, have affinity for both σR subtypes (10,11), although their function as endogenous ligands for σ-1 receptor is still debated. σ-1 receptors are upregulated with the onset of cancer cell proliferation (12). σ-2 receptors are 10-fold more abundant in rapidly proliferating cancer cells than in quiescent cancer cells derived from mouse mammary adenocarcinoma in vitro and in vivo (13). A 3- to 5-fold overexpression of σ-2 receptors has been observed in low-grade bovine bladder carcinomas, whereas a marked 25- to 44-fold overexpression is found in high-grade bovine bladder carcinomas (14). These data are consistent with the participation of σRs in cellular proliferation and indicate that σ-ligands may be useful diagnostic agents and radiotracers for cancer imaging.
σ-1 antagonists and σ-2 agonists have strong anticancer properties, but they exert only minor effects on noncancerous tissue (15). In addition, σ-ligands can repress or overcome therapy resistance in cancer cells and, thus, enhance the anticancer effect of chemotherapeutics (16). This observation has resulted in several in vivo studies with σ-ligands as anticancer agents including clinical trials with rimcazole (Modern Biosciences), siramesine (H Lundbeck A/S), SR31747A (Sanofi-Aventis), and ANAVEX 1007 (Anavex Life Sciences).
σ-ligands can activate multiple cell death pathways dependent on the cancer type and ligand concentration. The mechanism by which a σ-ligand induces cytotoxicity is partially p53- and caspase-independent (17); it involves disturbance of the cell cycle (particularly arrest in G1 phase) (18,19), changes in calcium homeostasis (20,21), and modulation of the ceramide/sphingolipid ratios (22). The key pathway in these processes could be phosphatidylinositide 3-kinase (PI3K)/protein kinase B (Akt), because both downregulation of σ-1 receptors and treatment with σ-ligands (e.g., 1-(4-iodophenyl)-3-(2-adamantyl)guanidine [IPAG], rimcazole, and haloperidol) affect Akt phosphorylation (15,23–26). Moreover, haloperidol inhibits proliferation of B16 and SK-MEL-28 melanoma cell lines (18). σRs are, therefore, an appealing target for melanoma treatment.
Previously, we demonstrated a strong anticancer activity of the σ-ligand rimcazole in cultured human A375M melanoma cells and rat C6 glioma (27,28). In addition, our in vitro results showed that cytotoxic doses of σ-ligands are generally associated with increased uptake of 18F-FDG (28).
Although σRs are abundant in melanoma and the σ-ligands rimcazole and haloperidol showed superior activity toward melanoma cells in culture (20,27), the effect of rimcazole on the in vivo growth of a melanoma xenograft was never documented. Furthermore, because σ-ligands are currently being tested in clinical trials for cancer treatment, a noninvasive technique, such as PET, could be useful for monitoring of tumor responses during σR-targeted anticancer therapy.
18F-FDG may be a suitable PET probe for this purpose, for the following reasons:
18F-FDG, the most commonly used tracer in oncology, monitors the cellular metabolic rate of glucose, which is an indirect reflection of tumor growth. 18F-FDG uptake is mainly determined by the activity of glucose transporters (GLUTs) and the first enzyme of the glycolytic pathway, hexokinase. Overexpression and increased activity of GLUTs and hexokinase isozymes is a characteristic feature of rapidly dividing cancer cells.
C6 cells treated with anticancer drugs in vitro show an increased 18F-FDG uptake, which reflects σ-ligand–induced cancer cell death (28) and possibly drug interaction with pathways regulating glucose metabolism (e.g., Akt and hypoxia-inducible factor [HIF-1]) (6,24,26,29). A similar transient increase of 18F-FDG uptake is frequently observed in tumors after hormone treatment.
In the current study, we assessed the in vivo activity of rimcazole against human A375M melanoma subcutaneously xenografted in athymic nude mice. Small-animal PET scans with 18F-FDG were obtained to test whether treatment-induced changes in tumor growth are accompanied by changes in glucose metabolism.
MATERIALS AND METHODS
Radiopharmaceuticals
Sterile 18F-FDG was prepared by an automated synthesis module, using the Hamacher method (30). The specific radioactivity was always greater than 10 (usually between 50 and 100) TBq/mmol. Radiochemical purities were always greater than 95%.
Cell Culture
The malignant human melanoma cell line A375M was purchased from the American Type Culture Collection. A375M cells were cultured as monolayers in Dulbecco's modified Eagle medium (high-glucose) supplemented with 10% fetal calf serum at 37°C and incubated in a humidified atmosphere (5% CO2 in air). Cells were passaged 1:10 twice a week. For in vivo experiments, cells in the exponential phase of growth were used. The A375 cell line, which is parental to A375M, was previously characterized for high σR content (σ-1 receptor: Bmax [receptor density], 34 fmol/mg of protein; σ-2 receptor: Bmax, 3403 fmol/mg of protein) (31).
Animal Model
A375M tumor xenografts were established in athymic nude-ν-mice (Hsd:Athymic Nude-Fox1nu [Harlan]; age, 6 wk) by subcutaneous injection of 2 × 10⁶ cells in 100 μL of Matrigel (BD Biosciences) into the right shoulder of the animal. Animals were randomly assigned to treatment groups. In treated mice (n = 5), rimcazole (26 mg/kg of body weight, in ∼150 μL water) was administered by daily intraperitoneal injection from day 14 after tumor inoculation (when tumor size reached 41 ± 6 mm3) and was continued for the remaining 14 d. Control mice (n = 5) received intraperitoneal water injections. Animal welfare, behavior, and body weight were checked at daily intervals. At the same intervals, tumor size was measured using digital calipers and calculated using the formula V = 0.5234 × height × length × width. On day 14 of treatment, mice were sacrificed, and tumors were excised and weighed. Experiments were performed by licensed investigators in compliance with the Law on Animal Experiments in The Netherlands. The protocol was approved by the Committee on Animal Ethics of the University of Groningen. Mice were maintained in individually ventilated cages (2 mice per cage) under a regime of 12 h of light and 12 h of dark and were fed standard laboratory chow ad libitum.
Small-Animal PET Study
Each mouse was scanned 3 times with 18F-FDG: at baseline on day 0, for treatment evaluation on day 7, and at follow-up on day 14 of treatment. Before each scan, mice were anesthetized with isoflurane (induction, 3%; maintenance, 1.5%). Animal weight and blood glucose levels (One-Touch Ultra2 Blood Glucose Meter; LifeScan Inc.) were determined. 18F-FDG (8.74 ± 0.69 MBq, pH 6.6–7.0, volume < 0.1 mL) was injected through the penile vein. The camera (microPET Focus 220; CTI Siemens) was started 8 min after tracer injection. Two animals were scanned simultaneously in each scan session. Heating mats were used to maintain body temperature at 37°C. A list-mode protocol was used (whole-body scan, 44-min acquisition time). Image reconstruction is described in the supplemental data (“Methods” section; supplemental materials are available at http://jnm.snmjournals.org).
18F-FDG Uptake Analysis
Inveon Research Workplace software (Siemens) was used to manually draw 3-dimensional regions of interest around the tumor in PET images. Necrotic areas of tumors, identified by histopathologic evaluation of hematoxylin and eosin–stained tissue sections, were included in the region of interest. The data are presented as the mean uptake in Bq/cm3 normalized to a blood glucose level of 7.8 mmol/L, body weight of 28 g, and injected dose of 10 MBq, assuming a tissue density of 1 g/cm3.
Ex Vivo Biodistribution
After scan 3, animals were terminated via cervical dislocation under anesthesia, and a biodistribution study was performed. Blood was collected, and plasma and a cell fraction were obtained from the blood sample by short centrifugation (5 min at 1,000g). Several tissues (Table 1) were excised and stored on ice. The radioactivity in tissue samples and infusate was measured using a γ-counter (CompuGamma CS 1282; LKB-Wallac), with a decay correction applied. All samples were weighed. The results were expressed as dimensionless standardized uptake values (SUVs) normalized to a blood glucose level of 7.8 mmol/L. The parameter SUV is defined as [tissue activity concentration (MBq/g) × body weight (g)/injected dose (MBq)]. Tissue-to-plasma and tumor-to-muscle concentration ratios of radioactivity were also calculated.
Effect of 14-Day Lasting Rimcazole Treatment on Biodistribution of 18F-FDG
Histology and Immunohistochemistry
Liver samples were formalin-fixed for 24 h, embedded in paraffin, cut into 4-μm sections, and stained with hematoxylin and eosin. Liver histopathology (hepatic tissue injury and inflammation) was evaluated by an independent researcher who was masked to all data.
Tumor samples were rapidly frozen and stored at −80°C until further analyses. For staining, tumors were cut into 5.5-μm sections and fixed in acetone. A 2-step immunoperoxidase technique was used. Sections were stained with corresponding primary antibodies. Subsequently, endogenous peroxidase was blocked with H2O2, followed by staining with the secondary and the tertiary antibody. The reaction was developed using brown/red 3-amino-9-ethyl-carbazole/H2O2. Sections were counterstained using Mayer’s Hematoxylin Solution (Merck) (additional details are provided in the supplemental data, “Methods” section).
Western Blotting
A375M cells were treated with rimcazole (0, 15, and 25 μM) for various intervals, and whole-cell lysates were prepared. After denaturation, samples were separated by sodium dodecyl sulfate polyacrylamide gel electrophoresis and transferred to nitrocellulose membranes by semidry blotting. To detect the proteins of interest, membranes were incubated with corresponding primary and secondary antibodies (details are provided in the supplemental data, “Methods” section).
Statistics
All results are expressed as mean ± SEM. Differences between groups were examined both by 2-tailed unpaired t test and by 1-way ANOVA, followed by a post hoc Tukey Multiple Comparison Test, if applicable. A P value of less than 0.05 was considered statistically significant.
RESULTS
σRs in Established A375M Xenografts
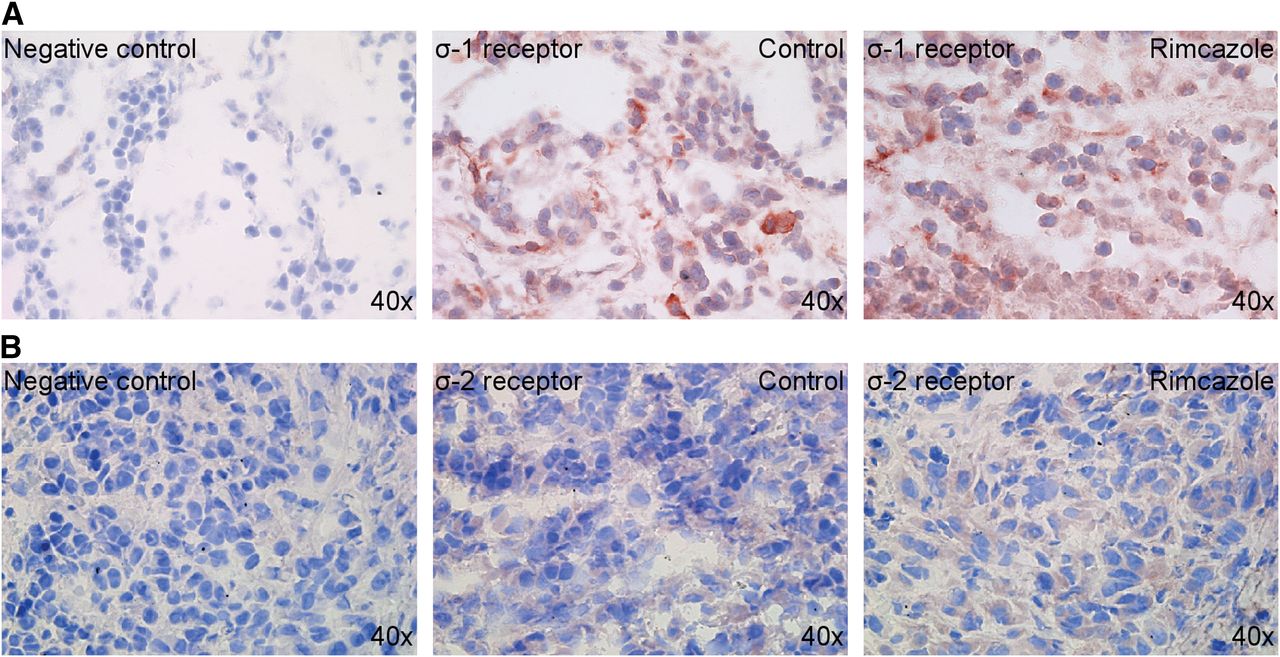
A375M melanoma xenografts maintained σ-1 and σ-2 receptor expression after 4 wk of growth in athymic nude mice (Fig. 1). σ-1 receptor staining was moderately strong and found generally in the cytoplasmic compartment but occasionally also in a ring around the nucleus, possibly part of endoplasmic reticulum or nuclear membrane. σ-2 receptor staining was rather weak and found mainly in the cytoplasm. We detected a comparable staining in control tumors and rimcazole-treated tumors, suggesting that expression of σ-1 and σ-2 receptors is preserved after 2 wk of rimcazole treatment.

Expression of σRs in 4-wk-old A375M tumor xenografts: σ-1 receptors (A) and σ-2 receptors (B).
Effects of Rimcazole Treatment on Tumor Growth
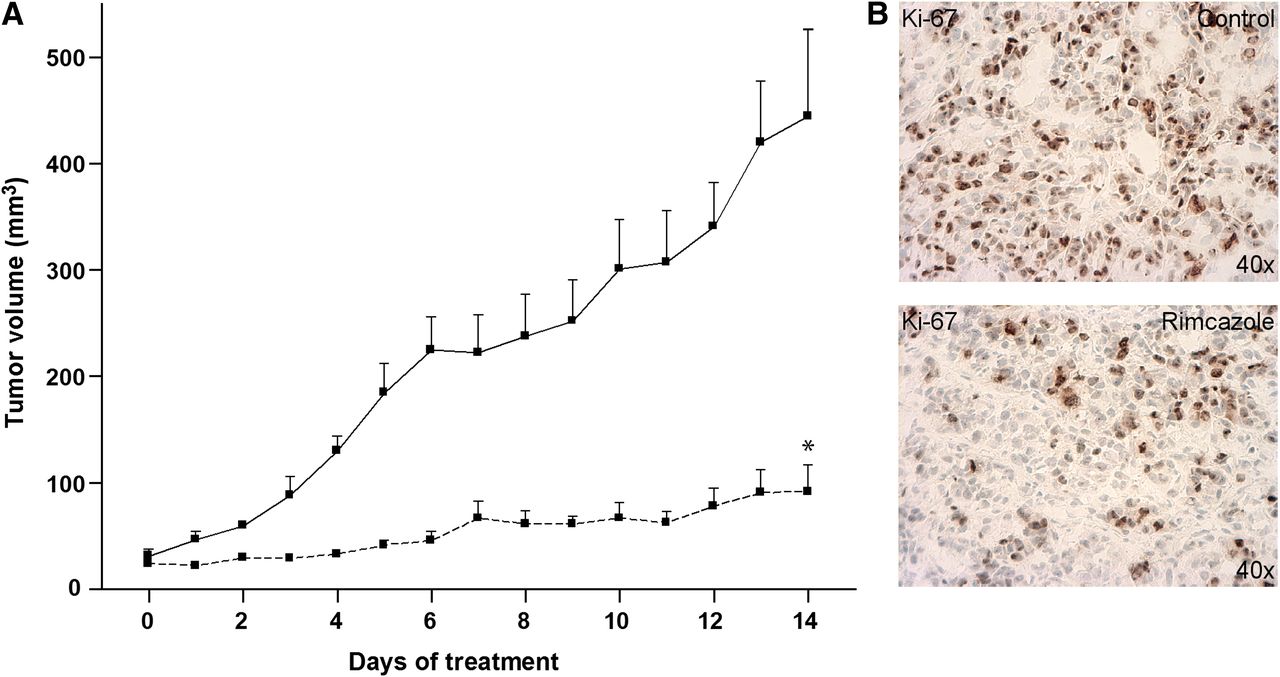
In all studied mice, A375M tumors formed palpable masses 11–12 d after inoculation. Treatment of the control group (n = 5) and rimcazole group (n = 5) started on day 14 after inoculation, when the tumor reached a size of 41 ± 6 mm3. Tumor size at the beginning of treatment was not significantly different between the controls and rimcazole-treated group. The tumor growth curve obtained from caliper measurements indicated that rimcazole rapidly inhibited tumor growth (Fig. 2A). The significant reduction in tumor growth was observed already at the fourth day of treatment and onward. On the last day of rimcazole treatment, tumor volume from caliper measurements in the rimcazole-treated group was 4.8-fold (79%) smaller than in the control group (P < 0.0001). These volumes corresponded to tumor sizes determined on the last day of treatment, which showed a greater than 4.4-fold (77%) reduction (from 436 ± 117 to 100 ± 26 mm3, P < 0.03). Because σ-ligands have both tumoricidal and antiproliferative activity, we used a proliferation marker, Ki-67, to check whether reduced tumor size was due to growth inhibition by rimcazole. Tumor samples from rimcazole-treated mice showed a decrease in nuclear expression of Ki-67 (46.86% ± 2.49%) in comparison to samples from untreated mice (70.29% ± 2.36%) (Fig. 2B).

Rimcazole-induced growth inhibition of human A375M melanoma. (A) Tumor size determined by caliper measurements in control (n = 5, solid line) and rimcazole-treated (n = 5, dashed line) groups. (B) Decrease of Ki-67 expression in A375M melanoma determined by immunohistochemical staining after 14 d of rimcazole treatment. *Significant difference, P < 0.0001.
Adverse Effects of Rimcazole Treatment
Mice treated with rimcazole (26 mg/kg) did not show any changes in behavior. However, 1 mouse from the rimcazole-treated group contracted diarrhea of unknown origin on day 6–7 of treatment, which persisted until the end of the experiment. None of the rimcazole-treated mice experienced treatment-related death. The body weight of vehicle- and rimcazole-treated mice remained constant during the period of treatment (Fig. 3A). Blood glucose levels in the control group (8.26 ± 0.24 mmol/L) and the rimcazole-treated group (7.83 ± 1.46 mmol/L) were not significantly different.
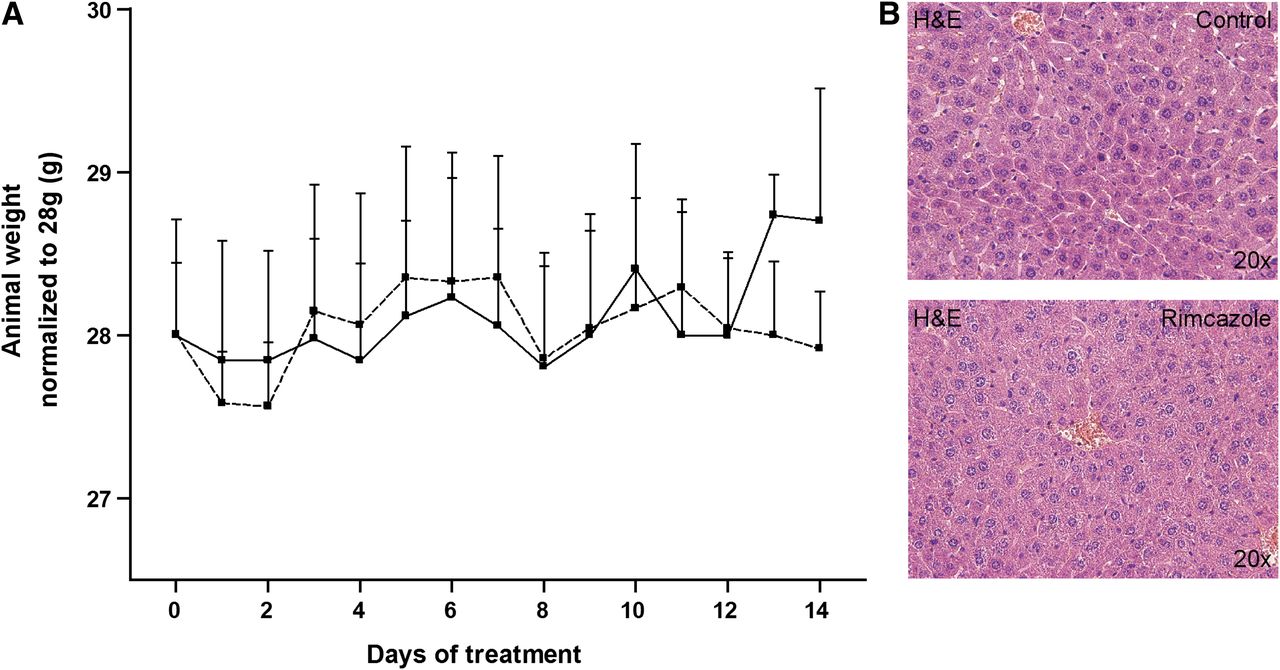
Lack of adverse effects after rimcazole treatment. (A) Body weights in control (solid line) and rimcazole-treated (dashed line) groups were not significantly different. (B) No hepatic injury or inflammation was detected by hematoxylin and eosin staining of formalin-fixed liver sections after 14 d of rimcazole treatment. H&E = hematoxylin and eosin.
The liver is an organ with high σR expression, thus it could be particularly susceptible to treatment-induced side effects. Examination of hematoxylin and eosin–stained liver sections from control and rimcazole-treated animals revealed no obvious hepatic injury or inflammation (Fig. 3B), although a slight increase in hepatocyte mitosis was noticed (10.0 ± 1.1 mitotic cells in the treated group vs. 4.4 ± 0.2 in controls).
Effects of Rimcazole Treatment on Tumor 18F-FDG Uptake
Small-Animal PET Scans
18F-FDG visualized all A375M tumors. The tracer showed a heterogeneous distribution in tumors, with low uptake in the necrotic regions. Necrotic center in the tumor was visible in PET images in 3 of 5 control animals and in 1 of 5 rimcazole-treated mice. Generally, necrosis was found in A375M tumors bigger than 250 mm3. The fraction of necrosis in tumors appeared to be related to tumor volume but was not proportional to changes of 18F-FDG SUV (data not shown). Tumor volumes from manually drawn 3-dimensional regions of interest corresponded to the volumes estimated from tumor weight or, in the case of scan 1 and scan 2, caliper measurements. However, in 1 control animal tumor size was underestimated by caliper measurements because the tumor had grown into the underlying muscle tissue.
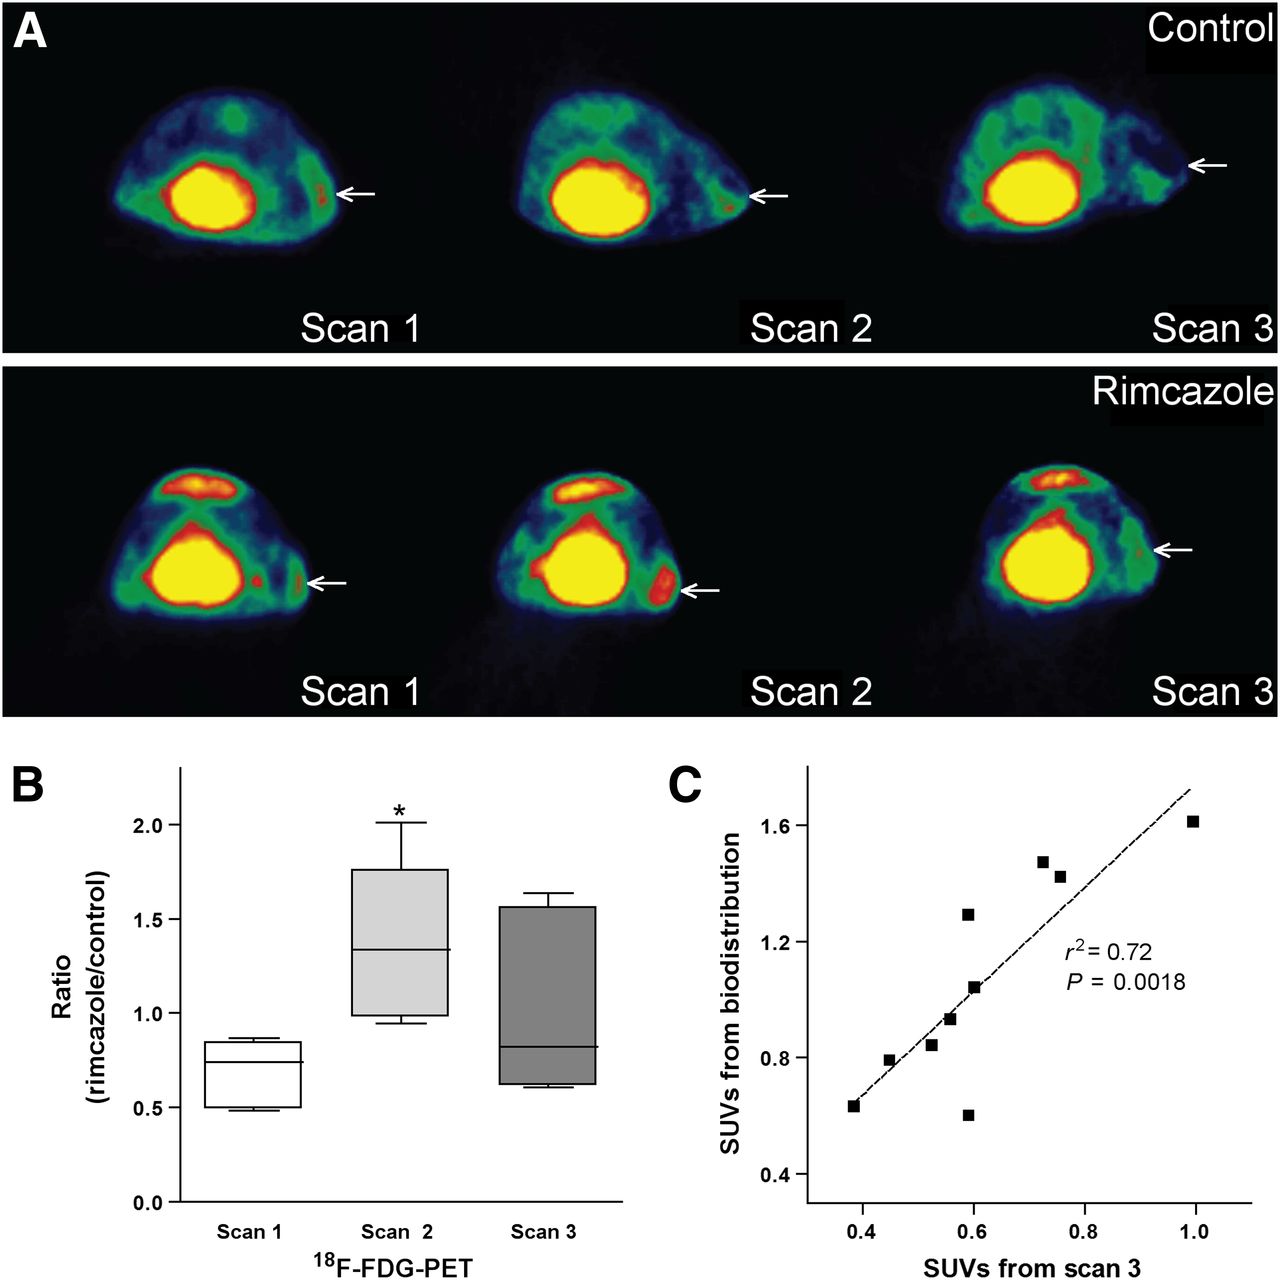
On day 7 (scan 2) of treatment, 18F-FDG uptake corrected for blood glucose levels showed an increase in 3 animals and a decrease in 2 animals from the rimcazole-treated group, whereas it was unchanged in 1 animal and decreased in 4 animals from the control group, all with respect to 18F-FDG uptake in scan 1 (before treatment) (Supplemental Fig. 1). These increases or decreases were not related to changes in tumor volume. One of the 2 animals from the rimcazole-treated group showing a decrease of 18F-FDG uptake on day 7 was the mouse with diarrhea. When mean 18F-FDG uptake in control and rimcazole-treated groups on day 7 and day 1 were compared, no statistically significant differences were noted. However, the ratio of mean 18F-FDG uptake in rimcazole-treated to control animals was significantly (2-fold) increased on day 7 of treatment (from 0.68 ± 0.08 in scan 1 to 1.36 ± 0.19 in scan 2, P < 0.02) (Fig. 4B). The mean tumor uptake of 18F-FDG can be underestimated when the necrotic center is included in the analysis, whereas maximal tracer uptake is not affected by this procedure. Comparison of maximal uptake in control and rimcazole-treated groups gave similar results as comparison of mean uptake (Supplemental Fig. 2). The increase in ratio of maximum 18F-FDG uptake in rimcazole-treated to control animals on day 7 was also significant (1.7-fold, P < 0.05).

Mean 18F-FDG uptake at different time points after rimcazole treatment. (A) Transverse 18F-FDG small-animal PET images of single control (upper) and rimcazole-treated (lower) mouse. Position of tumor is indicated by arrow. (B) Rimcazole-induced transient increase of 18F-FDG uptake in tumor at day 7 of treatment. (C) 18F-FDG uptake calculated from manually drawn regions of interest in small-animal PET images corresponds rather closely to 18F-FDG uptake measured in biodistribution study. *Significant difference, P < 0.05.
On day 14 (scan 3), 18F-FDG uptake corrected for blood glucose levels showed a decrease in 4 animals and a small increase in 1 animal from the rimcazole-treated group, whereas in the control group a decrease was noted in 4 animals and no change was seen in 1 animal (the same as in scan 2), all with respect to 18F-FDG uptake in scan 1. The decrease in 18F-FDG uptake was statistically significant in the control group but not in the rimcazole-treated group. The ratio of mean 18F-FDG uptake in rimcazole-treated to control animals in scan 3 was similar to the value in scan 1 (Fig. 4B).
Tumor SUVs from a PET scan and the later biodistribution study were closely correlated (P < 0.002, r2 = 0.72) (Fig. 4C).
Biodistribution
The biodistribution study on day 14 indicated that rimcazole treatment had little impact on 18F-FDG uptake in most tissues (Table 1). A small but significant increase of SUV was observed in liver and pancreas (P < 0.02 and P < 0.01, respectively) after correction for blood glucose level.
Protein Expression in Rimcazole-Treated A375M Cells
Rimcazole dose-dependently and time-dependently increased hexokinase II and GLUT2 expression in A375M cells (Fig. 5B; Supplemental Fig. 3). The maximal increase (hexokinase II, 1.88 ± 0.44-fold, P < 0.05; GLUT2, 1.54 ± 0.15-fold, P < 0.01) was observed after 16- and 24-h treatment with 15 μM rimcazole, respectively. Akt activation (P-Akt) was already noted at 4 h, and poly(ADP-ribose) polymerase (PARP) cleavage (cPARP) occurred after 16 h of rimcazole treatment.

Changes in protein expression: GLUT2 (A); hexokinase II (B); and Akt, P-Akt, PARP, and cleaved PARP after rimcazole treatment (C). *Significant difference, *P < 0.05. **Significant difference, P < 0.01.
DISCUSSION
Rimcazole (at 26 mg/kg) caused a 4.4- to 4.8-fold reduction of human A375M melanoma tumor growth by the end of the (14 d) treatment (Fig. 2). This marked reduction of tumor size was, at least in part, due to inhibition of proliferation, as indicated by decreased Ki-67 staining (Fig. 2). A similar effect of rimcazole has been observed in mammary carcinoma (MDA-MB 468, MDA-MB 435, MCF-7), lung cancer (HT1299), and prostate cancer (PC3M) xenografts (15). Growth inhibition similar to what we observed in A375M tumors was seen in MCF-7 carcinomas (3-fold reduction of tumor growth after 14 d of treatment), whereas a stronger tumoricidal effect was noted in H1299 tumors (>10-fold reduction). However, the concentration of rimcazole used in these studies was higher (40 mg/kg).
A375M melanoma maintains its expression of both σR subtypes after being xenografted (Fig. 1). Earlier communications have shown that repeated haloperidol treatment decreases σ-1 receptor but not σ-2 receptor binding without affecting σ-1 receptor messenger RNA levels in guinea pig brain (32), and σ-1 and σ-2 receptor densities are reduced (both by 26%–27%) after 1 or 2 d of in vivo treatment of rat gliomas with doxorubicin (33). The observation that σR binding is preserved in melanomas during in vivo treatment indicates that melanoma cells are not likely to develop resistance to rimcazole within the treatment period.
Absence of Adverse Effects
Although peak concentrations of rimcazole in the liver are 20–30 times higher than those in plasma (15), we detected no signs of fibrosis or steatosis after histologic examination of liver slices or any loss of hepatic tissue but rather a slightly increased population of dividing hepatocytes after rimcazole treatment. During our daily monitoring of animal welfare, no apparent adverse effects of rimcazole were noted (Fig. 3). These findings are consistent with low toxicity of σ-ligands toward nontumor tissue in concentrations toxic for cancer cells (15,31). Thus, rimcazole strongly inhibited melanoma growth but did not result in any overt toxicity.
18F-FDG Uptake in Melanomas
On the basis of the documented effect of blood glucose levels on 18F-FDG uptake, we used a glucose-normalization procedure to compare 18F-FDG data of individual animals and scans obtained on different days.
We observed an increase of 18F-FDG uptake in 60% of the rimcazole-treated animals and none of the control animals after 7 d of treatment (PET images, Fig. 4A). The magnitude of the increase in the rimcazole-treated group was variable, perhaps because scan 2 was made after 7 d whereas the timing of the 18F-FDG increase can vary in different animals. It may be necessary to acquire 18F-FDG scans earlier (e.g., after 1 d of treatment rather than 7 d) to predict later reduction of tumor growth from the 18F-FDG uptake increase. We did not observe any correlation between the magnitude of the rimcazole-induced increase of 18F-FDG uptake and rimcazole-induced inhibition of tumor growth (data not shown).
Because of a large interindividual variability in 18F-FDG uptake, the mean SUV of 18F-FDG in the control and rimcazole-treated groups was not significantly different. The effect of drug treatment on tumor metabolism is better visible when ratios of 18F-FDG uptake in treated and untreated animals are compared (Fig. 4B). After 7 d, this ratio was significantly increased, compared with the ratio before treatment. After 14 d, the ratio had returned to the pretreatment level (Fig. 4B). In an in vitro study from our institution, we observed a marked increase in 18F-FDG uptake of glioma cells after 24 h of haloperidol, rimcazole, or (+)-pentazocine treatment (28). Apparently, rimcazole causes transient increases of 18F-FDG uptake both in vivo and in vitro.
A transient increase of 18F-FDG uptake frequently occurs in tumors during hormonal therapy or radiotherapy and was proposed as an indicator of hormone responsiveness in breast cancer (34,35). Researchers assumed that inflammatory processes occurred or that the therapeutic drugs were partial agonists. Because the athymic mice that we used do not have functional T-lymphocytes, it is unlikely that the rimcazole-induced increase of 18F-FDG uptake was due to an inflammatory process. By binding to σ-1 and σ-2 receptors, rimcazole may activate several downstream signaling cascades. In rimcazole-treated A375M cells, we observed a marked decrease of cellular adenosine triphosphate after 24 h (36). Other groups have also reported decreases of adenosine triphosphate in neuroblastoma and melanoma cells treated with σ-ligands (18,21). Tumor cells depleted of adenosine triphosphate may try to restore their initial energy levels by increasing the expression of GLUTs or glycolytic enzymes, resulting in increased uptake of 18F-FDG. Indeed, we observed increased GLUT2 and hexokinase II expression in rimcazole-treated A375M cells, accompanied by activation of Akt and PARP cleavage. Activated Akt generally executes prosurvival functions, whereas cleaved PARP is a sign of ongoing apoptosis. Stimulation of the mitochondrial apoptotic pathway can activate Akt, which in turn delays execution of apoptosis (37). Future studies should examine the impact of combined treatment of tumors with σ-ligands and Akt inhibitors.
18F-FDG Uptake in Peripheral Organs
Our biodistribution data indicate increased SUV but not tissue-to-plasma ratios of 18F-FDG in the liver and pancreas after treatment with rimcazole (Table 1). Hepatocytes have high and pancreatic exocrine glandular and skeletal muscle cells have moderate σ-1 receptor expression (www.proteinatlas.com). High-affinity binding sites for (+)-pentazocine are present in outer mitochondrial membranes of rat liver (38).
The first possible explanation for increased glucose uptake in the liver is a slightly increased mitotic division and, therefore, increased energy requirements of hepatocytes (see the “Absence of Adverse Effects” section). Another possible mechanism is a stimulating effect of rimcazole on glycogenesis. Increased levels of blood glucose activate glycogen production in the liver. Such increases of plasma glucose have been reported in humans after treatment with haloperidol (39). We did not observe any changes in blood glucose levels during rimcazole treatment, but glucose was measured 16 h after the last rimcazole administration just before each small-animal PET scan. Thus, transient increases of blood glucose may have been missed. A third explanation for increased glucose uptake may be activation of hepatic glycogenesis by insulin. σ-ligands are known to affect insulin secretory responses in rat islets of Langerhans in an imidazoline-independent but glucose-dependent manner (39). Insulin increases glucose uptake from the blood by liver and muscle (for production of glycogen) and by adipose tissue (for production of fat). Increased glucose uptake in the pancreas could be related to increased energy demand of this organ for insulin production.
CONCLUSION
Rimcazole strongly inhibited the growth of A375M melanoma in vivo. A transient increase of 18F-FDG uptake was seen on day 7 in most rimcazole-treated tumors but not in control tumors. This early increase may be related to tumor response and later growth inhibition. When 18F-FDG PET is applied for therapy monitoring during σ-ligand treatment in humans, the possibility of a transient increase of 18F-FDG uptake should be considered.
DISCLOSURE
The costs of publication of this article were defrayed in part by the payment of page charges. Therefore, and solely to indicate this fact, this article is hereby marked “advertisement” in accordance with 18 USC section 1734. No potential conflict of interest relevant to this article was reported.
Acknowledgments
We thank Dr. Arjan Diepstra and Janneke Wiersema-Buist for providing support in histological analysis, Jurgen Sijbesma for excellent assistance during small-animal PET imaging, and Prof. Harald Wajant for the Western blot (WB) reagents.
Footnotes
Published online Aug. 12, 2013.
- © 2013 by the Society of Nuclear Medicine and Molecular Imaging, Inc.
REFERENCES
- Received for publication March 5, 2013.
- Accepted for publication April 4, 2013.


Jump to section
Related Articles
Cited By...
- No citing articles found.