


Abstract
Breast cancer is characterized by elevated glucose consumption resulting in increased uptake of 18F-FDG. However, tracer uptake varies considerably among tumors imaged with PET. This study compared histologic and immunohistochemical tissue analysis of breast carcinomas with preoperative FDG uptake assessed by PET to identify tumor characteristics that define the degree of tracer accumulation. Methods: FDG uptake in breast tumors was quantified by calculating standardized uptake values (SUVs) corrected for partial-volume effect and normalized to blood glucose level at the time of tracer injection. The histologic sections of 50 invasive and 6 noninvasive breast carcinomas were analyzed for histologic type, microscopic tumor growth pattern, percentage of tumor cells, presence of inflammatory cells, density of blood vessels, histopathologic grading, tumor cell proliferation (mitotic rate and antibody binding of MIB-1), expression of estrogen and progesterone receptors, and expression of the glucose transporter protein Glut-1. Results: A positive correlation was found between FDG uptake and histologic tumor type (ductal vs. lobular; P = 0.003), microscopic tumor growth pattern (nodular vs. diffuse; P = 0.007), and tumor cell proliferation (MIB-1; P = 0.009). Tumors with diffuse growth patterns had significantly lower SUVs compared with clearly defined tumors. A weak relationship was found between FDG uptake and the percentage of tumor cells (P = 0.06). Lower densities of blood vessels corresponded to higher FDG uptakes (P = 0.08). However, even significant correlations showed poor correlation coefficients. No relationship was found between FDG uptake and the following: tumor size; axillary lymph node status; percentage of necrotic, fibrotic, and cystic compounds; presence of inflammatory cells; steroid receptor status; and expression of Glut-1. Conclusion: Histologic and immunohistochemical tissue analysis was unable to sufficiently explain the variation of FDG uptake in breast cancer. The degree of metabolic changes after malignant transformation is most likely explained by a complex interaction between cellular energy demand and tumoral microenvironment. Therefore, FDG PET imaging may not be used to estimate tumor biologic behavior of breast cancer such as differentiation, histopathologic grading, cell proliferation, or axillary lymph node status.
The PET technique enables visualization of metabolic pathways and therefore offers a unique opportunity for noninvasive tissue characterization. 18F-FDG has been shown to be a suitable tracer to study the increased glucose consumption of malignant tumors. FDG PET imaging was suggested to improve the diagnostic procedures of patients with malignant diseases by aiding in differentiating benign and malignant tumors, assessing the extension of disease, detecting tumor recurrence, and monitoring the response to therapy.
Breast cancer is frequently characterized by increased FDG uptake, and several studies have investigated the diagnostic accuracy of breast imaging with PET (1–8). The clinical application of PET is currently restricted by its limited sensitivity in detecting small breast carcinomas (stage pT1). However, PET can identify larger tumors with high accuracy and has shown encouraging results in detecting regional (axillary) lymph node metastases and whole-body staging. An overview has been published (7).
Breast carcinomas display a considerable variation in FDG uptake (2–7). Tumor characteristics that explain the degree of glucose metabolism and subsequent FDG accumulation need to be determined. Therefore, many variables regarding the cellular level as well as the microenvironment of tumor masses have to be considered. In vitro studies revealed that FDG uptake may be determined mainly by the number of viable tumor cells (9). Nontumoral tissue such as necrotic and fibrotic tissue may reduce tracer uptake, whereas the presence of inflammatory cells may result in an increased FDG accumulation (10,11). FDG passes the cellular membrane by facilitated transport through glucose transporter proteins and is subsequently phosphorylated by intracellular hexokinase. The expression of different types of glucose transporters and hexokinases has been suggested to determine the level of FDG uptake in cancer tissue. In particular, overexpression of the glucose transporter I (Glut-1) has been identified in breast carcinomas (12).
The aim of this study was to compare the FDG uptake of breast cancer with histologic and immunohistochemical tissue analysis. Therefore, histologic sections were analyzed for histologic tumor type; percentage of tumor cells; presence of inflammatory cells; necrotic, fibrotic, and cystic compounds; density of blood vessels; tumor grading; tumor cell proliferation (mitotic rate and antibody binding of MIB-1); estrogen and progesterone receptor expression; and expression of Glut-1.
MATERIALS AND METHODS
Patients
PET imaging of the breast was performed on women with abnormal mammography findings or palpable breast masses who were scheduled to undergo surgery. Details of the protocol were explained by a physician, and written informed consent was obtained from all patients. The study protocol was approved by the committee for human research at the Technische Universität München.
PET Imaging
Two whole-body PET scanners (ECAT 951R/31 and ECAT EXACT; Siemens CTI, Knoxville, TN) were used and provided an axial field of view of 10.5 and 15.8 cm, respectively, resulting in 31 (47) transverse slices with a slice thickness of 3.4 mm. Patients fasted for at least 4 h before PET imaging. The serum glucose level was measured before the intravenous administration of 240–400 MBq (∼10 mCi) FDG. All patients were studied in the prone position after comfortable positioning on the scanner table with a foam rubber support and both arms at their sides. For optimal tumor localization, a hole in the foam ensured no deformation of the breast. Emission scans of the breast, acquired in one bed position, were obtained on all patients 40–60 min after tracer injection. Consecutive transmission scans were obtained with 68Ge rod sources (15 min increasing up to 20 min, depending on the activity of the rod sources). Emission data corrected for random events, dead time, and attenuation were reconstructed with filtered backprojection (Hanning filter with cutoff frequency of 0.4 cycle per bin). The image pixel counts were calibrated to activity concentration (Bq/mL) and were decay corrected using the time of tracer injection as the reference. The resulting in-plane image resolution of transaxial images was ∼8 mm full width at half maximum (FWHM) with an axial resolution of ∼5 mm FWHM for both scanners.
Quantitative Image Analysis
Circular regions of interest (ROIs) were placed manually over the breast carcinomas by one observer. ROIs were drawn exactly around the tumor using images normalized by parametric standardized uptake values (SUVs). These images were displayed on the monitor screen in a linear gray scale and scaled from an SUV of 0 to 5. The ROI value used for this analysis was the average SUV within the ROI. SUVs were calculated by normalization of regional radioactivity concentration to injected dose and body weight. Partial-volume correction was used for lesions with focally increased FDG uptake. The correction used appropriate recovery coefficients derived from phantom studies simulating lesions of various sizes and uptake values (4). Furthermore, SUVs were normalized to blood glucose (SUV av-pv-glc) using a level of 100 mg/100 mL as the reference (4).
Histopathologic Evaluation
All patients underwent surgery of suspected breast tumors. Tissue specimens were analyzed using the current World Health Organization classification for histologic classification. Tumor staging was based on the greatest dimension using the TNM classification. Microscopic analysis of tumor tissue was performed after staining with hematoxylin and eosin. Representative sections of tumors were visually analyzed for the percentage of tumor cells and necrotic, fibrotic, and cystic compounds. The presence of inflammatory cells was graded as (−), as (+) if only isolated lymphocytes and granulocytes were present, as (++) for modest infiltration, and as (+++) for relatively high infiltration. The density of blood vessels was visually graded as (+), (++), and (+++). The shape of tumors was classified as nodular (clearly visible tumor borders), irregular, radial (diverging in all directions from the center of the tumor), and diffuse growth pattern (without clearly visible tumor borders). The degree of tubule formation by tumor cells, nuclear pleomorphism, and mitotic counts were used for the grading of invasive breast cancer as described by Bloom and Richardson (13). The monoclonal antibody MIB-1 reacts with a nuclear cell proliferation–associated antigen that is expressed in all active parts of the cell cycle. The results of immunohistochemistry of MIB-1 were expressed as the percentage of tumor cells with positive staining. Mitotic figure counts were assessed as the average number of mitotic counts per 10 high-power fields. The expression of estrogen and progesterone receptors in malignant tumors was analyzed immunohistochemically by routine procedures (14). Quantification was performed using the immunoreactive score of Remmele and Stegner (15). The expression of Glut-1 was assessed immunohistochemically using the polyclonal antibody anti-Glut-1 (East Acres Biologicals, Southbridge, MA). The quantification of staining was accomplished by applying an immunoreactive score according to the immunohistologic analysis used for steroid hormone receptors (15). Briefly, the tumors were categorized by the percentage of tumor cells with positive staining: 0%–20% (I), 21%–50% (II), 51%–80% (III), and 81%–100% (IV). The intensity of staining was categorized as weak staining (I), medium staining (II), and intense staining (III). The immunoreactive score was calculated by multiplication of the groups, resulting in a scale ranging from 1 to 12. To reduce variability in the staining procedure, all available tumors (frozen in the tumor bank) were stained on the same day.
Statistical Analysis
The Kruskal–Wallis test was used to test differences between SUVs and histologic type, tumor shape, tumor stage, infiltration of lymphocytes, density of microvessels, and tumor grading. The Mann–Whitney U test examined differences between SUVs and axillary lymph node status, between invasive lobular and ductal carcinomas, between grade 2 and grade 3 breast carcinomas, and in steroid receptor status. Regression analysis was used to determine relationships between SUVs and tumor size, mitotic counts, immunohistochemistry of MIB-1, and the percentage of tumor cells.
RESULTS
Fifty invasive breast carcinomas and 6 noninvasive carcinomas from 46 patients were analyzed. Tumors consisted of 36 invasive ductal carcinomas, 14 invasive lobular carcinomas, 4 noninvasive ductal carcinomas, and 2 noninvasive lobular carcinomas. The mean patient age was 51.0 ± 8 y. Sixteen patients were premenopausal, 9 were perimenopausal, and 21 were postmenopausal. The mean blood glucose level at the time of tracer injection was 75.3 ± 16.2 mg/100 mL.
As shown in Figure 1A, invasive ductal carcinomas exhibited significantly higher FDG uptake (P = 0.003) than did invasive lobular carcinomas (SUV 3.7 ± 2.2 vs. 2.1 ± 1.4). The number of in situ carcinomas was too small for statistical analysis; however, the bar graphs show a similar pattern for ductal and lobular in situ carcinomas. The mean tumor diameter was 2.4 ± 1.5 cm, and no relationship was found between tumor size (Fig. 1B) and FDG uptake (r = 0.06; P = 0.5). Therefore, no positive correlation between SUV and tumor stage (P = 0.36) was observed. The degree of FDG accumulation in primary breast carcinomas did not depend on the axillary lymph node status (P = 0.29). However, primary tumors with axillary lymph node metastases (n = 20) had slightly higher FDG uptake (3.3 ± 2.1 vs. 2.9 ± 2.1) than did tumors that did not metastasize (n = 26).

Comparison between SUVs of breast carcinomas and histologic tumor type (A), tumor size (B), tumor growth pattern (C), percentage of tumor cells (D), presence of inflammatory cells (E), and density of tumor capillaries (F). DCIS = ductal carcinoma in situ; IDC = invasive ductal carcinoma; ILC = invasive lobular carcinoma; LCIS = lobular carcinoma in situ.
Twenty-three of 49 tumors available for analysis (47%) showed a nodular growth pattern with clearly visible tumor borders, 4 (8%) exhibited diffuse infiltration of surrounding tissue, 6 (12%) had radial tumor growth, and 16 (33%) were irregularly shaped but had clearly visible tumor borders (Fig. 1C). Significantly higher SUVs were found for nodular tumors than for tumors with a diffuse growth pattern (P = 0.007).
On average, breast carcinomas consisted of 50% ± 19% viable tumor cells, 35% ± 17% connective tissue, 12% ± 12% fat tissue, 7% ± 10% necrotic areas, and 5% ± 5% cystic areas. The percentage of tumor cells within breast carcinomas did not correlate with FDG uptake (Fig. 1D). The presence of inflammatory cells was <5% in most tumors. Of 50 breast carcinomas, no inflammatory cells were found in 11 (22%), isolated lymphocytes and granulocytes (+) were present in 13 (26%), modest infiltration (++) of inflammatory cells was found in 18 (36%), and relatively high infiltration (+++) was found in 8 (16%). Figure 1E shows no significant difference among the groups. Visual analysis of vascularization revealed 40 tumors with a low density of capillaries (+), 6 with a medium density (++), and 4 with a high density (+++) (Fig. 1F). No significant relationship was observed between the FDG uptake and the infiltration of inflammatory cells or the density of tumor capillaries. However, an indication (P = 0.08) of an inverse relationship was seen between the SUV and the number of microvessels.
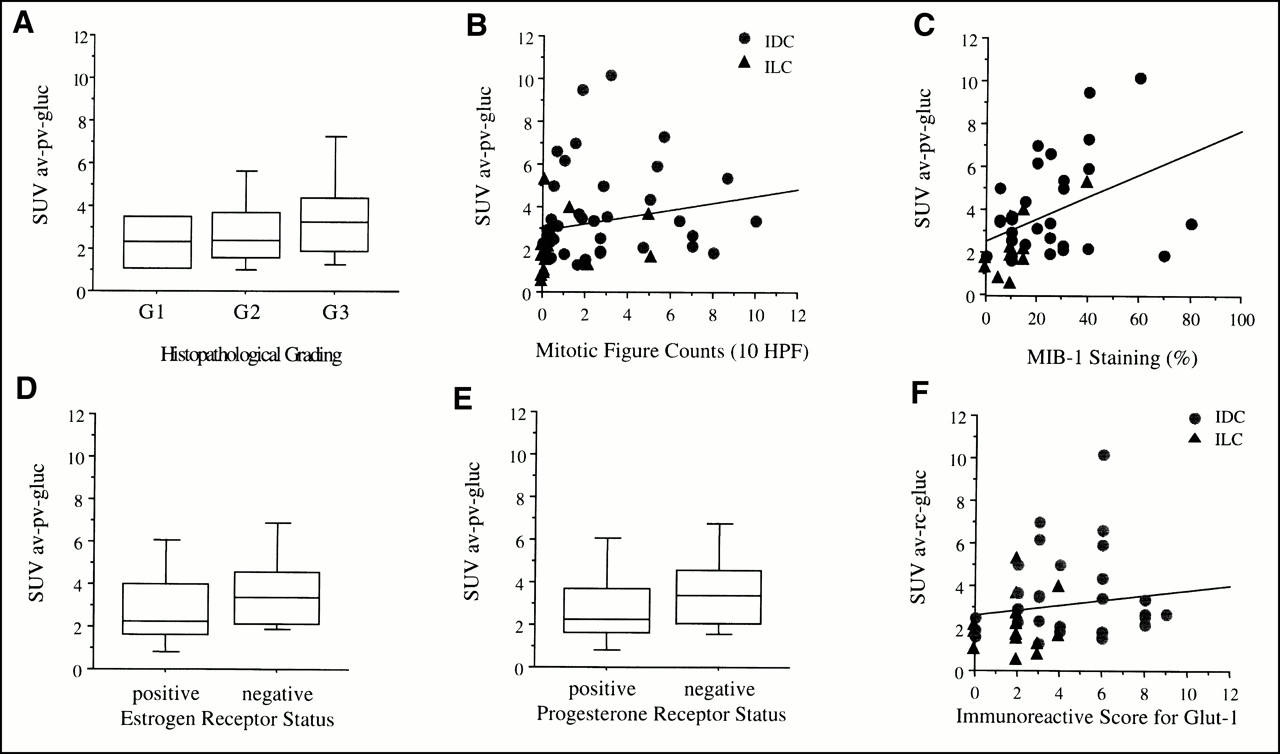
With regard to histopathologic grading, 1 tumor was classified as grade 1, 26 were grade 2, and 23 were grade 3. The bar graphs in Figure 2A show no significant difference between the groups. The number of mitotic figure counts (Fig. 2B) did not correlate with FDG uptake (P = 0.2), whereas the staining with MIB-1 (Fig. 2C) revealed a significant correlation between FDG uptake and cell proliferation (P = 0.009). The immunoreactive score of the estrogen (Fig. 2D) and progesterone receptor status (Fig. 2E) did not correlate with the intensity of FDG uptake as well as Glut-1 (Fig. 2F). Table 1 summarizes the results of the statistical analysis of the relationship between SUVs and the various parameters discussed.
Relationship Between SUVs and Various Parameters

Comparison between SUVs of breast carcinomas and histopathologic grading (A), mitotic figure counts (B), staining with MIB-1 antibody (C), estrogen receptor status (D), progesterone receptor status (E), and immunohistochemistry for Glut-1 (F). HPF = high-power field; IDC = invasive ductal carcinoma; ILC = invasive lobular carcinoma.
DISCUSSION
The accumulation of FDG in breast cancer depended on histologic type (ductal vs. lobular), microscopic tumor growth pattern (nodular vs. diffuse), and immunoreactivity with the monoclonal antibody MIB-1 reflecting tumor cell proliferation. However, SUVs showed no correlation with axillary lymph node status, tumor size, percentage of tumor cells, presence of inflammatory cells, histopathologic grading, steroid receptor status, and expression of Glut-1.
Dose uptake ratios and SUVs are widely used for quantification of regional tracer uptake in PET imaging. These methods account for variation in tracer concentration depending on injected dose and the patient’s body weight, thus enabling comparison of regional tracer uptake in different patients. Previously, we found a good correlation of SUVs with more sophisticated dynamic measurement of the tracer input function and calculation of the tracer influx constant (4). However, SUV measurements are greatly affected by partial-volume effects, the duration of tracer uptake, and the blood glucose level at the time of tracer injection. To account for these effects, we standardized the measurement of SUVs from 40 to 60 min after tracer administration, applied appropriate recovery coefficients, and normalized SUVs to individual blood glucose level (SUV av-pv-glc) at the time of tracer injection. Other factors affecting the SUV measurements, such as the lean body mass or the body surface area, have not been taken into account because we previously did not find a significant improvement in diagnostic accuracy in quantitative image analysis of breast imaging. Various comparisons of SUV and tumor biologic characteristics reported in the literature apply only partial corrections or none.
PET imaging has been reported to provide a low sensitivity to detect small breast carcinomas (3). Partial-volume effects play an important role, but an increase in metabolic activity with tumor growth may also occur. However, we did not recognize a relationship between FDG accumulation and tumor size (Fig. 1B). The same observation has been reported for pancreatic carcinoma (16,17). On the other hand, we found a significant difference in FDG uptake depending on the microscopic growth pattern of breast cancer (Fig. 1C). Nodular tumors with clearly visible tumor borders had a higher FDG uptake than did breast carcinomas with diffuse infiltration of surrounding tissue (SUV 4.1 ± 2.3 vs. 0.8 ± 0.2). Tumors with radial growth and irregularly shaped tumor borders exhibited lower SUV values; however, because their FDG uptake varied widely, the difference was not significant. A potential explanation may be that nonnodular tumors are more influenced by partial-volume effects predominantly in the border area of the tumor. However, four of five tumors with a diffuse growth pattern consisted of lobular carcinomas. Invasive lobular carcinomas had significantly lower FDG uptake (Fig. 1A) compared with invasive ductal carcinomas. This result is consistent with a previous report from Crippa et al. (6), who found a median SUV of 5.6 for invasive ductal carcinoma versus 3.8 for invasive lobular carcinoma. This finding is of particular importance in the clinical application of PET because lobular carcinomas have been found to account for a higher rate of false-negative results (7). In general, invasive lobular carcinoma is more difficult to diagnose than invasive ductal carcinoma by imaging procedures including mammography, sonography, and MRI (18–20). To our knowledge, a biologic explanation for the lower glucose metabolism of lobular differentiated carcinomas has not been identified.
Tissue heterogeneity is an important factor contributing to the total FDG uptake in tumors. The relative composition of malignant tumors ranges from a few transformed cells to >90% of malignant cells. Because of the limited spatial resolution of PET scanners, the signal derived from tumors represents an average FDG uptake in all tumor components. Using animal autoradiographic studies, Kubota et al. (10) showed higher FDG uptake in granulation tissue than in malignant tumor cells. However, components with low metabolic activity—namely, cells containing substantial amounts of mucine, connective tissue, and necrotic areas—may reduce the total FDG uptake in tumors, resulting in false-negative PET results (11). We found only a weak relationship between FDG uptake and the percentage of tumor cells (Fig. 1D). This finding contradicts in vitro studies that suggested that FDG uptake in tumors reflects predominantly the number of viable tumor cells (9). Our observation suggests that the number of tumor cells may gain substantial importance only if the percentage of tumor cells is low (<30%); above this level, the PET signal obtained from tumors reflects primarily the metabolic activity rather than the number of malignant cells. Figure 1D, for example, shows an invasive lobular carcinoma consisting of 20% tumor cells, it was classified as false-negative despite a tumor size of 4 cm in diameter. Generally, breast carcinomas consisting of only scattered distributed malignant cells are difficult to identify in PET images (7). Animal studies have shown that inflammatory cells may significantly contribute to FDG uptake in tumors. Using a mouse tumor model, Kubota et al. (10) found up to 29% of FDG uptake in nontumoral tissue. Newly formed granulation tissue around the tumor, as well as macrophages located predominantly in the margins of necrotic areas, contributed to that finding. However, Brown et al. (11) studied mammary cancers grown in immunocompetent female Lewis rats and found macrophages accounting for only 0.5% of the total cancer cells. Cellular infiltrates of lymphocytes and granulocytes have also been found in human breast cancer (21). However, the extent of infiltration is considerably different from that of experimental animal models (22). Of 50 breast carcinomas, we found almost no inflammatory cells present in 11 (22%), few lymphocytes and granulocytes (+) in 13 (26%), modest infiltration (++) of inflammatory cells in 18 (36%), and relatively high infiltration (+++) in 8 (16%). No relationship was found between the presence of inflammatory cells and the intensity of FDG uptake, supporting the hypothesis that the PET signal reflects predominantly the metabolic activity of malignant cells.
A weak inverse relationship was found between FDG uptake and the density of microvessels (Fig. 1F). Under anaerobic conditions, most malignant tumors metabolize glucose primarily to lactate, which results in higher utilization rates for glucose molecules. When studying the effects of hypoxia on cellular tracer uptake in vitro, Clavo and Wahl (23) found a significant increase in FDG accumulation under moderately hypoxic conditions. Hypoxia is present in tumor tissue beyond 100–200 μm of functional blood supply and is commonly found in solid tumors (24). On the other hand, Oshida et al. (25) reported a positive correlation between SUV and microvessel density in 70 patients with breast cancer. We cannot offer a conclusive explanation for these contradictions; however, different techniques used to assess microvessel density may have contributed to them. Oshida et al. applied immunohistochemistry using a factor VIII–related polyclonal antibody and selected areas for quantification that were considered to have the highest vascularization, whereas we graded the entire tissue section visually for the density of blood vessels. Studies with 15O-labeled water in human squamous cell carcinomas of the head and neck revealed no correlation between tumor perfusion and FDG uptake (26).
Pathologic grade is used to describe the differentiation of tumor tissue reflecting the degree of malignancy. In 1982, Di Chiro et al. (27) reported a positive correlation between FDG uptake and the pathologic grade of gliomas. The mean survival time of patients with tumors exhibiting high glucose utilization was significantly shorter than that of patients with gliomas exhibiting lower glucose utilization (28). However, other groups did not observe such a correlation (29). Several reports found a strong positive correlation between FDG uptake and pathologic grade in bone and soft-tissue sarcomas (30,31). Similarly, in breast cancer patients, Adler et al. (2) found that FDG uptake correlated significantly with the pathologic grade. Two well-differentiated tumors had a dose uptake ratio of 6.2 ± 0.4 compared with 10.8 ± 5.7 (n = 10) for moderately differentiated tumors and 16.2 ± 11.1 (n = 13) for poorly differentiated tumors. Crippa et al. (6) studied 86 breast cancer patients and found significantly higher SUVs in grade 3 tumors (median SUV, 6.2) than in grade 1–2 tumors (SUV, 4.9). We also observed less differentiated tumors exhibiting higher FDG uptake; however, the differences between the groups were not significant (Fig. 2A). The studies mentioned here showed a wide overlap between the groups, suggesting that FDG uptake does not allow direct assessment of the degree of differentiation and the pathologic grade in individual breast cancer patients.
Malignant tumors are characterized by a capacity for progressive growth. With higher growth rates, the number of cells in the S phase is relatively higher and more mitoses are present in histologic sections. Keshgegian and Cnaan (32) compared mitotic figure counts, S-phase fraction by flow cytometry, Ki-67, MIB-1, and proliferating cell nuclear antigen positivity in 135 breast carcinomas and identified the best proliferation markers as being mitotic figure counting or MIB-1 positivity. We found a significant correlation between FDG uptake and the immunoreactivity with MIB-1 but found no correlation with the mitotic figure counts. The monoclonal antibody MIB-1 reacts with a nuclear cell proliferation–associated antigen that is expressed in all active parts of the cell cycle. Cells that undergo division may be characterized by a higher energy demand, resulting in an increased FDG accumulation in tumors with high growth rates. A positive correlation with cell proliferation has been reported in lymphomas, although the number of patients studied was relatively small (n = 23) (33). Crippa et al. (6) compared the thymidine labeling index and SUV in 53 breast cancer patients and found no significant correlation. In human head and neck tumors, Haberkorn et al. (26) identified two groups with low and high FDG uptake but found comparable proliferative activity assessed with flow cytometry. In the group with high FDG uptake, the degree of tracer accumulation was correlated significantly with the proliferation rate, but this relationship was not found in the group with low FDG uptake. Moreover, the slope of the regression function was flat because large differences in proliferation rate resulted in only moderate changes in FDG uptake. In vitro studies indicate that glucose consumption may not be regulated directly by the needs for DNA synthesis. Higashi et al. (9) studied a human ovarian adenocarcinoma cell line at different proliferation rates and observed no correlation with FDG uptake. The positive but weak correlation that we and others observed between FDG uptake and the fraction of proliferating cells in human tumors more likely reflects the aggressiveness of tumors, which is associated secondarily with the proliferative activity. This explanation is supported by a recent study of Oshida et al. (25), who reported a better overall and relapse-free survival of breast cancer patients with low FDG uptake (SUV, <3) compared with patients with higher FDG uptake. Prognostic information obtained from noninvasive FDG PET is potentially important because it could be used for risk stratification and determination of adjuvant therapy. However, we emphasize that no difference was found in FDG uptake of breast carcinomas regarding axillary lymph node status. This result has also been observed in the study of Crippa et al. and may limit the use of FDG PET to assess tumor aggressiveness.
We found no correlation between the expression of estrogen (Fig. 2D) and progesterone receptors (Fig. 2E) and the level of FDG uptake. Similar results were previously reported (6,34). Dehdashti et al. (34) studied 43 patients with primary, recurrent, or metastatic breast carcinoma using 18F-labeled estradiol and FDG and were unable to show any significant relationship between tumor FDG uptake and estrogen status or between FDG and estradiol uptake.
The presence of glucose transporter proteins (Glut) is necessary to facilitate glucose transport through the cellular membrane. High levels of Glut-1 have been reported for various malignant tumors, including breast cancer (12,35,36). In pancreatic cancer, a close relationship was observed between FDG accumulation and immunohistochemical levels of Glut-1 or the content of messenger RNA (35,36). However, Higashi et al. (35) found an enormous range of SUV within the high Glut-1 level group. On the basis of the percentage and intensity of stained tumor cells, we used an immunoreactive score for grading Glut-1 levels but were unable to show a positive correlation between Glut-1 expression and FDG uptake (Fig. 2F). The rate-limiting step for glucose metabolism of tumor cells is still unknown. In the brain, the rate of glucose transport exceeds the rate of glucose utilization, and, therefore, hexokinase activity is considered to be the rate-limiting step. However, in muscle cells, Glut-1 and Glut-4 are stored in cytoplasmic microsomes and are translocated into the cellular membrane, depending on the energy demand (37). In our study, on average, only about 30% of tumor cells were positive for Glut-1. This percentage is lower than that of Brown et al. (12), who found about 60% positive for Glut-1 by immunohistochemistry. However, we also observed a wide inhomogeneity of positive staining within tumors. Therefore, an analysis on the cellular level may be necessary to compare Glut-1 presence in the cellular membrane with intracellular FDG accumulation.
An increase in metabolism, including increased rates of glucose consumption, was found after the activation of oncogenes or the loss of tumor-suppressor genes (38). Cells expressing the ras or src oncogenes exhibited increased rates of aerobic glycolysis and increased levels of glucose transporter proteins within hours after malignant transformation by oncogenic viruses (38). In addition to the increase of glucose transport into the cells, a 5-fold overexpression of the type II hexokinase gene was found in a hepatoma cell line compared with that of normal hepatocytes (39). Recent molecular studies suggest that cellular energy metabolism is affected predominantly by the expression of transcription factors that regulate genes encoding metabolic enzymes after the development of malignancy. The p53 gene, for example, is a tumor-suppressor gene that is often altered in breast cancer, resulting in p53 overexpression (40). Crippa et al. (6) determined mutant and wild-type p53 protein and found a positive correlation between SUV and the level of p53.
Histologic tissue analysis was performed by visual interpretation by one observer to avoid observer variability. However, quantification is difficult to standardize for most of the morphologic criteria applied in this study. Microscopic analysis was based on representative sections from tumors. Nevertheless, considerable difference in spatial resolution limits direct comparison with the macroscopic signal derived from PET images. In the statistical analysis, we did not correct for multiple comparisons. However, even positive correlations had weak correlation coefficients, as shown in Figures 1 and 2.
CONCLUSION
Despite positive correlations found for some morphologic tumor characteristics, histopathology and immunohistochemistry revealed no governing explanation for the variation in FDG uptake of breast carcinomas. The degree of metabolic changes after malignant transformation is most likely explained by a complex interaction between the cellular energy demand and the tumoral microenvironment. The dominant effect among the different components known to influence FDG uptake seems to be unpredictable in individual tumors. Therefore, FDG PET may not be used to estimate tumor biologic behavior of breast cancer such as differentiation, histopathologic grading, cell proliferation, or axillary lymph node status.
Acknowledgments
The authors gratefully acknowledge the effort of the cyclotron and radiochemistry staff. Furthermore, the authors appreciate the excellent technical support of the PET technicians and the editorial help of Jodi Neverve and Leishia Tyndall-Haynes in the preparation of the manuscript.
Footnotes
Received Apr. 5, 2000; revision accepted Jul. 31, 2000.
For correspondence or reprints contact: Norbert Avril, MD, Nuklearmedizinische Klinik, Klinikum rechts der Isar, Technische Universität München, Ismaningerstrasse 22, 81675 Munich, Germany.
REFERENCES
In this issue


Jump to section
Related Articles
Cited By...
- Head-to-Head Evaluation of 18F-FES and 18F-FDG PET/CT in Metastatic Invasive Lobular Breast Cancer
- 18F-FDG PET/CT for Systemic Staging of Newly Diagnosed Breast Cancer in Men
- Lactic Acid Accumulation in the Tumor Microenvironment Suppresses 18F-FDG Uptake
- Evaluation of the Usefulness of FDG-PET/CT for Nodal Staging of Breast Cancer
- Molecular Imaging of GLUT1 and GLUT5 in Breast Cancer: A Multitracer Positron Emission Tomography Imaging Study in Mice
- Tumor Metabolic Features Identified by 18F-FDG PET Correlate with Gene Networks of Immune Cell Microenvironment in Head and Neck Cancer
- Clinicopathological Features of Ductal Carcinoma In Situ from 18F-FDG-PET Findings
- Prospective Clinical Trial of 18F-Fluciclovine PET/CT for Determining the Response to Neoadjuvant Therapy in Invasive Ductal and Invasive Lobular Breast Cancers
- Recurrent patterns of DNA copy number alterations in tumors reflect metabolic selection pressures
- Decoding Intratumoral Heterogeneity of Breast Cancer by Multiparametric In Vivo Imaging: A Translational Study
- Initial Results of a Prospective Clinical Trial of 18F-Fluciclovine PET/CT in Newly Diagnosed Invasive Ductal and Invasive Lobular Breast Cancers
- Novel Strategies for Breast Cancer Imaging: New Imaging Agents to Guide Treatment
- Comparison of 18F-FDG PET/CT for Systemic Staging of Newly Diagnosed Invasive Lobular Carcinoma Versus Invasive Ductal Carcinoma
- Oncogene Pathway Activation in Mammary Tumors Dictates FDG-PET Uptake
- 18F-Fluorodeoxy-glucose Positron Emission Tomography Marks MYC-Overexpressing Human Basal-Like Breast Cancers
- Could Different Hydration Protocols Affect the Quality of 18F-FDG PET/CT Images?
- A {beta}-Camera Integrated with a Microfluidic Chip for Radioassays Based on Real-Time Imaging of Glycolysis in Small Cell Populations
- PET Tumor Metabolism in Locally Advanced Breast Cancer Patients Undergoing Neoadjuvant Chemotherapy: Value of Static versus Kinetic Measures of Fluorodeoxyglucose Uptake
- 18F-FPPRGD2 and 18F-FDG PET of Response to Abraxane Therapy
- 18F-FDG PET of Locally Invasive Breast Cancer and Association of Estrogen Receptor Status with Standardized Uptake Value: Microarray and Immunohistochemical Analysis
- 18F-FDG Uptake in Lung, Breast, and Colon Cancers: Molecular Biology Correlates and Disease Characterization
- 18F-FDG Small-Animal PET/CT Differentiates Trastuzumab-Responsive from Unresponsive Human Breast Cancer Xenografts in Athymic Mice
- The Role of Radiotracer Imaging in the Diagnosis and Management of Patients with Breast Cancer: Part 1--Overview, Detection, and Staging
- Comparison of Integrin {alpha}v 3 Expression and Glucose Metabolism in Primary and Metastatic Lesions in Cancer Patients: A PET Study Using 18F-Galacto-RGD and 18F-FDG
- Biodistribution and Predictive Value of 18F-Fluorocyclophosphamide in Mice Bearing Human Breast Cancer Xenografts
- 18F-FDG PET in Detecting Primary Breast Cancer
- The Effects of Estrogen, Progesterone, and C-erbB-2 Receptor States on 18F-FDG Uptake of Primary Breast Cancer Lesions
- Tumor-Specific Positron Emission Tomography Imaging in Patients: [18F] Fluorodeoxyglucose and Beyond
- Partial-Volume Effect in PET Tumor Imaging
- Monitoring of Early Response to Neoadjuvant Chemotherapy in Stage II and III Breast Cancer by [18F]Fluorodeoxyglucose Positron Emission Tomography
- Expanding Role of Positron Emission Tomography in Cancer of the Uterine Cervix
- A Physiologic Imaging Pilot Study of Breast Cancer Treated with AZD2171
- Metabolic Mapping of MCF10A Human Breast Cells via Multiphoton Fluorescence Lifetime Imaging of the Coenzyme NADH
- Imaging Proliferation in Brain Tumors with 18F-FLT PET: Comparison with 18F-FDG
- 18F-FDG Uptake and Breast Density in Women with Normal Breast Tissue
- Overexpression of Glut1 in Lymphoid Follicles Correlates with False-Positive 18F-FDG PET Results in Lung Cancer Staging
- GLUT1 Expression in Tissue and 18F-FDG Uptake
- Cellular Origin and Molecular Mechanisms of 18F-FDG Uptake: Is There a Contribution of the Endothelium?
- 18F-FDG Uptake in Squamous Cell Carcinoma of the Cervix Is Correlated with Glucose Transporter 1 Expression
- Imaging Proliferation in Lung Tumors with PET: 18F-FLT Versus 18F-FDG
- Metabolic Fate of 18F-FDG in Mice Bearing Either SCCVII Squamous Cell Carcinoma or C3H Mammary Carcinoma
- Whole-Body 18F-FDG PET and Conventional Imaging for Predicting Outcome in Previously Treated Breast Cancer Patients
- Biologic Correlates of 18Fluorodeoxyglucose Uptake in Human Breast Cancer Measured by Positron Emission Tomography