


Abstract
The expression of αvβ3 and glucose metabolism are upregulated in many malignant lesions, and both are known to correlate with an aggressive phenotype. We evaluated whether assessment of αvβ3 expression and of glucose metabolism with PET using 18F-galacto-RGD and 18F-FDG provides complementary information in cancer patients. Methods: Eighteen patients with primary or metastatic cancer (non–small cell lung cancer [NSCLC], n = 10; renal cell carcinoma, n = 2; rectal cancer, n = 2; others, n = 4) were examined with PET using 18F-galacto-RGD and 18F-FDG. Standardized uptake values (SUVs) were derived by volume-of-interest analysis. 18F-Galacto-RGD and 18F-FDG PET results were compared using linear regression analysis for all lesions (n = 59; NSCLC, n = 39) and for primaries (n = 14) and metastases to bone (n = 11), liver (n = 10), and other organs (n = 24) separately. Results: The sensitivity of 18F-galacto-RGD PET compared with clinical staging was 76%. SUVs for 18F-FDG ranged from 1.3 to 23.2 (mean ± SD, 7.6 ± 4.9) and were significantly higher than SUVs for 18F-galacto-RGD (range, 0.3–6.8; mean ± SD, 2.7 ± 1.5; P < 0.001). There was no significant correlation between the SUVs for 18F-FDG and 18F-galacto-RGD for all lesions (r = 0.157; P = 0.235) or for primaries, osseous or soft-tissue metastases separately (P > 0.05). For the subgroup of lesions in NSCLC, there was a weak correlation between 18F-FDG and 18F-galacto-RGD uptake (r = 0.353; P = 0.028). Conclusion: Tracer uptake of 18F-galacto-RGD and 18F-FDG does not correlate closely in malignant lesions. Whereas 18F-FDG PET is more sensitive for tumor staging, 18F-galacto-RGD PET warrants further evaluation for planning and response evaluation of targeted molecular therapies with antiangiogenic or αvβ3-targeted drugs.
Recently, antiangiogenic therapy with drugs such as bevacizumab (Avastin; Roche), a vascular endothelial growth factor (VEGF) antibody, in combination with cytotoxic chemotherapy has proven to be successful in several tumor entities, including metastasized colorectal cancer, breast cancer, and non–small cell lung cancer (NSCLC) (1). Moreover, the multitarget tyrosine kinase inhibitors SU11248 (Sutent; Pfizer) and BAY-43-9006 (Nexavar; Bayer HealthCare), both directed against VEGF receptor, have been successfully used as monotherapy in gastrointestinal stroma tumors and metastatic renal cell carcinomas (2). Consequently, there is a growing demand for imaging modalities that allow for response assessment and pretherapeutic stratification of patients receiving targeted therapies with antiangiogenic compounds. In this respect, imaging of αvβ3 expression is promising for assessment of angiogenesis, as αvβ3 is supposed to be a marker of activated, but not resting, vessels (3). Moreover, drugs targeting the αvβ3 integrin are evaluated in cancer patients in phase 1 and 2 studies (4,5). Therefore, we have developed the αvβ3-specific tracer 18F-galacto-RGD for PET (6). It has been demonstrated that 18F-galacto-RGD PET allows for specific imaging of αvβ3 expression and that a significant correlation of αvβ3 expression and 18F-galacto-RGD uptake exists in tumor xenografts as well as in tumor lesions in cancer patients (7,8). However, up to now, it has not been evaluated how 18F-galacto-RGD behaves in comparison with common tracers of tumor metabolism such as 18F-FDG. This is of great importance, as there are reports describing a correlation between angiogenic activity in tumors and 18F-FDG uptake in vitro and in vivo (9,10). Moreover, both αvβ3 expression and 18F-FDG uptake are believed to correlate with tumor aggressiveness and prognosis in several tumor entities (11–14). Therefore, it cannot be excluded that, ultimately, a tracer such as 18F-FDG provides information similar to that of 18F-galacto-RGD, although both tracers have completely different pharmacodynamic properties. In case of a close correlation between the uptake of these 2 tracers, there would be no need for a specific tracer such as 18F-galacto-RGD, because 18F-FDG is widely available and has been successfully used in clinical routine for years. In this study we compared the tracer uptake of 18F-galacto-RGD and 18F-FDG in primary as well as in metastatic tumor lesions. The goals of this study were to evaluate whether 18F-galacto-RGD and 18F-FDG provide similar or complementary information in cancer patients and to determine the sensitivity of 18F-galacto-RGD for lesion identification.
MATERIALS AND METHODS
Radiopharmaceutical Preparation
Synthesis of the labeling precursor and subsequent 18F labeling were performed as described previously (15).
Patients
The study was approved by the ethics committee of the Technische Universität München, and informed written consent was obtained from all patients. Eighteen patients were included in the study (6 female, 12 male; mean age ± SD, 63.8 ± 8.2 y; range, 52–80 y). Inclusion criteria consisted of biopsy-proven metastatic cancer, as determined by clinical staging including contrast-enhanced CT and 18F-FDG PET/CT in all cases and 111In-octreotide scintigraphy in one case (patient 10; Table 1). Further inclusion criteria were age over 18 y, and the absence of pregnancy, lactation period, and impaired renal function (serum creatinine level > 1.2 mg/dL). For further details on the patient population see Table 1.
Patient Characteristics
Contrast-Enhanced CT
CT was performed on 14 patients with a Sensation 64 CT scanner (Siemens Medical Solutions, Inc.) using the following scan parameters: collimation, 64 × 0.6 mm; 120 kV, 200 quality reference mAs (CareDose 4D); 5-mm reconstructed slice thickness/5-mm reconstruction increment; kernel B30 for soft tissues and B60 for the lung. All scans were performed from the thorax to the pelvis, including the head for patients with NSCLC or if brain metastases were clinically suspected. Scans were performed in deep inspiration in the portalvenous phase 70 s after injection of 150 mL of iodine contrast agent by a power injector (Imeron 300; Altana) using a flow of 3 mL/s, followed by a saline bolus (40 mL, 3 mL/s). In 4 patients, contrast-enhanced CT examinations were performed on the Biograph Sensation 16 PET/CT scanner (Siemens) using the following scan parameters: collimation, 16 × 0.75 mm; 120 kV, 150 mAs; 5-mm reconstructed slice thickness/5-mm reconstruction increment; kernel B30 for soft tissues and B60 for the lung. Scans were performed in shallow expiration from the head to the pelvis 70 s after injection of iodine contrast agent (Imeron 300; Altana) with a flow of 3 mL/s, followed by a saline bolus (40 mL; 3 mL/s). An additional low-dose CT scan of the thorax in deep inspiration for analysis of the lungs was performed afterward (120 kV, 50 mAs). All patients received oral contrast agent 1 h before scanning (Megluminioxitalamat [Telebrix Gastro]; Guerbet).
18F-Galacto-RGD PET
Imaging was performed with an ECAT EXACT PET scanner (Siemens). After injection of 18F-galacto-RGD (182.5 ± 38.2 MBq), a transmission scan was acquired for 5 min per bed position (5 bed positions) using 3 rotating 68Ge rod sources (each with approximately 90 MBq 68Ge). A static emission scan in 2-dimensional mode was acquired in the caudocranial direction on each subject, beginning, on average, 58.9 ± 8.4 min after intravenous injection of 18F-galacto-RGD, covering a field of view from the pelvis to the thorax (5–7 bed positions, 8 min per bed position).
Positron emission data were corrected for randoms, dead time, and attenuation and were reconstructed using the ordered-subsets expectation maximization (OSEM) algorithm using 8 iterations and 4 subsets. The images were corrected for attenuation using the collected transmission data. OSEM images underwent a 5-mm full width at half maximum gaussian after smoothing and were zoomed with a factor of 1.2. For image analysis, CAPP software, version 7.1 (Siemens) was used.
18F-FDG PET
Imaging was performed with a Biograph Sensation 16 PET/CT scanner, which incorporates an ACCEL PET camera and a 16-slice multidetector CT (Siemens). Patients were injected with 18F-FDG after 6 h of fasting. None of the patients was diabetic or had a fasting blood glucose level above 120 mg/dL.
Scanning was performed 61.2 ± 3.6 min after intravenous injection of 463.5 ± 20.4 MBq 18F-FDG. A PET scan was performed in the craniocaudal direction covering a field of view from the head to the pelvis (3-dimensional mode; 7 or 8 bed positions, 2 min per bed position). An unenhanced low-dose CT scan was performed for attenuation correction in shallow expiration (120 kV, 26 mAs; collimation, 16 × 0.75 mm) after the PET scan. CT data were converted from Hounsfield units to linear attenuation coefficients for 511 keV using a single CT energy scaling method based on a bilinear transformation. Emission data were corrected for randoms, dead time, scatter, and attenuation, and the same reconstruction algorithm was applied as that used for the conventional PET data. The images were zoomed with a factor of 1.23. For image analysis, the e-soft software was used (Siemens).
Image Analysis
The emission scans were calibrated to standardized uptake values (SUVs). The SUV was calculated according to the following formula: (measured activity concentration [Bq/mL] × body weight [g])/injected activity [Bq]. Up to 5 lesions were chosen in each patient for measurements of SUVs. If there were >5 lesions present (n = 4 patients), the lesion with the highest tracer uptake in each afflicted organ system (lung, liver, brain, adrenals, bone, lymph nodes, other) was chosen. The maximum number of 5 lesions per patient was chosen to avoid a bias by patients with an exceptionally high number of lesions. A volume of interest (VOI) was drawn around each lesion, encompassing the whole lesion. The outer border of each lesion VOI was semiautomatically defined by an isocontour representing 60% of the maximum activity within the VOI. The mean SUV in this VOI was used for further analysis. For lesions that were not identifiable on 18F-galacto-RGD PET, the VOI was placed at the site of the metastases according to CT and 18F-FDG PET.
For analysis of sensitivity of 18F-galacto-RGD for lesion identification, the number of lesions in each scan, which were identifiable as either areas of elevated tracer uptake or as photopenic defects in an organ, was noted. The findings of the clinical staging procedures served as the standard of reference (including contrast-enhanced CT and 18F-FDG PET/CT in all cases), as biopsies and histopathology were not available for most of the analyzed metastases. Again, a maximum number of 5 lesions per patient was considered for further analysis to avoid a bias by patients with an exceptionally high number of lesions (n = 4). The reports from the Department of Radiology on the CT scans and from the Department of Nuclear Medicine on the 18F-FDG PET/CT scans were used as reference. Moreover, for comparison with the results of the 18F-galacto-RGD PET scans, data were analyzed retrospectively by a board-certified radiologist who had 4 y of experience using PET/CT.
Statistical Analysis
All quantitative data are expressed as mean ± 1 SD. The correlation between quantitative parameters was evaluated by linear regression analysis and by calculation of the Pearson correlation coefficient R. Statistical significance was tested by using ANOVA.
Comparison of quantitative parameters was performed using the Wilcoxon test.
All statistical tests were performed at the 5% level of statistical significance, using the StatView program (SAS Institute Inc.) or MedCalc (MedCalc version 6.15.000).
RESULTS
18F-Galacto-RGD PET Data
The mean 18F-galacto-RGD uptake in all lesions (n = 59) was 2.7 ± 1.5. For primaries (n = 14) it was 2.9 ± 0.9, for osseous metastases (n = 11) it was 3.4 ± 1.7, for liver metastases (n = 10) it was 2.7 ± 1.5, and for other metastases (n = 24) it was 1.9 ± 1.8 (Fig. 1A). There was no statistically significant difference in SUVs between primaries and all metastases (P = 0.392). Osseous metastases showed the highest uptake in the group of metastatic lesions, but the difference in uptake was not statistically significant compared with that of other metastases (P = 0.116).

Box plot diagram of distribution of SUVs for all lesions and for primary and metastatic lesions separately for 18F-galacto-RGD (A) and 18F-FDG (B). Note significantly higher tracer uptake for 18F-FDG compared with that for 18F-galacto-RGD (P < 0.0001).
18F-FDG PET Data
The mean 18F-FDG uptake in all lesions (n = 59) was 7.6 ± 4.9. For primaries (n = 14) it was 8.4 ± 3.5, for osseous metastases (n = 11) it was 6.8 ± 3.4, for liver metastases (n = 10) it was 9.4 ± 5.9, and for other metastases (n = 24) it was 8.1 ± 5.8 (Fig. 1B). There was no statistically significant difference in SUVs between primaries and all metastases (P = 0.521). Liver metastases showed the highest uptake in the group of metastatic lesions, but the difference in uptake was not statistically significant compared with that of other metastases (P = 0.199).
Comparison of 18F-Galacto-RGD PET and 18F-FDG PET Data
The mean SUV for all lesions (n = 59) was significantly higher for 18F-FDG PET than that for 18F-galacto-RGD PET (P < 0.001). Only 1 patient showed higher SUVs in the tumor lesions with 18F-galacto-RGD PET compared with those of 18F-FDG PET (patient 10, bronchus carcinoid). 18F-Galacto-RGD PET missed 14 lesions (27%) compared with clinical staging, including contrast-enhanced CT and 18F-FDG PET/CT (sensitivity: 76%). Seven of the missed lesions were located in the liver, 7 were located in other sites (bone, n = 2; lung, n = 2; lymph node, n = 1; soft tissue, n = 1; adrenal gland, n = 1).
No significant correlation was found between the SUVs of 18F-galacto-RGD and 18F-FDG PET for all lesions (r = 0.157, P = 0.235; Fig. 2A). With regard to the separate tumor locations, there was also no significant correlation for primary lesions (r = −0.068, P = 0.817), osseous metastases (r = 0.066, P = 0.846), liver metastases (r = −0.182, P = 0.615), or other metastases (r = 0.397, P = 0.055). When only the subgroup of 18F-FDG–avid tumors was analyzed (NSCLC, breast cancer, squamous cell carcinoma of head and neck [SCCHN], rectal cancer; n = 49), there was a weak correlation between the uptake of the 2 tracers (r = 0.337, P = 0.018). For the subgroup of lesions in patients with NSCLC (n = 39), there was again only a weak correlation (r = 0.357; P = 0.028; Fig. 2B).
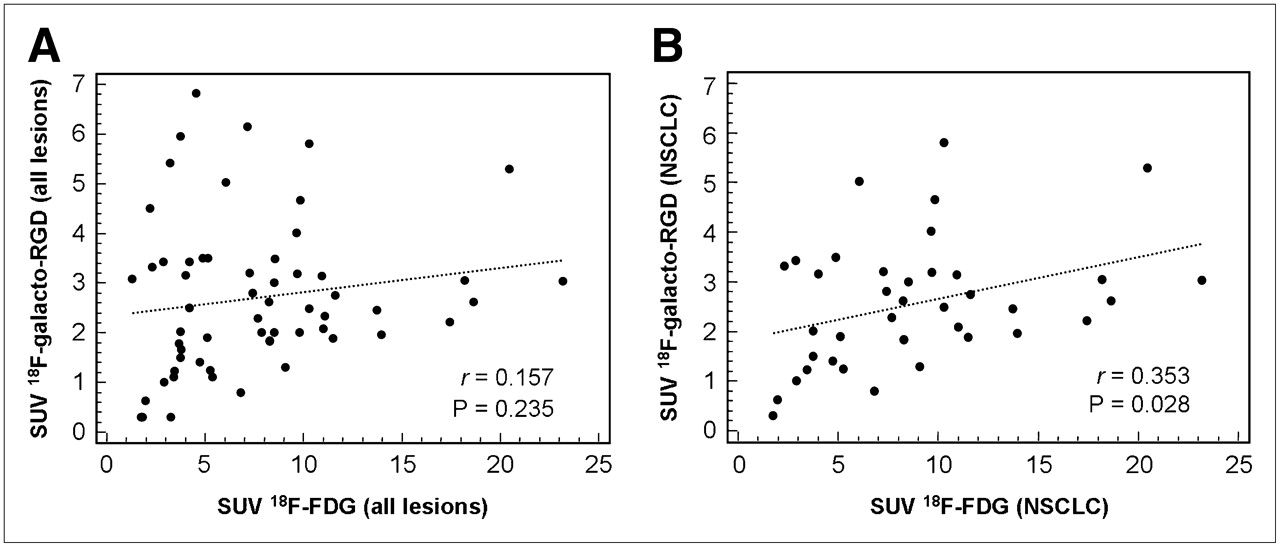
Comparison of SUVs from 18F-FDG PET and 18F-galacto-RGD PET for all lesions (A) and for lesions in patients with NSCLC separately (B). No statistically significant correlation is found between uptake of the 2 tracers for all lesions. In the subgroup of lesions in NSCLC, there is a weak correlation between uptake of the 2 tracers—however, with a low correlation coefficient.
DISCUSSION
In this study we compared the 18F-galacto-RGD uptake and 18F-FDG uptake on PET in primary and metastatic tumor lesions in cancer patients. In general, no substantial correlation between 18F-galacto-RGD and 18F-FDG uptake could be demonstrated, suggesting that αvβ3 expression and glucose metabolism are not closely linked in malignant lesions. The sensitivity for lesion detection was significantly higher for 18F-FDG PET compared with that for 18F-galacto-RGD PET. Thus, 18F-FDG PET remains superior for primary staging of cancer patients, whereas 18F-galacto-RGD PET might provide additional information for planning and response evaluation of antiangiogenic therapies.
With regard to all lesions, comparison of the tracer uptake of 18F-FDG and 18F-galacto-RGD showed no correlation between the 2 parameters. This applied to primary lesions as well as to metastatic lesions, independent of the metastatic site. For the subgroup of 18F-FDG–avid lesions and lesions in patients with NSCLC, there was a slight trend toward a higher 18F-galacto-RGD uptake in more 18F-FDG–avid lesions. Notably, lesions with very high 18F-FDG uptake (SUV > 15) all demonstrated at least moderate 18F-galacto-RGD uptake (SUV > 2). However, the correlation coefficient was very low (Fig. 3). As the integrin αvβ3 is believed to be a marker of activated endothelial cells, 18F-galacto-RGD is a potential surrogate parameter of angiogenesis in tumors with predominantly endothelial αvβ3 expression. Our results suggest that αvβ3 expression and glucose metabolism are not closely correlated in tumor lesions and, consequently, 18F-FDG cannot provide information similar to that of 18F-galacto-RGD. Although these results are not unexpected, reports in the literature describe a correlation between angiogenesis and 18F-FDG uptake in benign and malignant lesions. In human lung adenocarcinomas, which also represented the main patient population in our study, the microvessel density (MVD) of vessels positive for CD105, a proliferation-related endothelial cell marker, correlated positively with 18F-FDG uptake (16). Moreover, in human breast cancer, a weak but significant correlation between MVD using CD31 staining and 18F-FDG uptake was demonstrated (17). In giant cell tumors, a gene chip analysis showed a close association between 18F-FDG uptake and kinetic 18F-FDG data with the expression of genes related to angiogenesis, such as VEGF A (9). As the integrin αvβ3 is a key player in angiogenesis as well, a correlation between αvβ3 expression and 18F-FDG uptake would have been conceivable according to these results. However, other studies showed no significant correlation between angiogenesis and 18F-FDG uptake, which is more closely in line with our results. In patients with NSCLC, no correlation was found between 18F-FDG uptake and MVD, determined by staining with von Willebrand factor (18). In breast cancer patients, one study even showed a slightly negative correlation between 18F-FDG uptake and the density of tumor capillaries (19). However, it must be stressed that our results cannot ultimately elucidate the relationship between 18F-FDG uptake and angiogenesis because the exact role of αvβ3 expression in the context of angiogenesis is still a matter of debate. Experiments on knock-out mice lacking the integrin αvβ3 led to a reevaluation of the role of αvβ3 with regard to angiogenesis, because the knock-out mice showed normal developmental angiogenesis and even excessive tumor angiogenesis (20). αvβ3 is now assumed to have a positive and a negative regulatory role in angiogenesis depending on the respective biologic context. Moreover, our small number of patients—especially with non–18F-FDG-avid tumors—is a limitation of our study. Therefore, it cannot be excluded that, for certain subgroups of tumors, a closer correlation of 18F-FDG and 18F-galacto-RGD uptake exists.
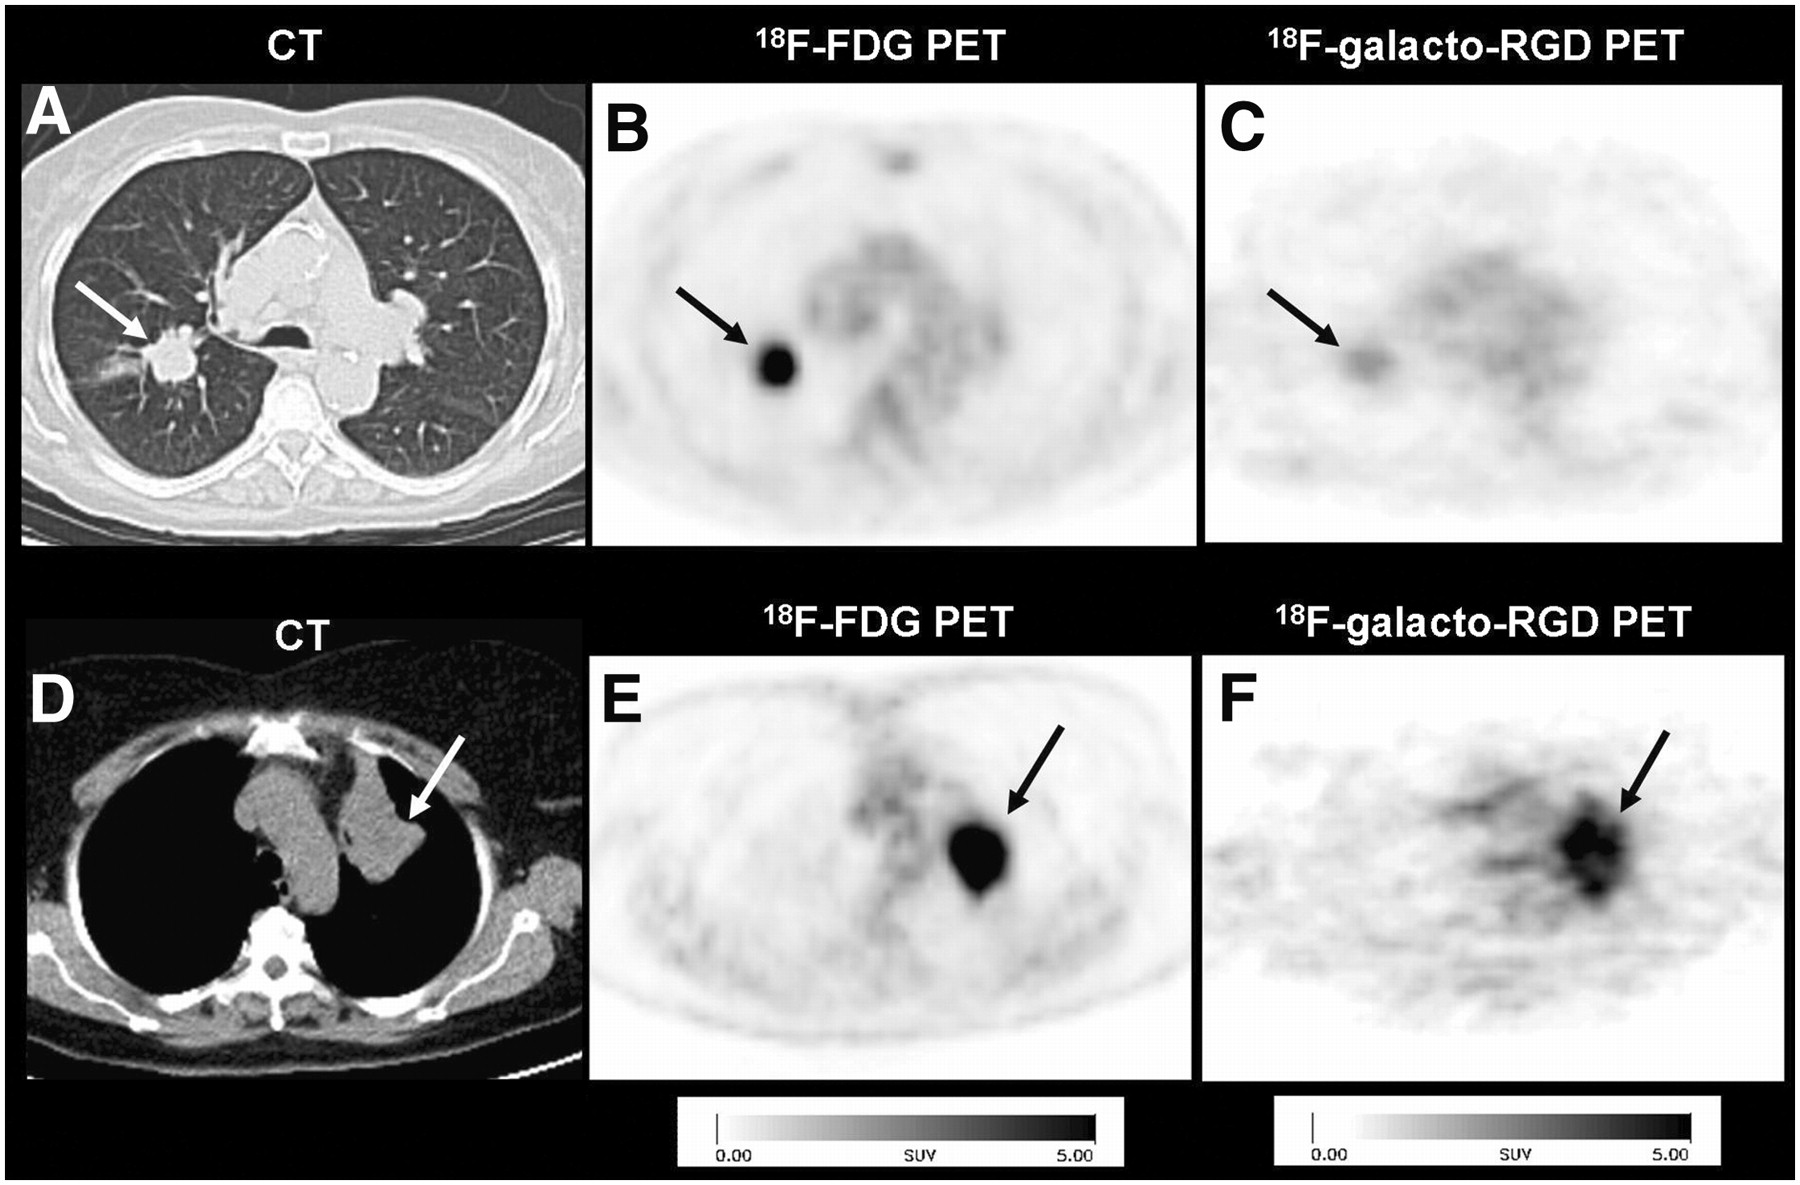
Comparison of patients with NSCLC of right lung (A–C) and left lung (D–F; arrows). Note intense uptake in both lesions in 18F-FDG PET (B and E), whereas lesions demonstrate completely different uptake patterns in corresponding 18F-galacto-RGD PET: There is only weak uptake in first patient (C), whereas there is intense uptake in second patient (F).
The tracer uptake of 18F-FDG in tumor lesions was significantly higher than that of 18F-galacto-RGD. This is in accordance with the suggested pharmacodynamics of both tracers, because 18F-FDG accumulates in the tumor cells whereas 18F-galacto-RGD binds predominantly to endothelial cells. As the number of endothelial cells—even in highly vascularized tumors—is substantially smaller than the number of tumor cells, the difference in tracer uptake corroborates the suggested binding mechanisms for both substances (21).
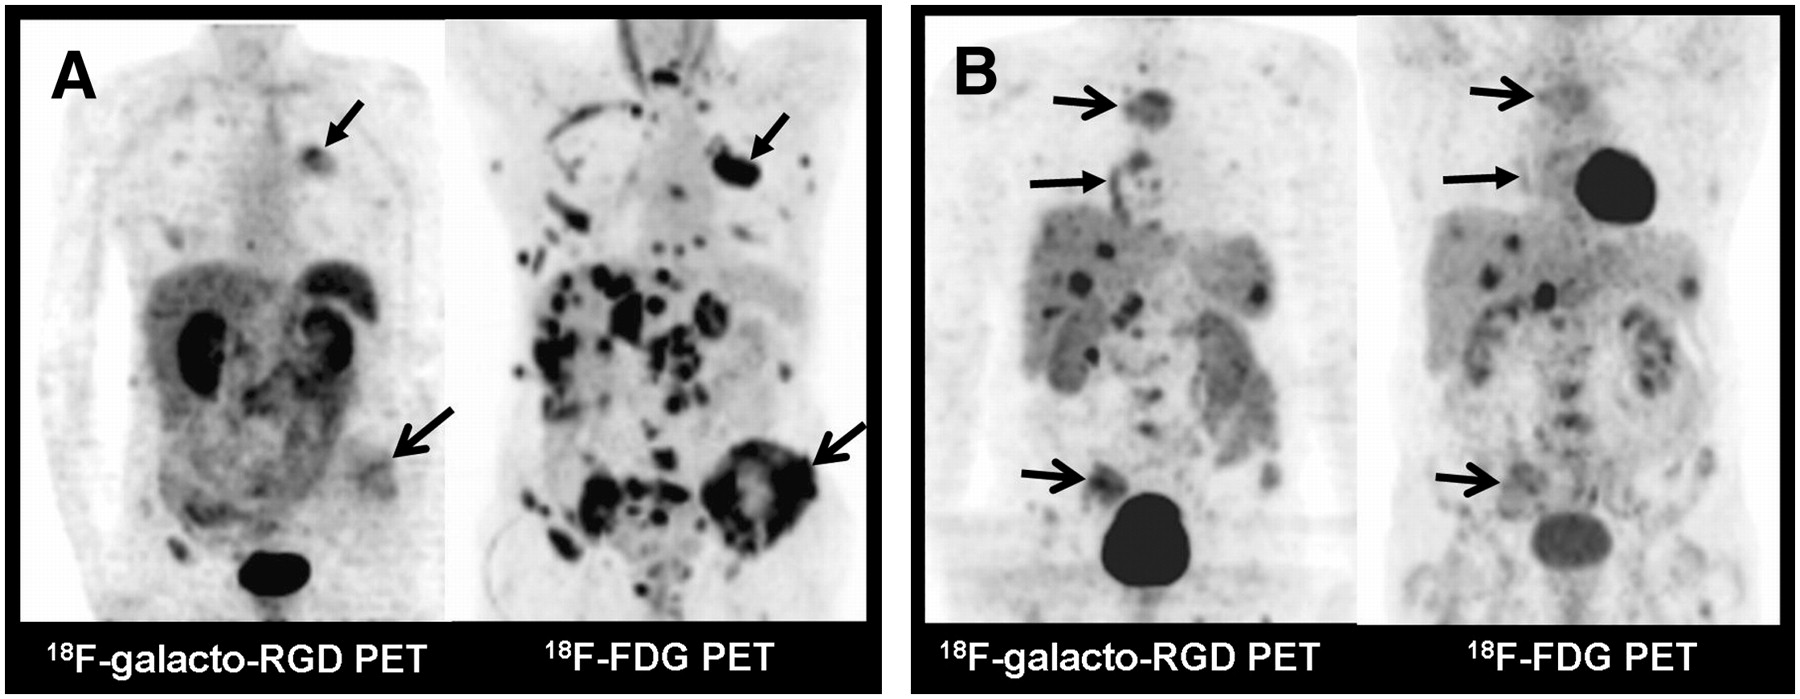
Conventional staging, including contrast-enhanced CT and 18F-FDG PET, identified substantially more lesions than 18F-galacto-RGD PET (Fig. 4A). This illustrates that with regard to tumors in which 18F-FDG PET has already demonstrated good results for staging, 18F-galacto-RGD PET is unlikely to produce better results, including NSCLC, breast cancer, and SCCHN (22–24). This is not surprising, as the primary intention for the development of this tracer was not to replace 18F-FDG or to improve tumor staging but, rather, to create a tool for molecular imaging of processes related to αvβ3 expression, such as angiogenesis. However, in 1 patient with a bronchus carcinoid, tracer uptake on 18F-galacto-RGD PET was substantially higher than that on 18F-FDG PET in the primary tumor as well as in the metastases (Fig. 4B). Therefore, in tumors with low or intermediate 18F-FDG uptake, such as prostate cancer or carcinoid tumors, imaging of αvβ3 expression might produce better results for lesion identification and tumor staging than those of 18F-FDG PET (25,26). This, however, is only a hypothesis and must be proven in future prospective studies. Moreover, variations in tracer design are undertaken to further improve the performance of αvβ3 imaging. This includes, for example, multimeric RGD peptides with >1 RGD binding site per molecule, which have already demonstrated improved tumor uptake and tumor-to-background contrast in vitro and in vivo compared with monomeric RGD peptides (27–30). One small-animal PET study in tumor-bearing mice—which compared 18F-FDG and imaging of αvβ3 expression with a 64Cu-labeled PEGylated dimeric RGD peptide in a model of lung cancer (NCI-H1975 lung adenocarcinoma)—even showed higher tumor-to-background ratios for the RGD peptide compared with those of 18F-FDG (31). Thus, it is conceivable that, in the future, PET of αvβ3 expression might prove to be superior to 18F-FDG even in tumors with good 18F-FDG uptake. Again, this hypothesis remains to be proven in future comparative studies.

Comparison of different uptake patterns in 18F-FDG PET and 18F-galacto-RGD PET. (A) Patient with NSCLC of left upper lobe (arrow, closed tip) and multiple metastases to bone (arrow, open tip), liver, lymph nodes, and adrenal glands. Note intense uptake in all lesions in maximum-intensity-projection (MIP) of 18F-FDG PET, whereas uptake in lesions in MIP of 18F-galacto-RGD PET is substantially lower. This typical uptake pattern is seen in most patients. (B) Patient with neuroendocrine tumor of bronchus in right lower lobe (arrow, closed tip) and multiple metastases to bone (arrows, open tip), liver, spleen, and lymph nodes. This patient shows more intense uptake in lesions on 18F-galacto-RGD PET compared with that on 18F-FDG PET.
Lesion identification in 18F-galacto-RGD PET was particularly difficult in the liver. Seven of 10 liver lesions were undetectable, either as positive or photopenic lesions. Liver lesions were identifiable as a positive lesion in only 1 patient (patient 10, bronchus carcinoid); in 2 patients lesions could be identified indirectly as photopenic defects. Therefore, we conclude that the unsatisfactory detection rate is caused primarily by the relatively high background activity in the liver. This has already been presumed in previous studies on the biodistribution and dosimetry of 18F-galacto-RGD in cancer patients, in whom a comparatively high tracer retention in the liver could be demonstrated (32,33). Thus, assessment of αvβ3 expression with 18F-galacto-RGD PET in liver lesions with only a moderate or low tracer uptake is problematic. As discussed earlier, this problem might be overcome with a new tracer—for example, with multimeric compounds showing improved target-to-background ratios. On the other hand, osseous metastases showed the highest tracer uptake compared with lesions in other sites, although this trend did not reach statistical significance. One reason for this tendency to a higher 18F-galacto-RGD uptake in osseous metastases could be attributed to αvβ3 expression on tumor cells in addition to endothelial cells, as αvβ3 expression is a well-known factor for metastatic spread, especially to the bone (34,35). Moreover, αvβ3 expression on osteoclasts is a well-known phenomenon in processes involving bone resorption, such as osseous metastases, which could also contribute to the 18F-galacto-RGD PET signal (36). However, we can only speculate on the reasons for this finding, because we did not perform immunohistochemical studies in our patient population, which is a general limitation of this study. Such studies were not undertaken for ethical reasons. The primary histopathologic diagnosis had already been established by biopsy as an inclusion criterion, and immunohistochemical studies of αvβ3 expression would have necessitated additional biopsies to collect fresh frozen tissue samples, which seemed inappropriate to us in a population of patients with metastatic tumors. Moreover, immunohistochemistry can show only parts of the tumor, which might bias the interpretation in case of heterogeneity of αvβ3 expression. Furthermore, samples for immunohistochemistry might not necessarily have been taken from a representative area. Molecular imaging, on the other hand, has the potential to show specific biologic properties of tissues as a whole and also in several tumor sites in the body in one session (37).
Another limitation is that we did not perform dynamic studies; only static PET scans were acquired so we could undertake a semiquantitative assessment of tracer uptake by calculating SUVs. However, dynamic scanning limits the field of view to one bed position and would have greatly reduced the number of lesions available for analysis compared with static PET scans. Moreover, it had already been demonstrated for 18F-FDG that dynamic PET data and static PET data correlate reasonably well (38). For 18F-galacto-RGD PET, a significant correlation of αvβ3 expression and SUVs has also been successfully demonstrated (8). However, for truly quantitative studies, dynamic scans and kinetic modeling still would need to be performed (39).
Finally, scans were acquired on different scanners. However, a highly significant correlation of SUVs from the Sensation Biograph 16 scanner and a stand-alone PET scanner has recently been demonstrated (40).
CONCLUSION
Tracer uptake of 18F-galacto-RGD and 18F-FDG does not correlate closely in malignant lesions, suggesting that each tracer provides complementary information in cancer patients. Whereas 18F-FDG PET is superior for tumor staging because of a higher sensitivity in most tumor entities, 18F-galacto-RGD PET warrants further evaluation for planning and response evaluation of targeted molecular therapies with antiangiogenic or αvβ3-targeted drugs.
Acknowledgments
We thank the Cyclotron and PET team—especially Michael Herz, Gitti Dzewas, Coletta Kruschke, and Nicola Henke—for excellent technical assistance and the Münchner Medizinische Wochenschrift and the Sander Foundation for financial support.
Footnotes
-
COPYRIGHT © 2008 by the Society of Nuclear Medicine, Inc.
References
- Received for publication August 1, 2007.
- Accepted for publication October 12, 2007.


Jump to section
Related Articles
Cited By...
- The Relationship of Metabolic Activity and {alpha}v{beta}3 Receptor Expression in Aggressive Breast Cancer Subtypes Tumors: A Preliminary Report
- Targeted Radionuclide Therapy in Patient-Derived Xenografts Using 177Lu-EB-RGD
- First-in-Human Assessment of cRGD-ZW800-1, a Zwitterionic, Integrin-Targeted, Near-Infrared Fluorescent Peptide in Colon Carcinoma
- 18F-Alfatide II PET/CT for Identification of Breast Cancer: A Preliminary Clinical Study
- In Vivo Characterization of 4 68Ga-Labeled Multimeric RGD Peptides to Image {alpha}v{beta}3 Integrin Expression in 2 Human Tumor Xenograft Mouse Models
- Hybrid PET/MR Imaging in Neurology: Present Applications and Prospects for the Future
- RGD PET: From Lesion Detection to Therapy Response Monitoring
- PET/CT Imaging of Integrin {alpha}v{beta}3 Expression in Human Carotid Atherosclerosis
- Integrin {alpha}v{beta}3 Imaging of Radioactive Iodine-Refractory Thyroid Cancer Using 99mTc-3PRGD2
- Drug-Based Optical Agents: Infiltrating Clinics at Lower Risk
- Radiopeptide Imaging and Therapy in Europe
- PET Imaging of Tumor Neovascularization in a Transgenic Mouse Model with a Novel 64Cu-DOTA-Knottin Peptide
- Phenotyping of Tumor Biology in Patients by Multimodality Multiparametric Imaging: Relationship of Microcirculation, {alpha}v{beta}3 Expression, and Glucose Metabolism
- Radiopharmaceuticals in Preclinical and Clinical Development for Monitoring of Therapy with PET
- Derivation of a Compartmental Model for Quantifying 64Cu-DOTA-RGD Kinetics in Tumor-Bearing Mice
- Advances in Anatomic, Functional, and Molecular Imaging of Angiogenesis
- Correlative Imaging of Hypoxia and Angiogenesis in Oncology