


Abstract
Both dynamic contrast-enhanced (DCE) MRI and PET provide quantitative information on tumor biology in living organisms. However, imaging biomarkers often neglect tissue heterogeneity by focusing on distributional summary statistics. We analyzed the spatial relationship of αvβ3 expression, glucose metabolism, and perfusion by PET and DCE MRI, focusing on tumor heterogeneity. Methods: Thirteen patients with primary or metastasized cancer (non–small cell lung cancer, n = 9; others, n = 4) were examined with DCE MRI and with PET using 18F-galacto-RGD and 18F-FDG. Twenty-three different regions of interest were defined by cluster analysis based on the heterogeneity of tracer uptake. In these regions, the initial area under the gadopentetate dimeglumine concentration–time curve (IAUGC), as well as the regional blood volume (rBV) and regional blood flow (rBF), were estimated from DCE MRI and correlated with standardized uptake values from PET. Results: Regions with simultaneously high uptake of 18F-galacto-RGD and 18F-FDG showed higher functional MRI data (IAUGC, 0.35 ± 0.04 mM·s; rBF, 70.2 ± 12.7 mL/min/100 g; rBV, 23.3 ± 2.7 mL/100 g) than did areas with low uptake of both tracers (IAUGC, 0.15 ± 0.04 mM·s [P < 0.01]; rBF, 28.3 ± 10.8 mL/min/100 g; rBV, 9.9 ± 1.9 mL/100 g [P < 0.01]). There was a weak to moderate correlation between the functional MRI parameters and 18F-galacto-RGD (r = 0.30–0.62) and also 18F-FDG (r = 0.44–0.52); these correlations were significant (P < 0.05), except for 18F-galacto-RGD versus rBF (P = 0.17). Conclusion: These data show that multiparametric assessment of tumor heterogeneity is feasible by combining PET and MRI. Perfusion is highest in tumor areas with simultaneously high αvβ3 expression and high glucose metabolism and restricted in areas with both low αvβ3 expression and low glucose metabolism. The current limitations resulting from imaging with separate scanners might be overcome by future hybrid PET/MRI scanners.
Dynamic contrast-enhanced (DCE) MRI and PET provide functional and molecular information on tumor biology in vivo and might be useful for response evaluation of targeted therapies and for assessment of prognosis (1,2). Although in vitro analysis by histopathology and immunohistochemistry has to be considered the gold standard for assessment of tumor biology, molecular imaging by PET/MRI provides several advantages in quantifying biomarkers. It can, for example, provide additional information from tumor areas not easily accessible for tissue sampling. Moreover, it can provide biologic information about tissue heterogeneity in living organisms. Although most imaging studies and current quantitative analysis methods discard this spatial heterogeneity information, tissue heterogeneity is increasingly being recognized as an important factor in tumor biology that may have significant diagnostic and predictive utility (3). In the present feasibility study, multimodality multiparametric imaging with 18F-FDG PET, 18F-galacto-RGD PET, and DCE MRI was used to investigate noninvasively the spatial relationship of glucose metabolism, αvβ3 expression, and microcirculation in human tumors.
We decided to use DCE MRI for quantification of microcirculatory tissue parameters because this technique has been established as a promising imaging method for the evaluation of tumor angiogenesis in vivo (4). Antiangiogenic effects of numerous pharmaceutical agents were assessed by DCE MRI in clinical trials (5,6). Furthermore, recent results indicate that functional parameters determined from DCE MRI are predictive of tumor response to antiangiogenic therapy (4,7).
Recently, new strategies directly targeting components of the angiogenic cascade have been developed for PET imaging of angiogenic activity. The PET tracer 18F-galacto-RGD allows for imaging of αvβ3 expression and is thus promising for the assessment of angiogenic activity (8,9). As shown, integrin αvβ3 is a key player in angiogenesis and tumor metastasis and is expressed on activated endothelial cells and on some tumor cells (10). In addition, new drugs targeting the αvβ3 integrin are currently being evaluated for antiangiogenic treatment and have shown promising results in patients with refractory glioblastoma (11). Therefore, we decided to use 18F-galacto-RGD as a PET biomarker. Finally, we decided to use 18F-FDG as another PET biomarker because it is widely available for assessment of tumor glucose metabolism and is being used routinely for staging and response evaluation in cancer patients (2,12).
In this study, we evaluated the spatial relationships among these different imaging parameters of perfusion, αvβ3 expression, and glucose metabolism in human tumors to gather more insight about tumor heterogeneity and tumor biology.
MATERIALS AND METHODS
Patients
The study was approved by the ethics committee of our university. Application of the experimental radiotracer 18F-galacto-RGD was approved by the national radiation protection authority (Federal Office for Radiation Protection). Informed written consent was obtained from all patients. Thirteen chemotherapy-naive patients were included in the study (4 women and 9 men; mean age ± SD, 67 ± 2 y; range, 52–80 y). The initial inclusion criterion was suspected non–small cell lung cancer (NSCLC) as determined by clinical staging including contrast-enhanced CT and 18F-FDG PET/CT in all cases. Biopsy-confirmed NSCLC was present in 9 patients, whereas 2 patients had neuroendocrine carcinomas (bronchus carcinoid). In 2 patients, lung lesions turned out to be metastases (one from renal cell carcinoma and one from rectal adenocarcinoma). Further inclusion criteria were age over 18 y and the ability to give written and informed consent. Exclusion criteria were pregnancy, lactation period, and impaired renal function (serum creatinine level > 1.2 mg/dL). Further details of the patient population are summarized in Table 1.
Distribution of Primary Tumor Histology and Imaged Tumor Sites
DCE MRI
All MRI measurements were performed on a clinical 1.5-T scanner (Magnetom Avanto; Siemens) using phased-array body and spine coils. Images were acquired in transaxial orientation, and the patients were asked to reduce their breathing amplitude as much as possible during the measurement.
After localization of the lesions on standard T2-weighted images, native T1-weighted images were acquired using inversion recovery true fast imaging with steady-state precession as described previously (13). After application of a software-generated trigger pulse every 3.5 s, the recovery of longitudinal magnetization after a nonselective 180° inversion pulse was detected with a temporal resolution of 90.2 ms. A small flip angle (α = 10°) was chosen to reduce T2 effects. Four slices were acquired with a voxel size of 2.2 × 1.8 × 5 mm (field of view, 287 × 350 mm) and a gap of 1 mm. From the acquired datasets, the T1 relaxation times before contrast enhancement were numerically estimated.
From the same slices, the time course of uptake of the paramagnetic contrast medium gadopentetate dimeglumine (Magnevist; Schering) was measured with a standard T1-weighted 2-dimensional fast low-angle shot sequence (α = 90°; repetition time/echo time, 52/4.76). After the start of the measurement, 0.1 mmol of gadopentetate dimeglumine per kilogram of body weight was administered intravenously at a rate of 3 mL/s and subsequently flushed with a 20-mL saline bolus at the same rate. Image data were acquired over at least 90 s with a temporal resolution of 3 s. If the 4 sections did not fully cover the tumor in the coronal direction, sections were positioned in such a way that the tumor region showing the largest axial extension was covered.
Radiopharmaceuticals
Synthesis of the precursor and subsequent 18F labeling of galacto-RGD and of FDG were performed as described previously (14,15).
18F-Galacto-RGD PET
Imaging was performed with an ECAT EXACT HR+ PET scanner (CTI/Siemens). After injection of 18F-galacto-RGD (183 ± 17 MBq), a transmission scan was acquired for 5 min per bed position (5 bed positions) using 3 rotating 68Ge rod sources (each with an activity of approximately 90 MBq). Subsequently, a static emission scan of each patient was acquired in the 2-dimensional mode in the caudocranial direction, beginning on average 58 ± 6 min after intravenous injection of 18F-galacto-RGD, covering a field of view from the pelvis to the thorax (5–7 bed positions, 8 min per bed position). Emission data were corrected for randoms, dead time, and attenuation and reconstructed using the ordered-subsets expectation maximization algorithm with 8 iterations and 4 subsets. For noise reduction, a gaussian filter of 5 mm in full width at half maximum was applied.
18F-FDG PET
Uptake of the glucose analog 18F-FDG was determined with a Biograph Sensation 16 PET/CT scanner, which incorporates an ACCEL PET system (CTI/Siemens) and a 16-slice multidetector CT system (Siemens).
The radiotracer (460.2 ± 23.4 MBq) was injected into the patients after they had fasted 6 h. None of the patients were diabetic or had a fasting blood glucose level above 120 mg/dL. Data acquisition began 63.4 ± 4.2 min after 18F-FDG administration. An emission scan was performed in the 3-dimensional mode in the craniocaudal direction covering a field of view ranging from the head to the pelvis (3-dimensional mode; 7–8 bed positions, 2 min per bed position). Subsequently, an unenhanced low-dose CT scan (120 kV, 26 mAs, 16 × 0.75 mm collimation) was performed in shallow expiration. For attenuation correction, the CT data were converted from Hounsfield units to linear attenuation coefficients for 511 keV using a single CT energy scaling method based on a bilinear transformation. Emission data were corrected for randoms, dead time, scatter, and attenuation, and the same reconstruction algorithm was applied as for the conventional PET data.
Concerning the PET data, because we did not perform dynamic studies but only static PET scans, we could do only a semiquantitative assessment of tracer uptake by calculating standardized uptake values (SUVs). It is generally conceived that for truly quantitative studies, dynamic scans and kinetic modeling would have to be performed (16). However, it has already been demonstrated for 18F-FDG that dynamic PET data and static PET data correlate reasonably well (17). For 18F-galacto-RGD PET, kinetic modeling data from previous studies were compatible with slowly reversible specific receptor binding with a plateau of tracer uptake 40–60 min after injection, which is the time point chosen for static imaging in the current study. Moreover, a significant correlation of αvβ3 expression and SUVs has also been successfully demonstrated (10). In summary, these data suggest that for both tracers, using SUVs is a reasonable approach for data analysis.
The fact that PET scans were obtained on different scanners might influence the comparability of SUV measurements. However, a highly significant correlation of SUVs from the Sensation Biograph scanner and our stand-alone PET scanner has already been demonstrated (18). These data suggest that SUVs from both scanners are in comparable ranges.
Image Analysis
The corrected emissions scans were calibrated to SUVs (measured activity concentration [Bq/mL] × body weight [g]/injected activity [Bq]) (19).
Data were analyzed using custom software developed at our institution. To efficiently handle arbitrary tomographic multimodal datasets (Supplemental Fig. 1), the used software handles all its data in their actual 3-dimensional coordinate space (metric units), thus keeping the true dimensions intact. Image fusion of the 18F-FDG PET and 18F-galacto-RGD PET datasets was performed first. The PET–PET fusion is done manually and internally adapted with a mathematic linear interpolation. Three or more reference anatomic landmarks were manually matched and fused, such as skin contour, or contour of liver and spleen, which are organs identifiable both on 18F-FDG PET and on 18F-galacto-RGD PET. The dynamic T1-weighted MRI series and the native T1-weighted images were displayed simultaneously in separate windows. The MRI data are shown in their original resolution. When the region of interest (ROI) is copied from the PET image to the MR image, the shape and size are maintained because of the use of real coordinates for the control points of the spline; thus, only the position of the ROI has to be adjusted by the user. The difference in resolution is accounted for by resampling (upscaling in this case) the contained cloud of points to the destination resolution. Resampling does, of course, imply a certain inexactness in the data analysis but ensures the best possible calculation of MRI-based statistical values.
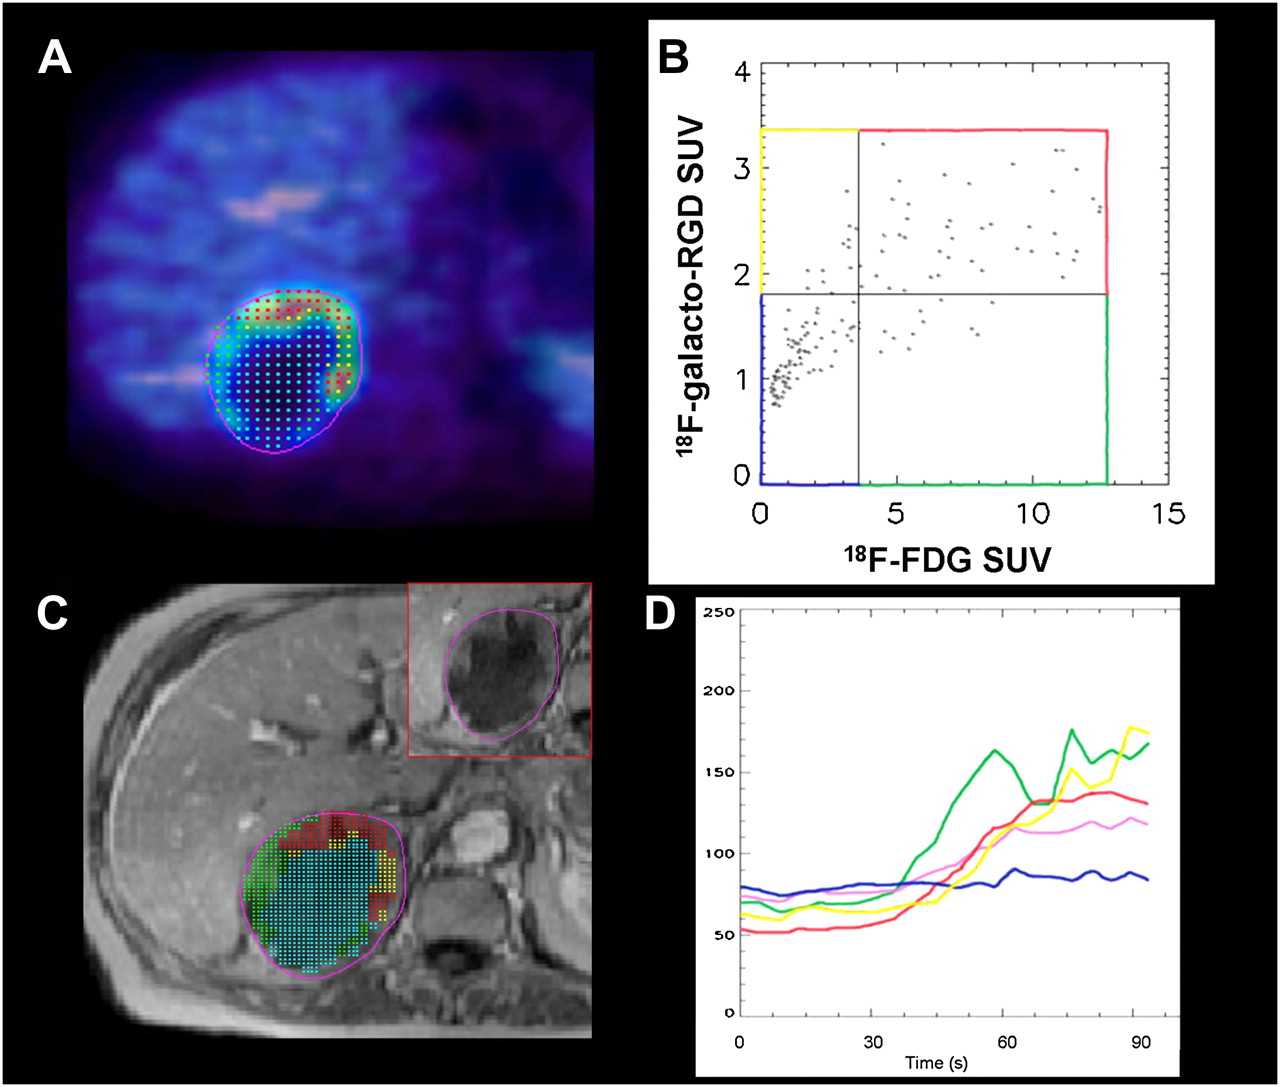
Image analysis using our custom software tool, showing large metastasis from NSCLC of right adrenal gland. (A) Different image sets are opened simultaneously in separate windows. After manual image fusion of 18F-FDG (multicolor scale) and 18F-galacto-RGD PET (blue–white scale), ROI covering total tumor area is defined in fused PET dataset (A: magenta line). (B) Scatterplot shows distribution of SUVs within this ROI on pixel-by-pixel basis. Different tumor areas are defined by preset thresholds for 18F-FDG and 18F-galacto-RGD uptake on x- and y-axes, respectively (blue: RGD−/FDG−, green: RGD+/FDG−, yellow: RGD−/FDG+, and red: RGD+/FDG+). (C) Different areas are then copied to MR image set (blue: RGD−/FDG−, green: RGD+/FDG−, yellow: RGD−/FDG+, and red: RGD+/FDG+; inset shows tumor without overlay of different color-coded areas). (D) Intensity–time curves of DCE MRI data are subsequently derived for these different tumor areas. Central blue area with low tracer uptake (FDG−/RGD−) shows only slight contrast enhancement (blue line), whereas areas with higher tracer uptake (yellow, green, and red lines) show more rapid and intense enhancement. Magenta line represents results for whole-tumor ROI.
Based on the fused PET images and the extent of the tumor in the simultaneously displayed MR images for anatomic correlation, an ROI was drawn on the fused PET images covering the entire tumor area in the slice with the maximum tumor diameter. The software then provides a distribution of SUVs for each tracer on a pixelwise basis in the tumor ROI. The pixelwise correlation of SUVs from the 18F-FDG PET and 18F-galacto-RGD PET images can be displayed in a diagram (Fig. 1). Using a threshold technique, areas with low or high tracer uptake for 18F-FDG and 18F-galacto-RGD were defined. For prospective definition of the thresholds for low and high uptake, we used data from previous studies that compared 18F-galacto-RGD and 18F-FDG in malignant lesions (20). We decided to use the lower 25th percentile of the previously reported data on tracer distribution of 18F-galacto-RGD and 18F-FDG as a threshold for the definition of low tracer uptake. This decision resulted in a threshold at an SUV of 1.8 for 18F-galacto-RGD and an SUV of 3.6 for 18F-FDG. Concerning 18F-galacto-RGD, previous data with immunohistochemical correlation suggest that areas with SUVs lower than the applied threshold of 1.8 usually show correspondingly low αvβ3 expression, justifying use of the 25th percentile as a threshold, and this limit was then also used for 18F-FDG (10). This definition of the threshold, however, is somewhat arbitrary and can be altered by the user according to the focus and the aim of the analysis.
By this approach, the total tumor area was divided into up to 4 tumor regions with different biologic activity: areas with both high 18F-galacto-RGD uptake and high 18F-FDG uptake (RGD+/FDG+), areas with either high 18F-galacto-RGD uptake and low 18F-FDG uptake (RGD+/FDG−) or vice versa (RGD−/FDG+), and finally areas with both low 18F-galacto-RGD uptake and low 18F-FDG uptake (RGD−/FDG−). Areas that were less than 5 PET pixels were excluded from further analysis because of the inherent inaccuracies and limitations of retrospective image fusion and to avoid excessively noisy data.
Mean SUVs and signal intensities were computed for the regions and saved for further pharmacokinetic modeling and comparative analysis. Concerning the problem of different pixel and voxel sizes in PET and MRI, the underlying fused image is drawn in an anti-aliasing mode (cubic convolution interpolation); thus, 1 dot always represents exactly 1 pixel or voxel in the image and is drawn in the center of the pixel. When the dots (cloud of points) are copied from the PET image to the MR image, the number of dots is adapted to the higher resolution of the MR image by a linear interpolation.
Pharmacokinetic Modeling
Native T1 values were estimated from the data of the inversion recovery true fast imaging with steady-state precession using a nonlinear least-squares fit algorithm (Levenberg–Marquard). Using these data, the tumor concentration of the administered contrast medium was subsequently determined from the T1-weighted signal intensities assuming fast exchange conditions (relaxivity [r1] = 4.5 mM−1s−1). The time-dependent plasma contrast medium concentration curve, measured in a major tumor-feeding artery, was determined similarly. Apart from that, a literature value (T1 = 1,200 ms) was assumed for the native T1 of blood. After identifying the beginning of the gadopentetate dimeglumine uptake in the tissue region considered, we computed the initial part of the area under the concentration–time curve (initial AUC) by numeric integration over 60 s (mM·s).
Kinetic modeling was performed using an open 1-compartment model. According to this model, the contrast medium transport through the capillary plasma compartment (with mean contrast medium concentration CP and volume VP) can be described by
The input function CA(t) was calculated from mean blood concentrations CB(t), determined from the dynamically acquired MRI datasets by CA(t) = CB(t)/(1−hmv) with hmv ≅ 0.45 the hematocrit in major vessels. The total tissue concentration CT, which is derived from the MRI enhancement data, is given by
Pharmacokinetic analysis was performed with the extended least-squares program MKMODEL (version 5.0; Biosoft) by implementing the model described by Equations 1 and 2. By this approach, the 3 independent tissue parameters F/VP, fP, and τ were estimated from the concentration–time courses CT(t) and CA(t). Finally, the regional blood volume (rBV) per unit tissue mass (in mL/100 g) and the regional blood flow (rBF) per unit tissue mass (in mL/min/100 g) were computed according to
Statistical Analysis
Signal intensities determined for the different regions are expressed as mean ± SEM or in box-and-whisker plots with median, 25th–75th percentiles, and lowest to highest value. Distribution box-and-whisker analyses of all 23 different tumor ROIs revealed 1 outlier (farthest value larger than the upper quartile plus 3 times the interquartile range) with an SUV of 6.6 for 18F-galacto-RGD, which was excluded from regression analysis. Between-subject correlations were calculated taking into account repeated measurements on the same subject as proposed by Bland and Altman (23). Differences between different tumor regions were evaluated using the generalized-estimating-equation approach previously introduced (24), considering correlation of structures in the same subjects. The generalized-estimating-equation approach was also used for linear regression analyses. Statistical significance was assigned to P values of less than 0.05. Computations were performed using MedCalc (MedCalc Software) and PASW (SPSS Inc.) software.
RESULTS
Tumor Data
The mean size of the total tumor area was 88 ± 16 PET pixels. The following mean values were determined: SUV for 18F-galacto-RGD = 2.9 ± 0.5, SUV for 18F-FDG = 5.4 ± 0.9, initial AUC = 0.32 ± 0.04 mM·s, rBF = 56.3 ± 8.9 mL/min/100 g, and rBV = 21.5 ± 2.9 mL/100 g.
Subgroup Analysis of Tumor Regions with Different Tracer Uptakes
Twenty-three different ROIs could be defined—an average of 2 ROIs per lesion (4 RGD−/FDG−, 5 RGD+/FDG−, 5 RGD−/FDG+, and 9 RGD+/FDG+). Respecting the tumor heterogeneity according to those clusters with different tracer uptake and biologic characteristics, subgroup analyses were performed.
When analyzing 18F-galacto-RGD and 18F-FDG separately, there was a trend toward higher DCE MRI parameters in the groups with higher tracer uptake (FDG+ or RGD+), compared with the groups with lower tracer uptake (FDG− or RGD−). However there was a substantial overlap between the groups, and the differences were significant for RGD− versus RGD+ concerning initial AUC and FDG− versus FDG+ concerning rBV (P < 0.01; Supplemental Fig. 2).
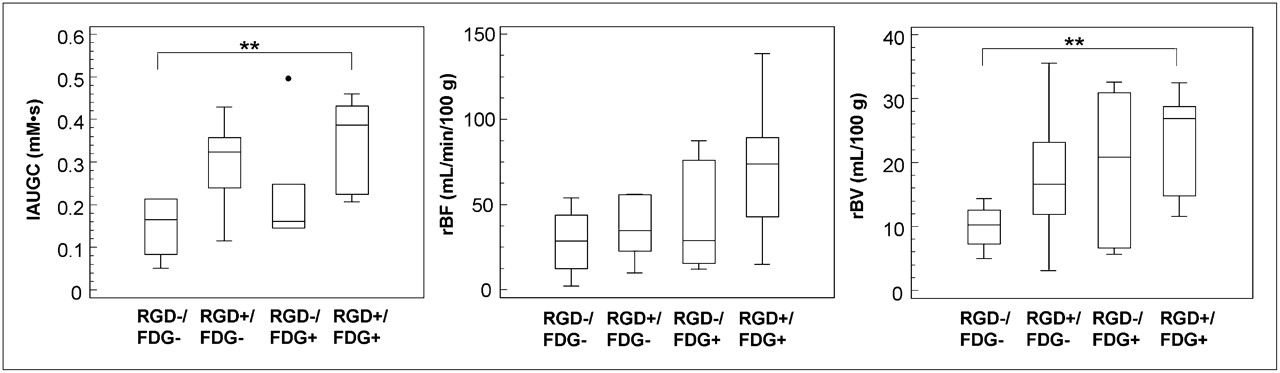
Box-and-whisker graphs (central box: values from 25th to 75th percentiles, middle line: median) for functional MRI parameters, divided according to PET data into different tumor regions (combined analysis of 18F-FDG and 18F-galacto-RGD uptake using image fusion). Tumor regions with high uptake for both tracers (RGD+/FDG+) show higher functional MRI data than do less tracer-avid tumor regions (RGD−/FDG−); difference is significant for initial AUC and rBV (**P < 0.01).
Concerning the combinatorial analysis of 18F-galacto-RGD uptake and 18F-FDG uptake, biologically active tumor regions with high uptake of both tracers (RGD+/FDG+) showed higher functional MRI data than did tumor regions with low tracer uptake (RGD−/FDG−) (FDG+/RGD+: initial AUC, 0.35 ± 0.04 mMs; rBF, 70.2 ± 12.7 mL/min/100 g; rBV, 23.3 ± 2.7 mL/100 g; FDG−/RGD−: initial AUC, 0.15 ± 0.04 mMs; rBF, 28.3 ± 10.8 mL/min/100 g; rBV, 9.9 ± 1.9 mL/100 g) (Fig. 2). Results were significant for RGD+/FDG+ versus RGD−/FDG− concerning initial AUC and rBV (P < 0.01). Otherwise, there was a substantial overlap of the functional DCE MRI data.
Considering NSCLC only, 7 lesions could be evaluated with 15 different ROIs. Combinatorial cluster analysis of 18F-galacto-RGD and 18F-FDG uptake showed in biologically active tumor areas an association between high tracer uptake and high functional MRI data equivalent to the total sample, significantly so for RGD+/FDG+ versus RGD−/FDG− concerning all 3 functional MRI parameters: initial AUC, rBF, and rBV (P < 0.01).
Correlation Analysis of PET and DCE MRI Data
Regarding the analysis of the total tumor area without addressing tissue heterogeneity, no significant correlation was found between the functional MRI and molecular PET data (rBV vs. 18F-galacto-RGD: r = 0.48, P = 0.13; rBF vs. 18F-galacto-RGD: r = 0.43, P = 0.19; initial AUC vs. 18F-galacto-RGD: r = 0.53, P = 0.09; rBV vs. 18F-FDG: r = 0.36, P = 0.27; rBF vs. 18F-FDG: r = 0.48, P = 0.13; initial AUC vs. 18F-FDG: r = 0.46, P = 0.16). Furthermore, no significant correlation was found between the SUVs of 18F-galacto-RGD and 18F-FDG PET (r = 0.10, P = 0.77).
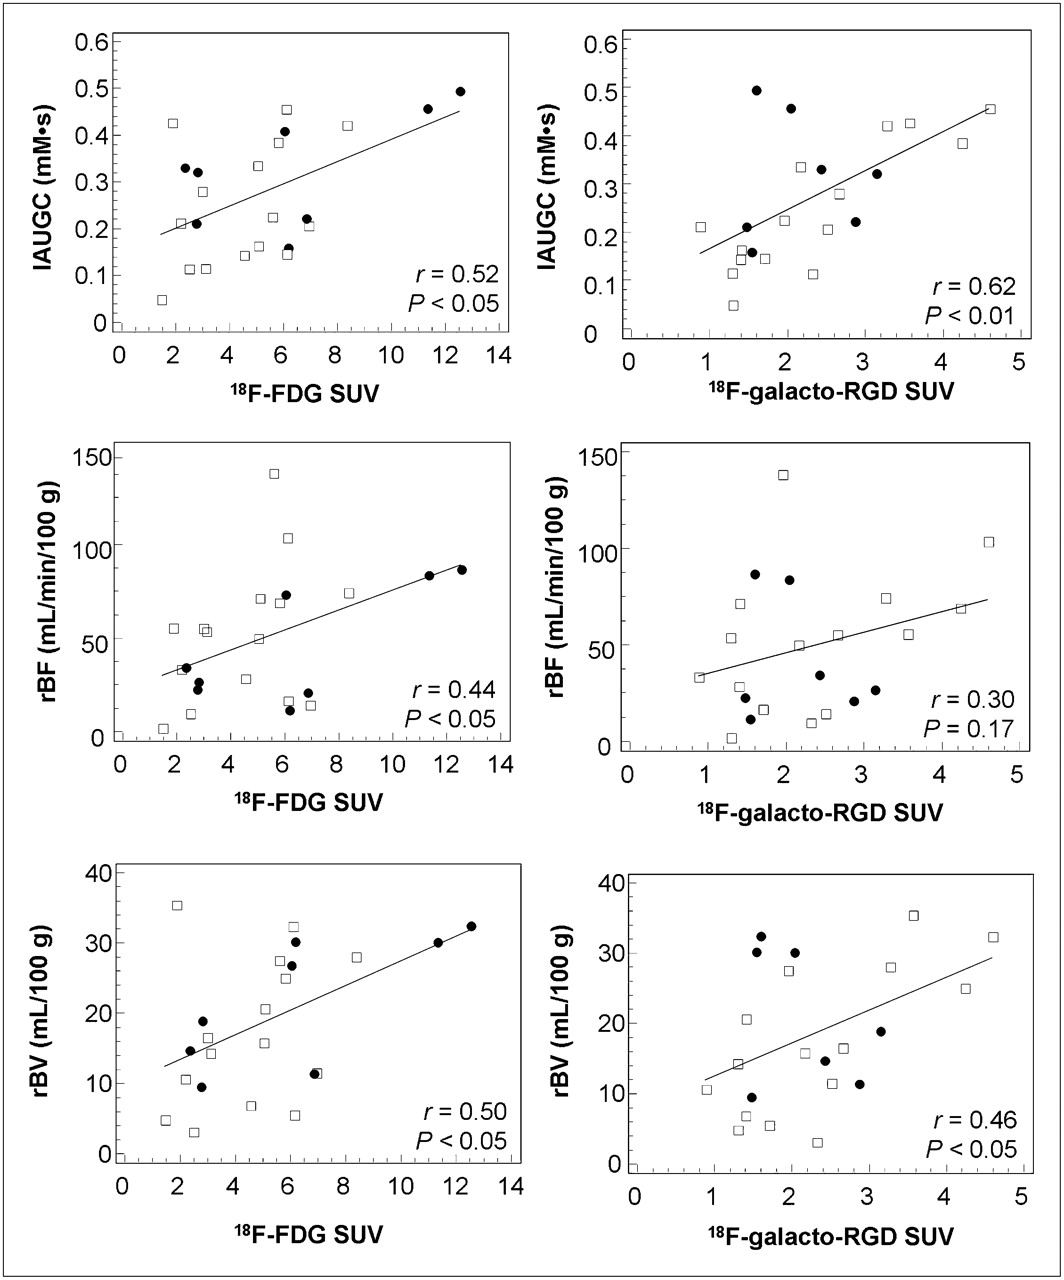
When analyzing the different areas of tumor heterogeneity based on the tracer uptake, we found a weak to moderate but significant correlation of 18F-galacto-RGD or 18F-FDG with the functional MRI data, except for 18F-galacto-RGD versus rBF (Fig. 3).

Scatterplots and regression lines correlating SUVs from PET data with functional MRI parameters of different tumor ROIs (□ = NSCLC; • = other histologic types). Pearson correlation coefficients and P values of between-subject correlation (generalized-estimating-equation model) are shown in scatterplots. Significant correlation was found between molecular PET data and all functional MRI parameters, except for 18F-galacto-RGD vs. rBF.
Considering NSCLC only, the correlation between 18F-galacto-RGD and rBV with respect to initial AUC was more pronounced in this subgroup (vs. rBV, r = 0.70, P < 0.01; vs. rBF, r = 0.39, P = 0.17; vs. initial AUC, r = 0.85, P < 0.01), compared with 18F-FDG (vs. rBV, 0.31, P = 0.26; vs. rBF, r = 0.47, P = 0.09; vs. initial AUC, r = 0.40, P = 0.14).
DISCUSSION
In the present study, we characterized tumor biology and heterogeneity noninvasively through DCE MRI measurement of tissue perfusion parameters and PET measurement of integrin αvβ3 expression and glucose metabolism—molecular parameters that characterize biologic tumor activity. Tumor perfusion is highest in areas with simultaneously high glucose metabolism and αvβ3 expression, whereas tumor perfusion is restricted in areas with both low glucose metabolism and low αvβ3 expression.
For analysis of the multiparametric, multimodality imaging data, we used dedicated imaging software to specifically address tumor heterogeneity. Tissue heterogeneity is increasingly recognized as being of major importance for correctly describing tumor biology by molecular imaging (3). When simple ROI approaches encompassing large areas of the tumor are used, the signal from mostly necrotic areas and from more active and viable areas may be mixed and the resulting signal be a mixture of biologically completely different areas. In this study, we specifically addressed tissue heterogeneity using PET to define areas of different biologic activity. 18F-FDG was used as a surrogate parameter of cell viability and glucose metabolism, and 18F-galacto-RGD was used to assess integrin αvβ3 expression. The integrin αvβ3 is supposed to be a key player in angiogenesis and tumor cell metastasis and is a marker of angiogenic, but not of resting, vessels (25). Moreover, αvβ3 is known to correlate with a more aggressively metastasizing tumor phenotype in preclinical studies and clinical studies of breast cancer and is therefore an interesting target for molecular imaging.
With regard to perfusion and glucose metabolism in tumors, our results showed a tendency toward higher values of rBF, rBV, and initial AUC in areas with more intense 18F-FDG uptake, but the correlation was only moderate. The relationship between the parameters is complex. Tumor growth requires an adequate delivery of nutrients, for which a well-developed tumor vascular supply is essential. Consequently, one would expect a close relationship between tumor glucose metabolism and perfusion. However, tumor glucose metabolism is also stimulated by hypoxia, which may occur when the tumor blood flow is inadequate (26). Miles et al. showed that tumor blood flow and metabolism are dependent on tumor size and stage and are coupled in early stages but become uncoupled in more advanced disease (27).
Concerning perfusion and αvβ3 expression, our results showed a tendency toward higher values for all functional MRI parameters in areas with more intense 18F-galacto-RGD uptake. This tendency was more pronounced for rBV and initial AUC and in the subgroup of NSCLC. A closer correlation might have been expected, because the integrin αvβ3 is supposed to be a key player in angiogenesis and is a marker of activated endothelial cells (25). However, it is increasingly recognized that the role of the αvβ3 integrin in tumor biology is complex, and the exact role of αvβ3 expression in angiogenesis is still a matter of debate. Currently, αvβ3 is assumed to have either a positive or a negative regulatory role in angiogenesis, depending on the respective biologic context (28). Moreover, it is increasingly recognized that αvβ3 is expressed not only on endothelial cells during angiogenesis but also on a variety of tumor cells, as well as on benign cell types such as macrophages and osteoclasts, therefore limiting its value as a pure marker of angiogenesis (29,30).
We also used the combination of 18F-FDG and 18F-galacto-RGD uptake to define up to 4 areas within a given tumor with different biologic characteristics: RGD−/FDG− areas, RGD+/FDG− areas, RGD−/FDG+ areas, and RGD+/FDG+ areas. Our results showed that in areas with low glucose metabolism and low αvβ3 expression as indicated by low 18F-FDG and 18F-galacto-RGD uptake, respectively, tissue perfusion is correspondingly restricted as well. This result is not unexpected, because in these areas the amount of viable cells is probably low and areas of necrosis more abundant. Our results also suggest that within areas with high glucose metabolism and intense αvβ3 expression, tumor perfusion is significantly higher. To our knowledge, this finding has not yet been examined in detail for different areas within a single tumor, especially not including imaging of αvβ3 expression. Addressing tissue heterogeneity when using functional and molecular imaging for assessment of tumor biology might be of clinical importance, such as when molecular imaging is used to plan biologic target volumes for intensity-modulated radiation therapy, in which it is mandatory to address tissue heterogeneity to correctly apply the highest boost of radiation to the biologically relevant tumor areas.
One major limitation concerning the interpretation of our data is the aspect of manual image fusion performed for data analysis. In a previous study using image fusion, we demonstrated that the image quality of an 18F-galacto-RGD PET scan allows for adequate manual fusion with MRI or multislice CT using anatomic landmarks (31). However, mismatches were notable and were due mostly to the different gantry tables and patient positions in MRI and PET. Thus, we cannot exclude mismatches in the current study, in which we fused 2 PET datasets—an even more challenging task because of the lower amount of anatomic information. Thus, exact congruence between the different tumor areas analyzed cannot be guaranteed, limiting the interpretation of our data. To optimize results in future studies, external markers and immobilization devices would have to be applied to facilitate image fusion (32). Moreover, many of the limitations might be overcome in the future by software for motion correction and by the introduction of hybrid whole-body PET/MRI scanners.
Concerning the quality of our DCE MRI technique, our functional MRI data in general are consistent with data published in the literature for malignant tumors, suggesting that most values are within a reliable and realistic range (21). To exclude excessively noisy data, we evaluated only regions with more than 5 pixels. Still, data quality in some regions might be limited by artifacts due to breathing and by misalignment of the different datasets. One further potential limitation is the use of static imaging instead of dynamic imaging for 18F-galacto-RGD PET. Although clinical and preclinical studies have shown relatively stable tracer retention at 60 min after injection, concern remains that the influence of blood flow on the SUVs of static 18F-galacto-RGD PET images could overemphasize relationships between MRI parameters (also heavily influenced by blood flow) and uptake of 18F-galacto-RGD. This possibility has to be clarified in future studies that include dynamic scans and kinetic modeling.
Also, the small number of patients included in our study restricts the power of our results. Finally, DCE MRI was performed for only 90 s, allowing for calculation of only parameters dominated by perfusion, because assessment of parameters reflecting additionally microvascular permeability, such as the transfer constant Ktrans, require a longer acquisition.
CONCLUSION
Noninvasive multimodality, multiparametric assessment of the spatial heterogeneity of tumor biology is feasible with MRI and PET using dedicated imaging software yet is limited by the restrictions of retrospective image fusion. However, on the basis of these preliminary results, future prospective studies on larger, homogeneous patient populations are now warranted to elucidate which combination of imaging parameters is best suited for phenotyping invasiveness, metastatic potential, and patient prognosis. Finally, with combined PET/MRI scanners already being used preclinically and the first prototypes being developed for clinical use, it is hoped that a thorough and complete assessment of morphologic, functional, and molecular tumor characteristics will be feasible in the future in a 1-stop-shop approach within the concept of individualized medicine (33).
Acknowledgments
This work was supported by the German Research Foundation (DFG) within the SFB-Initiative 824 (collaborative research center), “Imaging for Selection, Monitoring and Individualization of Cancer Therapies” (SFB824, project C5).
- © 2010 by Society of Nuclear Medicine
REFERENCES
- Received for publication March 29, 2010.
- Accepted for publication August 6, 2010.


Jump to section
Related Articles
Cited By...
- Prospective Evaluation of 18F-Fluorodeoxyglucose Uptake in Postischemic Myocardium by Simultaneous Positron Emission Tomography/Magnetic Resonance Imaging as a Prognostic Marker of Functional Outcome
- Integrin-Targeted Molecular Imaging of Experimental Abdominal Aortic Aneurysms by 18F-labeled Arg-Gly-Asp Positron-Emission Tomography
- Quantitative, Simultaneous PET/MRI for Intratumoral Imaging with an MRI-Compatible PET Scanner