


Abstract
Breast cancers (BCs) with high human epidermal growth factor receptor type 2 (HER2) expression are most likely to respond to trastuzumab; however, the mechanisms of action of trastuzumab are complex and there are no established biomarkers to accurately monitor treatment outcome in individual patients. Therefore, our aim was to determine, in human BC xenografts in athymic mice treated with trastuzumab, whether there were any changes in 18F-FDG uptake that were associated with response to the drug and that could have utility in monitoring response in patients. Methods: Baseline tumor uptake of 18F-FDG was measured in mice with MDA-MB-361 HER2-overexpressing xenografts and MDA-MB-231 xenografts with low HER2 expression by small-animal PET imaging on day 0. Mice were treated with phosphate-buffered saline (PBS) or trastuzumab (4 mg/kg), and small-animal PET was repeated 2 d after treatment. Maintenance doses of trastuzumab (2 mg/kg) or PBS were administered on days 7 and 14, and mice were imaged again on days 9 and 16. Tumor uptake was measured as percentage injected dose per gram (%ID/g) by volume-of-interest analysis on days 0 (baseline), 2, 9, and 16, followed by biodistribution studies on day 16. Tumor growth was measured, and a tumor growth index was calculated. Results: The treatment of mice with trastuzumab, compared with control mice treated with PBS, resulted in a significant decrease in tumor uptake of 18F-FDG in HER2-overexpressing MDA-MB-361 xenografts after 16 d of treatment (2.6 ± 0.8 %ID/g vs. 4.6 ± 1.8 %ID/g, respectively; P < 0.03) but not after 2 or 9 d of treatment (P = 0.28–0.32). In contrast, there was no significant change in the tumor uptake of MDA-MB-231 xenografts with low HER2 expression during the entire course of therapy (4.4 ± 1.7 %ID/g vs. 3.6 ± 1.1 %ID/g, respectively; P = 0.31). Trastuzumab treatment, compared with PBS treatment of controls, resulted in significant growth inhibition of MDA-MB-361 xenografts as early as 10 d from the initiation of treatment (tumor growth index, 0.7 ± 0.2 vs. 1.7 ± 0.3, respectively; P < 0.0005), whereas no tumor growth inhibition was observed for MDA-MB-231 xenografts (5.3 ± 2.7 and 5.2 ± 3.0; P = 0.95). Conclusion: Changes in the tumor uptake of 18F-FDG after therapy accurately identified responding and nonresponding human BC xenografts in athymic mice treated with trastuzumab; however, diminished glucose utilization did not precede changes in tumor volume.
Trastuzumab (Herceptin; Genentech, Inc.) is an immunotherapeutic agent for breast cancer (BC), which is directed against the human epidermal growth factor receptor 2 (HER2). HER2 is overexpressed in 20% of cases of BC and is a marker of aggressive disease and poor prognosis (1). Trastuzumab has been approved for the treatment of advanced BC and as adjuvant therapy for early-stage disease; it is also currently under investigation for use in the neoadjuvant treatment of locally advanced BC (2,3). Tumors with high HER2 expression are more likely to respond to trastuzumab-based therapy than are HER2 low-expressing tumors (4). Only patients with HER2 amplification evaluated immunohistochemically in a primary tumor biopsy or identified by fluorescence in situ hybridization probing for the HER2 gene are eligible for trastuzumab-based therapy (4). Although these tests are useful in selecting patients who are most likely to respond to trastuzumab, there are no known clinical tumor markers that allow the accurate prediction or monitoring of tumor response in an individual patient. Indeed, despite preselecting patients with HER2 overexpression, only a minority (12%−35%) of patients respond to trastuzumab when administered as a single agent (5). Response rates improve when trastuzumab is combined with anthracyclines or taxanes; however, approximately half of all eligible patients receive no therapeutic benefit while at risk for trastuzumab-associated cardiotoxicity (3,6). The ability to monitor response early in the course of therapy would allow unresponsive patients to receive alternative therapy and reduce the cost to the health care system by discontinuing treatment in these patients (7).
PET using 18F-FDG reveals the increased glycolytic rate of malignant cells in tumors, compared with surrounding normal tissues (8). The addition of CT provides precise information on the anatomic location of 18F-FDG uptake; 18F-FDG PET/CT has proven useful in the detection and restaging of recurrent BC and is under investigation as a probe for initial diagnosis and staging of primary disease (9,10). An exciting application of 18F-FDG PET is its ability to exploit treatment-mediated changes in tumor glucose utilization in cancer cells for monitoring response. Reductions in tumor uptake of 18F-FDG after chemotherapy correlate with response to neoadjuvant treatment of locally advanced BC (11–15) and to chemotherapy of recurrent and metastatic disease (16,17). 18F-FDG has also shown promise for predicting the response of BC to hormonal therapy (18) and to treatment with the tyrosine kinase inhibitor lapatinib (19). Additionally, a reduction in 18F-FDG tumor uptake was observed after trastuzumab therapy in combination with the chemotherapeutic drugs vinorelbine and gemcitabine in case studies of individual patients with HER2-positive BC (20,21). Our aim was therefore to examine, in human BC xenografts in athymic mice treated with trastuzumab, any changes in 18F-FDG accumulation that may suggest that it could have utility in monitoring response to this drug in patients and would provide the needed preclinical evidence for a subsequent human study. We hypothesized that the decreased viability of BC cells exposed to trastuzumab may diminish their glucose utilization, which could then be sensitively detected by PET using 18F-FDG.
MATERIALS AND METHODS
BC Cells
MDA-MB-361 and MDA-MB-231 cells were purchased from the American Type Culture Collection. MDA-MB-361 cells were cultured in Leibovitz L15 medium (Sigma-Aldrich) supplemented with 20% fetal bovine serum (Invitrogen) under a 100% air atmosphere at 37°C. MDA-MB-231 cells were cultured in Dulbecco's minimal essential medium (Ontario Cancer Institute) supplemented with 10% fetal bovine serum (Invitrogen) containing 100 U of penicillin per milliliter and 100 μg of streptomycin per milliliter under a 5% CO2 atmosphere at 37°C.
Flow Cytometry
In this study, the relative HER2 expression level of MDA-MB-231 and MDA-MB-361 cells was verified by flow cytometry using fluorescein isothiocyanate–conjugated anti-HER2/neu IgG1 (Clone Neu 24.7; BD Biosciences) as previously reported (22). Negative controls consisting of cells without immunofluorescence staining or cells incubated with the corresponding IgG isotype controls were included. Datasets were analyzed using CELLQuest software (version 3.3; BD Biosciences). Results were reported as the mean fluorescence intensity (MFI) calculated by subtracting the fluorescence intensity of the isotype control from the fluorescence of cells stained for HER2/neu.
Small-Animal PET
MDA-MB-361 and MDA-MB-231 tumor xenografts were established in female athymic CD1 nu/nu mice (Charles River). For MDA-MB-361 xenografts, mice were first implanted with a 0.72-mg 60-d sustained-release 17β-estradiol intradermal pellet (Innovative Research of America) at least 24 h before inoculation. The mice were inoculated subcutaneously in the left hind thigh with 1 × 10⁷ MDA-MB-361 cells and in the right hind thigh with 5 × 10⁶ MDA-MB-231 cells in 200 μL of a 1:1 mixture of Matrigel (BD Biosciences) and serum-free culture medium. Mice were randomized into treatment and control groups (n = 7) once tumors had reached an appropriate size (average tumor volumes were 113 ± 57 and 225 ± 156 mm3 for MDA-MB-361 and MDA-MB-231 xenografts, respectively). All mice underwent small-animal PET and micro-CT before treatment (day 0). After these baseline images, mice were treated with phosphate-buffered saline (PBS) (control) or a loading dose of trastuzumab (4 mg/kg) diluted in PBS to a volume of 100 μL and administered intraperitoneally. Small-animal PET and micro-CT were repeated 2 d after treatment. Maintenance doses of trastuzumab (2 mg/kg) or PBS were administered on days 7 and 14, and mice were imaged again on days 9 and 16. Trastuzumab doses were identical to those used clinically on a milligram-per-kilogram basis (3). Images were acquired on a Focus 220 microPET scanner (Siemens Preclinical Solutions). All mice were kept fasting, with access to water, for 15–20 h before 18F-FDG administration and imaging. Mice were placed on a heating pad 1 h before injection, and body weight was measured. Blood glucose levels were measured (Ascensia Contour; Bayer) from a needle prick to the saphenous or tail vein. Mice were anesthetized by inhalation of 2% isoflurane in oxygen and injected intraperitoneally with 10.8 ± 1.2 MBq of 18F-FDG (Hamilton Health Sciences and McMaster University). 18F-FDG was injected intraperitoneally to facilitate repeated injections and reproducible uptake times in individual mice. Previous studies have shown that the tumor and normal tissue uptake of 18F-FDG administered by intraperitoneal injection is comparable to the biodistribution of 18F-FDG after intravenous injection at 45–60 min after injection (23). After injection, the mice were maintained under anesthesia and warmed using a heating pad. Mice were imaged at exactly 60 min after injection using an acquisition time of 10 min. Images were reconstructed using an ordered-subset expectation maximization, followed by a maximum a posteriori probability reconstruction algorithm with no attenuation correction and no correction for partial-volume effects because all tumors had diameters greater than 4 mm, which was greater than 2.5 times the resolution (full width at half maximum) of the tomograph (Siemens Preclinical Solutions). Quantification was performed by volume-of-interest (VOI) analysis using Inveon Research Workplace software (Siemens), and tumor uptake was expressed as the mean ± SD percentage injected dose per gram (%ID/g) and the maximum percentage injected dose per gram (%ID/gMAX), calculated using the maximum voxel value within the VOI. To calculate %ID, a quantification calibration factor was measured using a source of 18F with a known amount of radioactivity. Tumor volume was obtained by summing multiple 2-dimensional regions of interest from consecutive tomographic planes encompassing the entire tumor volume. Immediately after small-animal PET, micro-CT was performed on an eXplore Locus Ultra Preclinical CT scanner (GE Healthcare) with routine acquisition parameters (80 kVp, 70 mA, and voxel size of 150 × 150 × 150 μm). Small-animal PET and micro-CT images were coregistered using Inveon Research Workplace software (Siemens). Micro-CT was used for anatomic referencing but not for delineating VOIs. Response to trastuzumab was determined by measuring the tumors every 2–4 d using calipers and calculating tumor volume using the formula length × width2 × 0.5. A tumor growth index (TGI; mean ± SD) was calculated by dividing the tumor volume by the initial volume on day 0 (24). The Guide for the Care and Use of Laboratory Animals (25) was followed, and all animal studies were conducted under a protocol (no. 989.5) approved by the Animal Care Committee at the University Health Network in accordance with Canadian Council on Animal Care guidelines.
Biodistribution Studies
Correlative biodistribution studies were performed on the final day of small-animal PET and micro-CT (day 16). Blood was collected via heart puncture at 59 min after injection of 18F-FDG. Mice were immediately sacrificed at 60 min after injection by cervical dislocation and imaged by small-animal PET and micro-CT as described above. After imaging, tumor and normal tissues were collected and weighed, and their radioactivity was measured in a γ-counter (PerkinElmer). Tumor and normal tissue uptake was expressed as mean ± SD %ID/g.
Immunohistochemical Staining of Explanted Tumors
Excised MDA-MB-361 and MDA-MB-231 tumors were cut into 2- to 3-mm sections, fixed in 10% neutral buffered formalin for a minimum of 24 h, and then paraffin-embedded. Sections (4 μm) were dewaxed and rehydrated before antigen retrieval. Endogenous peroxidase and biotin activities were blocked, respectively, using 3% hydrogen peroxide and an avidin/biotin blocking kit (catalog no. TA-015-BB; Lab Vision). After blocking for 15 min with 10% normal horse serum, HER2 was detected using mouse anti-HER2 (1:100 dilution for 1 h) (Novocastra Laboratories Ltd.), and Ki67 was detected using mouse anti-Ki67 (1:100 dilution overnight) (Dako). For HER2, the primary antibody was followed with a biotinylated horse antimouse secondary antibody (Vector Labs) for 30 min and horseradish peroxidase–conjugated ultrastreptavidin labeling reagent (ID Labs Inc.) for 30 min. For Ki67, the primary antibody was followed with an antimouse polymer reagent (ImmPress Kit; Vector). After the sections had been rinsed 3 times with PBS, color was developed with freshly prepared NovaRed solution (Vector Labs). Finally, the sections were counterstained lightly with Mayer hematoxylin, dehydrated in alcohols, cleared in xylene, and mounted in Permount (Fisher Scientific). Negative control slides were prepared without the primary antibody. All samples were scored in a masked manner by a pathologist with expertise in BC. The HER2 sections were scored as the percentage of strong, complete, homogeneous membrane staining, and the Ki67 sections were scored as the percentage of positively staining nuclei (mean ± SD).
Statistical Analysis
Comparisons of the tumor uptake of 18F-FDG and tumor growth indices were made using Student t test (P < 0.05). Correlation between the biodistribution and imaging results was determined using the Pearson correlation test (P < 0.05).
RESULTS
Relative HER2 Expression of BC Cells
The relative HER2 expression level of MDA-MB-361 and MDA-MB-231 cells was confirmed by flow cytometry (Fig. 1). MDA-MB-231 cells exhibited low HER2 density, with an MFI of 3.0 (Fig. 1A). In contrast, MDA-MB-361 cells exhibited greater HER2 expression, as revealed by an MFI of 45.0 (Fig. 1B). These flow cytometry results correlated well with saturation radioligand binding assays performed with 111In-diethylenetriaminepentaacetic acid (DTPA)–trastuzumab, which demonstrated that MDA-MB-231 and MDA-MB-361 cells have 5.4 ± 0.7 × 10⁴ and 5.1 ± 1.7 × 10⁵ HER2 receptors per cell, respectively (24).
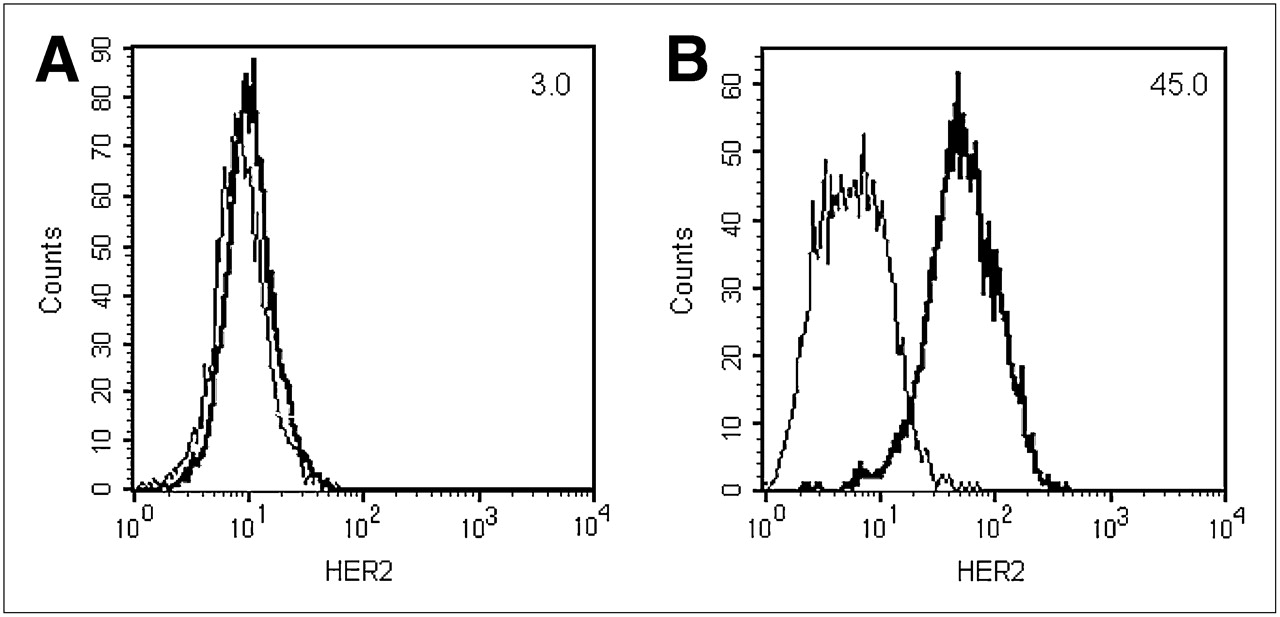
Flow cytometric analysis of HER2 receptor expression of MDA-MB-231 (A) and MDA-MB-361 (B) human BC cells. MFI is indicated in top right corner. Plots are representative results from 3 experiments.
Tumor Response to Trastuzumab
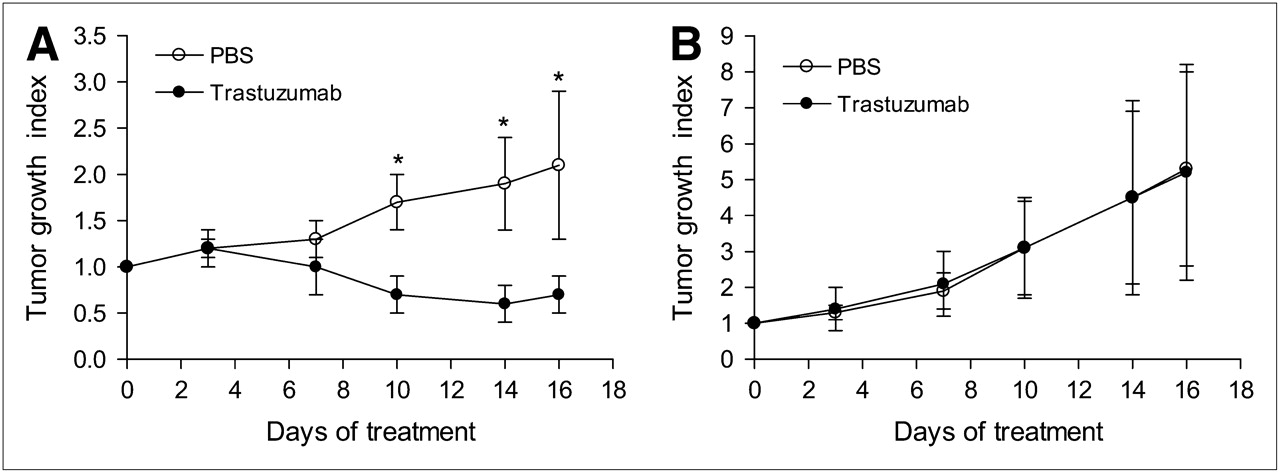
Tumor growth was strongly inhibited by trastuzumab in mice bearing subcutaneous MDA-MB-361 xenografts. TGIs in trastuzumab-treated mice bearing these tumors were significantly lower than those in PBS-treated controls as early as 10 d after the initiation of treatment (P < 0.0005; Fig. 2A). After 16 d of treatment, PBS-treated MDA-MB-361 tumors, compared with trastuzumab-treated tumors—which were reduced in volume by an average of 30% (TGI of 2.1 ± 0.8 vs. 0.7 ± 0.2, respectively; P < 0.0005)—had doubled in size. There were no significant tumor growth inhibitory effects of trastuzumab on MDA-MB-231 tumors with much lower levels of HER2 (Fig. 2B). The TGIs on day 16 for PBS- and trastuzumab-treated mice bearing MDA-MB-231 xenografts were 5.3 ± 2.7 and 5.2 ± 3.0, respectively (P = 0.95). Interestingly, MDA-MB-231 xenografts had a significantly greater proliferation rate than did MDA-MB-361 xenografts (TGI on day 16 of 5.3 ± 2.7 vs. 2.1 ± 0.8, respectively; P = 0.01), despite the higher HER2 expression of the MDA-MB-361 tumors.

TGI of MDA-MB-361 (A) and MDA-MB-231 (B) xenografts. Mice were treated with loading dose of trastuzumab (4 mg/kg) on day 0, followed by maintenance doses (2 mg/kg) on days 7 and 14. Significant differences between trastuzumab-treated mice and PBS-treated mice are shown (*P < 0.0005). Values shown are mean ± SD (n = 7).
Small-Animal PET and Biodistribution Studies
There was no difference in the tumor uptake of 18F-FDG in the trastuzumab-treated and PBS control groups of mice before treatment (baseline; day 0) for both the MDA-MB-361 and the MDA-MB-231 xenografts (Figs. 3A and 3B). Interestingly, however, average baseline (pretreatment) tumor uptake of 18F-FDG was marginally greater for MDA-MB-231 xenografts than for MDA-MB-361 xenografts (5.4 ± 1.7 %ID/g vs. 4.1 ± 1.4 %ID/g, respectively; P = 0.049), but maximum baseline tumor uptake was significantly greater for MDA-MB-231 xenografts than for MDA-MB-361 xenografts (10.7 ± 3.1 %ID/gMAX vs. 6.4 ± 1.8 %ID/gMAX, respectively; P = 0.0003; Fig. 3C).
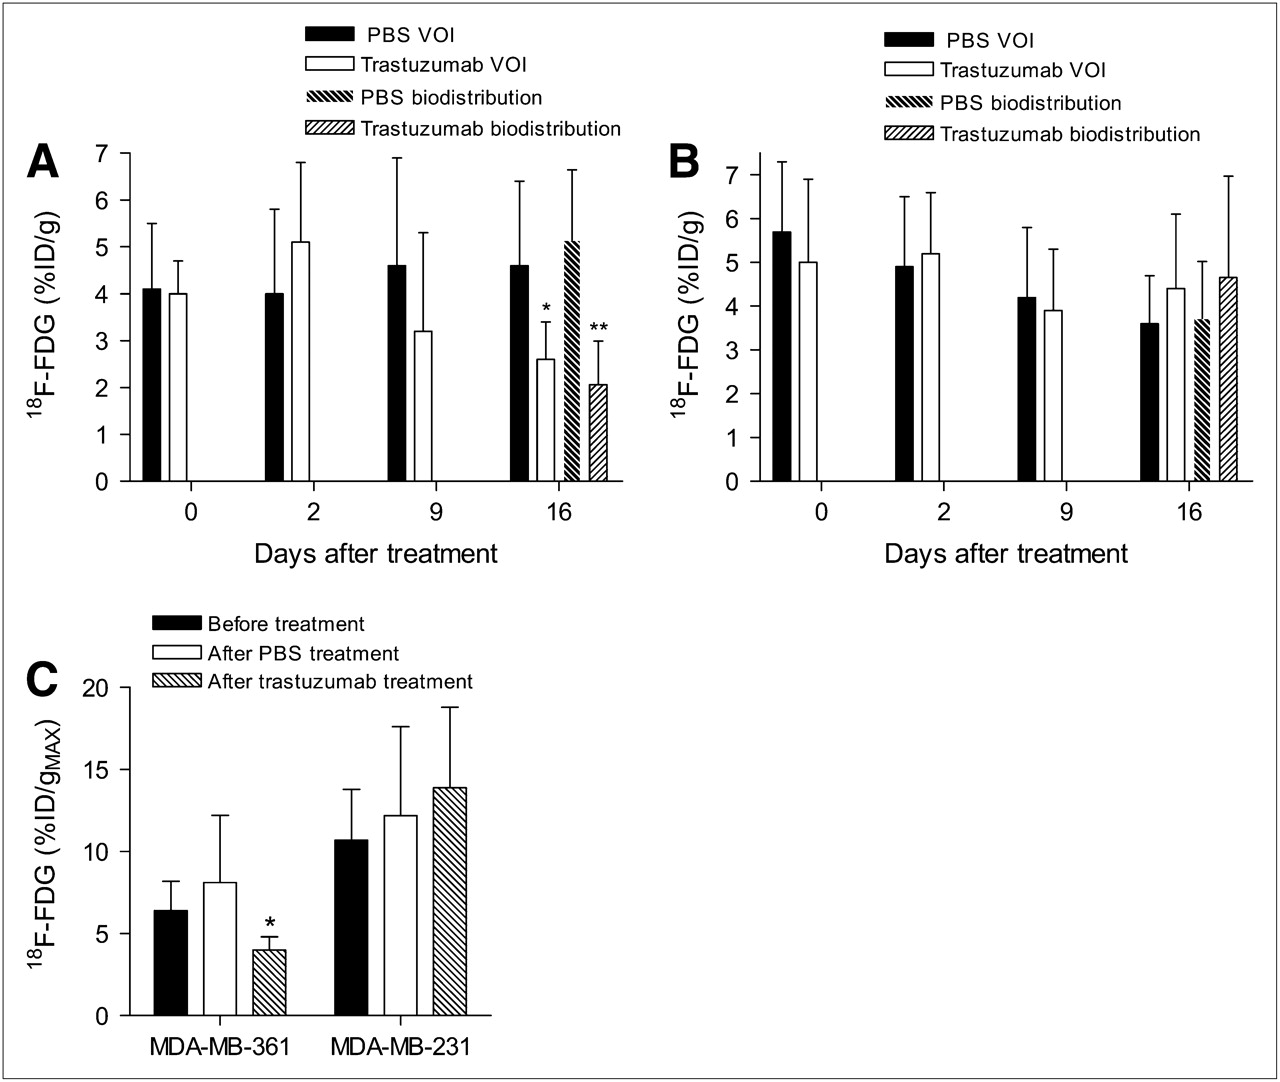
Tumor uptake of 18F-FDG measured by VOI analysis and biodistribution studies in athymic mice bearing MDA-MB-361 (A) and MDA-MB-231 (B) human BC xenografts. Pretreatment uptake of 18F-FDG was measured by small-animal PET/CT on day 0, followed by posttreatment scans on days 2, 9, and 16. Biodistribution studies were performed on day 16 after small-animal PET/CT. Significant differences between trastuzumab-treated mice and PBS-treated mice are shown (*P < 0.03; **P < 0.002). Data are presented as average %ID/g (mean ± SD, n = 5–7). %ID/gMAX of MDA-MB-361 and MDA-MB-231 xenografts before and after 16 d of treatment with PBS and trastuzumab (C) was calculated from voxel with highest accumulation of 18F-FDG. Significant differences between trastuzumab-treated mice and baseline uptake are shown (*P < 0.03).
There was no significant change in the tumor uptake of 18F-FDG in MDA-MB-361 xenografts, compared with baseline or PBS-treated controls, after 2 or 9 d of trastuzumab treatment (P = 0.28–0.32; Fig. 3A). After 16 d of trastuzumab therapy, however, there was a significant 43% decrease in the mean tumor uptake of 18F-FDG in trastuzumab-treated mice, compared with PBS-treated control mice bearing HER2-overexpressing MDA-MB-361 xenografts quantified by VOI analysis (4.6 ± 1.8 %ID/g vs. 2.6 ± 0.8 %ID/g, respectively; P < 0.03; Fig. 3A). Similarly, there was a 60% reduction in tumor uptake of 18F-FDG measured by biodistribution studies (5.1 ± 2.1 %ID/g vs. 2.1 ± 0.9 %ID/g, respectively; P < 0.002; Fig. 3A). Furthermore, on day 16, tumor uptake of 18F-FDG was 35% lower than the tumor uptake at baseline in trastuzumab-treated mice bearing MDA-MB-361 xenografts (2.6 ± 0.8 %ID/g vs. 4.0 ± 0.7 %ID/g, respectively; P = 0.01; Figs. 3A and 4A). A similar trend was observed in %ID/gMAX: compared with PBS-treated tumors, trastuzumab-treated tumors showed a 55% decrease in %ID/gMAX, and compared with pretreatment 18F-FDG uptake, posttreatment uptake showed a 34% decrease (P < 0.03; Fig. 3C). In contrast, there was no significant difference in the mean or maximum tumor uptake of 18F-FDG in MDA-MB-231 xenografts in trastuzumab-treated mice, compared with PBS-treated controls (Figs. 3B, 3C, and 4B; P = 0.31–74). Interestingly, there was a modest but statistically insignificant decrease in the average tumor uptake of 18F-FDG in MDA-MB-231 xenografts in trastuzumab- and PBS-treated mice, compared with baseline uptake over the course of therapy (Fig. 3B). This reduction in tumor uptake was statistically significant only for PBS-treated control mice on day 16, compared with baseline (3.6 ± 1.1 vs. 5.7 ± 1.6, respectively; P = 0.01). Nonetheless, there was no difference in the maximum tumor uptake (%ID/gMAX), compared with baseline uptake, for trastuzumab- and PBS-treated mice (Fig. 3C). Additionally, areas of central necrosis were visualized on many of the MDA-MB-231 tumors (Fig. 4C).
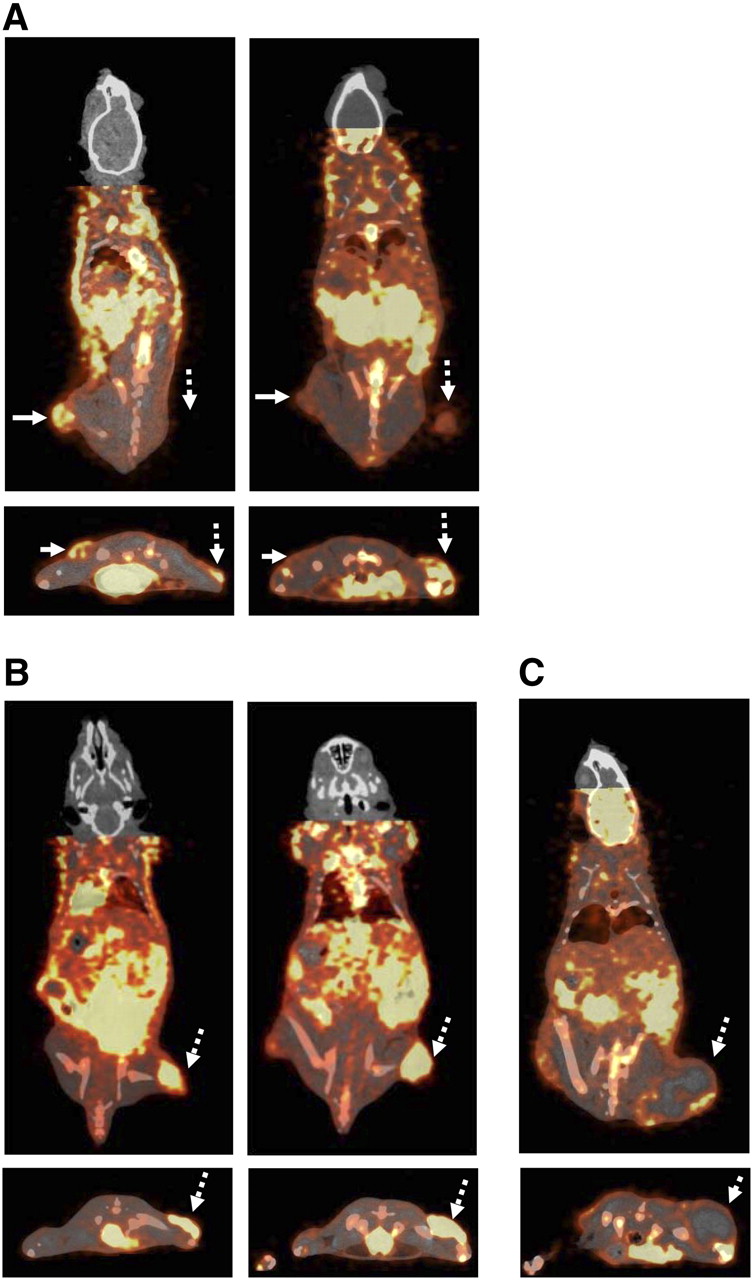
Coronal (upper) and transaxial (lower) small-animal PET coregistered micro-CT images of representative athymic mice coimplanted subcutaneously in left hind leg with MDA-MB-361 xenografts and right hind leg with MDA-MB-231 human BC xenografts (A) or with only MDA-MB-231 xenografts on right hind leg (B) at 60 min after intraperitoneal injection of 18F-FDG. Small-animal PET/CT images were acquired before treatment on day 0 (left) or after treatment on day 16 (right) of trastuzumab therapy. Tumors of interest are indicated by solid arrows (MDA-MB-361) or broken arrows (MDA-MB-231). Also shown is representative large MDA-MB-231 xenograft with extensive central necrosis (C). Image intensities were adjusted for optimal delineation of VOIs and not for equivalent visualization.
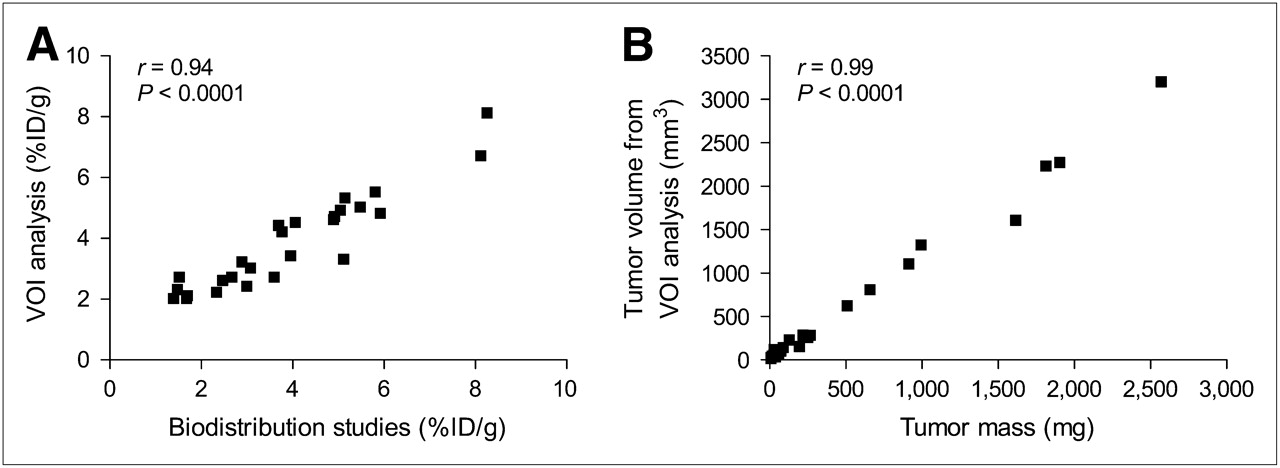
An excellent correlation was observed between VOI analysis of the small-animal PET images and tumor uptake measured ex vivo in biodistribution studies on day 16 (r = 0.94, P < 0.0001; Fig. 5A). Furthermore, there was an excellent linear correlation between the tumor volume measured by VOI analysis (mm3) and tumor weights (mg) obtained at the end of the study (r = 0.99, P < 0.0001; Fig. 5B). There were no decreases in body mass among the mice during therapy, and differences in body mass between mice were negligible (22.3 ± 1.6 g). Additionally, blood glucose levels of fasting mice were consistent over the 16 d, with an average of 6.4 ± 1.4 mmol/L.

Correlations between estimation of 18F-FDG concentrations by VOI analysis of images and tissue biodistribution studies (A) and tumor volume measured by VOI analysis and tumor mass of explanted xenografts (B).
Immunohistochemical Staining of Explanted Tissues
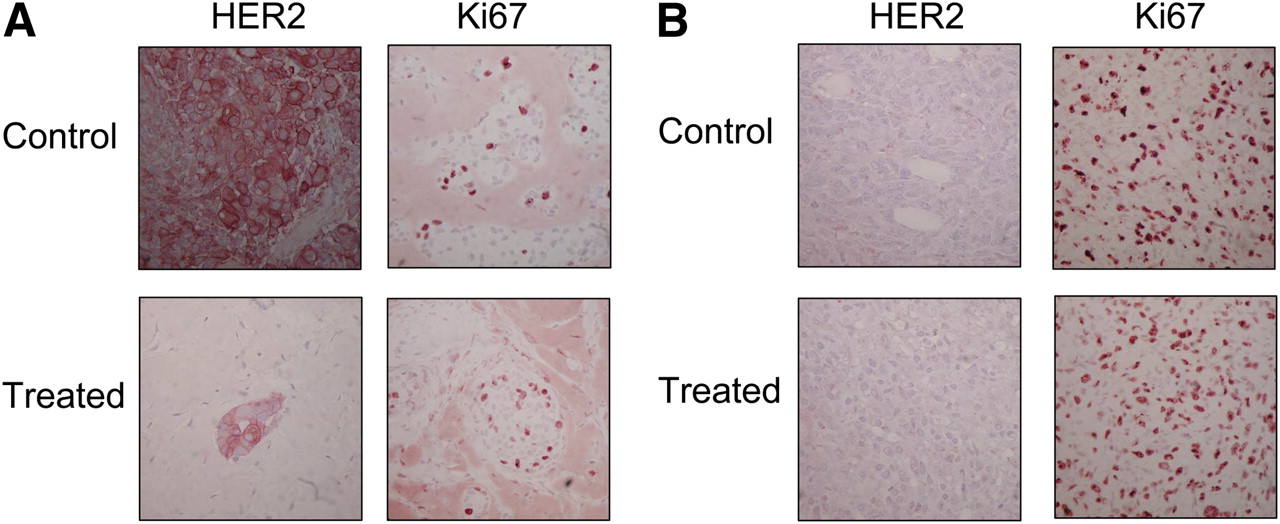
PBS-treated control MDA-MB-361 xenografts stained strongly for HER2, with an average of 57% ± 20% positively staining cells (Table 1; Fig. 6A). After trastuzumab therapy, there was a significant decrease in HER2 staining due to a dramatic eradication of viable tumor cells (Fig. 6A). Additionally, there was an apparent but statistically insignificant reduction in the percentage of positively staining cells after trastuzumab treatment, compared with PBS treatment of controls (20% ± 17% vs. 57% ± 20%; P = 0.08); however, these results should be considered cautiously because there were few viable cells remaining after treatment (Fig. 6A). PBS-treated MDA-MB-231 tumors were negative for HER2 expression, and no changes in HER2 density were noted after trastuzumab therapy (Table 1; Fig. 6B). The percentage of Ki67-positive cells in MDA-MB-361 tumors in control mice receiving PBS was 20% ± 10%, which was unchanged after trastuzumab therapy (23% ± 10%; Table 1; Fig. 6A). In contrast, in the rapidly proliferating MDA-MB-231 tumors in PBS-treated control mice, 85% ± 7% of cells were Ki67-positive, which was similarly unchanged with trastuzumab exposure (90% ± 0%; Table 1; Fig. 6B).

Immunohistochemical staining using CB11 anti-HER2/neu and MIB-1 anti-Ki67 antibodies of explanted representative MDA-MB-361 xenografts (A) and MDA-MB-231 xenografts (B) treated for 16 d with PBS (upper panels) or trastuzumab (lower panels).
Immunohistochemical Analysis of Explanted MDA-MB-361 and MDA-MB-231 Human BC Xenografts Stained for HER2 and Ki67
DISCUSSION
In this study, we demonstrated that monitoring changes in tumor glucose utilization by small-animal PET/CT using 18F-FDG after therapy differentiated trastuzumab-responding and -nonresponding human BC xenografts in athymic mice. Tumor uptake of 18F-FDG measured by VOI analysis was reduced by 43% in athymic mice bearing trastuzumab-sensitive and HER2-overexpressing MDA-MB-361 xenografts, compared with PBS-treated controls (P < 0.03; Fig. 3A). Similar results were observed by biodistribution studies, in which a 60% reduction in tumor uptake of 18F-FDG was observed in mice with MDA-MB-361 tumors receiving trastuzumab, compared with control mice receiving PBS (P < 0.002; Fig. 3A). Furthermore, there was a significant 35% reduction in the tumor uptake of 18F-FDG in trastuzumab-treated mice, compared with baseline 18F-FDG uptake in these same mice evaluated before treatment (P = 0.01; Fig. 3A). This reduction in tumor accumulation of 18F-FDG correlated with the caliper-measured tumor response to trastuzumab. Significant inhibition of tumor growth was observed over the course of 16 d of trastuzumab therapy, compared with PBS-treated MDA-MB-361 xenografts, which doubled in size, resulting in a 30% reduction in tumor volume (P < 0.0005; Fig. 2A). In contrast, there was no reduction in uptake of 18F-FDG in nonresponding MDA-MB-231 xenografts in mice treated with trastuzumab (Fig. 3B). In accordance with the 18F-FDG PET results, no significant growth inhibition of MDA-MB-231 xenografts was observed during trastuzumab therapy, compared with PBS treatment of controls (Fig. 2B).
There was only a marginal difference in the average baseline tumor uptake of 18F-FDG in both xenografts (Figs. 3A and 3B), despite the significantly greater proliferation rate of the MDA-MB-231 xenografts shown by the tumor growth index (Figs. 2A and 2B) and Ki67 staining of explanted tissue (Figs. 6A and 6B). This discrepancy may be due to the large areas of necrosis evident in some of the MDA-MB-231 xenografts (Fig. 4C). Areas of necrosis would not be expected to accumulate 18F-FDG and, as a result, would lower the average tumor uptake of 18F-FDG (%ID/g). In contrast, the maximum baseline tumor uptake (%ID/gMAX) was significantly greater for the MDA-MB-231 xenografts than for the MDA-MB-361 xenografts (P = 0.01; Fig. 3C), consistent with regions of rapidly proliferating cells in the MDA-MB-231 tumors. In MDA-MB-361 xenografts, the similar maximum (%ID/gMAX) and average values demonstrate that uptake in these tumors was reasonably homogeneous, whereas the uptake in some of the MDA-MB-231 tumors was much higher at the periphery of the tumor (Fig. 4C). The average tumor uptake of 18F-FDG also decreased in the MDA-MB-231 xenografts over the 16-d therapy in both the PBS- and the trastuzumab-treated mice (Fig. 3B). This is possibly explained by the greater proportion of the MDA-MB-231 xenografts that became necrotic as the tumors grew larger, resulting in a decrease in the average %ID/g over the course of treatment. This observation demonstrates that average tumor uptake of 18F-FDG may not be representative of the proliferative capacity of a tumor if large areas of necrosis are present. In this case, the maximum tumor uptake may be a more powerful prognostic factor. Indeed, both average and maximum standardized uptake values are used clinically (26). Standardized uptake values are normalized for body weight, body surface area, or lean body mass (27). This correction is less critical for preclinical studies, because differences in body mass or surface area of mice are usually insignificant. In our study, differences in body mass between mice were negligible (22.3 ± 1.6 g). Furthermore, no correction was applied for differences in blood glucose levels, as fluctuations in blood glucose levels were minimal, and these corrections have not been shown to minimize variability in preclinical studies (28). Previous studies have reported the effects of fasting times, anesthetic agents, and blood glucose levels on the uptake of 18F-FDG in mice (23,28,29). To minimize variability, all mice were handled under the same fasting state, anesthetic agent, incubation time, and body temperature.
To date, no clinical studies have systematically evaluated the use of 18F-FDG PET for monitoring response to trastuzumab in HER2-positive BC; however, 2 case studies reported decreased tumor uptake of 18F-FDG in patients responding to trastuzumab in combination with vinorelbine and gemcitabine (20,21). Additionally, a small clinical study by Kawada et al. has shown that monitoring tumor glucose utilization by 18F-FDG PET may be predictive of response to lapatinib, a dual-kinase inhibitor of epidermal growth factor receptor and HER2 (19). These studies demonstrated that 18F-FDG PET could potentially be a powerful tool for monitoring response of tumors in patients to treatment with molecularly targeted therapies such as trastuzumab and selective tyrosine kinase inhibitors. Indeed, it has been proposed that 18F-FDG PET may provide an earlier indication of response and resistance than radiographic imaging, which relies on changes in tumor size. In the study by Kawada et al., changes in tumor uptake of 18F-FDG PET in the responding patient were apparent 2 mo before tumor progression was confirmed by CT (19). In contrast, a preclinical study by Shah et al. found no statistically significant changes in the tumor uptake of 18F-FDG in HER2-overexpressing BT-474 BC xenografts or mouse mammary tumor virus/HER2 tumors after 1–3 wk of trastuzumab therapy (30). Interestingly, in our study there was a 31% reduction in the tumor uptake of 18F-FDG in MDA-MB-361 HER2-overexpressing xenografts after 9 d of treatment; however, this difference was not statistically significant (P = 0.32; Fig. 3A). A significant decrease in tumor uptake of 18F-FDG was detected only after 16 d of treatment. Nevertheless, a significant difference in the volume of PBS- and trastuzumab-treated tumors was apparent after only 10 d of treatment (Fig. 2A). This difference suggests that the trastuzumab-mediated reduction in tumor uptake of 18F-FDG is likely due to a reduction in the total number of viable tumor cells, rather than decreased glucose utilization by individual cells. Thus, whereas 18F-FDG PET sensitively differentiated, after therapy, between trastuzumab-responsive and -resistant BC xenografts, it did not provide an earlier indication of response to trastuzumab than would anatomic changes measured using calipers. However, because of the lack of soft-tissue contrast, CT was not used to measure tumor volume in this study as is commonly performed clinically; therefore, comparison of the temporal sensitivity of 18F-FDG PET and CT for the detection of tumor response was not possible. Moreover, 18F-FDG PET was not performed between 9 and 16 d of treatment, and thus it is not known precisely when statistically significant changes could have been detected during this particular time interval.
In this study, expression levels of HER2 and Ki67 were examined in explanted tumor tissue from PBS- and trastuzumab-treated mice. HER2 expression levels previously measured in saturation radioligand binding assays using 111In-labeled trastuzumab (24) corresponded well with in vitro flow cytometry analysis of the cell lines. Immunohistochemical analysis of explanted tumor tissue showed that the MDA-MB-361 xenografts overexpressed HER2, which appeared to be reduced by approximately 65% in trastuzumab-treated xenografts, compared with PBS-treated controls (P = 0.08); however, few viable cells were available for analysis in trastuzumab-treated xenografts. Immunohistochemical analysis of MDA-MB-231 xenografts confirmed that these tumors were negative for HER2, and the expression was unchanged after trastuzumab treatment. Staining of the proliferation marker Ki67 was in agreement with the growth index and maximum 18F-FDG accumulation of the tumors. In the MDA-MB-361 tumors, 20% ± 10% of the cells were positive for Ki67 expression and these tumors demonstrated modest growth, resulting in a 2-fold increase in the tumor volume of PBS-treated mice and a maximum uptake of 18F-FDG of 6.2–8.8 %ID/gMAX over the course of therapy. In the MDA-MB-231 xenografts, a greater proportion of cells were positive for Ki67 expression (85% ± 7%), which was reflected in the 5-fold increase in the tumor volume of PBS-treated control mice over 16 d and maximum tumor uptake of 18F-FDG of 10.2–12.2 %ID/gMAX. These results suggest that tumor uptake of 18F-FDG is reflective of the level of proliferation of the tumor. Clinical studies have also found a positive correlation between Ki67 staining and uptake of 18F-FDG in BC (31–34), although this relationship is not well defined for lobular carcinoma, which has lower uptake of 18F-FDG than does ductal carcinoma (31–33,35). Clinically, most data suggest there is no relationship between HER2 expression evaluated by immunohistochemical staining and tumor uptake of 18F-FDG (32–34,36). Only Ueda et al. found a positive correlation between expression of HER2 and tumor uptake of 18F-FDG (35). Our results are consistent with these reports in that MDA-MB-231 xenografts with low HER2 density had higher uptake of 18F-FDG than did MDA-MB-361 xenografts, which overexpress HER2.
Although this study provides proof of principle that 18F-FDG can differentiate after therapy between trastuzumab-responsive and -resistant BC xenografts, the sensitivity of 18F-FDG PET for tumors that are only partially responsive to trastuzumab or those that acquire resistance is unknown and warrants further investigation. Furthermore, other molecular imaging agents may also be useful for monitoring response to trastuzumab. In a previous study, we have shown that HER2 downregulation—one of the proposed mechanisms of action of trastuzumab—could be sensitively detected by micro-SPECT/CT using 111In-DTPA-pertuzumab after only 3 d of trastuzumab therapy in MDA-MB-361 xenografts (22). Furthermore, changes in tumor uptake of 111In-DTPA-pertuzumab were informative on the decreased viability of tumor cells after 3 wk of trastuzumab therapy. Additionally, 3′-deoxy-3′-18F-fluorothymidine, which accumulates in tumors in proportion to their proliferative properties and has shown promise in identifying early responding and nonresponding tumors in patients receiving chemotherapy, may be useful for monitoring response to trastuzumab (30,37).
CONCLUSION
Changes in tumor uptake of 18F-FDG after therapy accurately differentiate responding and nonresponding human BC xenografts in athymic mice treated with trastuzumab. 18F-FDG PET for monitoring response to trastuzumab therapy warrants further investigation to determine whether changes in tumor uptake of 18F-FDG may occur before anatomic changes measured by radiographic imaging and if such imaging can detect the emergence of trastuzumab resistance in previously responsive tumors.
Acknowledgments
We thank Lisa DiDiodato and Rick Clarkson for performing the micro-CT imaging. This research was supported by grants from the Ontario Institute of Cancer Research (grant 03-NOV-0428 and the 1 mm Cancer Challenge), with funds from the Province of Ontario. Kristin McLarty is the recipient of the MDS Nordion Graduate Scholarship in Radiopharmaceutical Sciences, the Mitchell Graduate Scholarship for Cancer Research, an Ontario Graduate Scholarship, and a Canadian Institutes of Health Research (CIHR) Frederick Banting and Charles Best Canadian Graduate Scholarship and is a CIHR Strategic Training Fellow in the Excellence in Radiation Research for the 21st Century (EIRR21) Program.
Footnotes
-
COPYRIGHT © 2009 by the Society of Nuclear Medicine, Inc.
References
- Received for publication June 11, 2009.
- Accepted for publication August 11, 2009.


Jump to section
Related Articles
Cited By...
- Imaging Diagnostic and Therapeutic Targets: Human Epidermal Growth Factor Receptor 2
- Optical Metabolic Imaging Identifies Glycolytic Levels, Subtypes, and Early-Treatment Response in Breast Cancer
- Repeatability of 18F-FDG Uptake Measurements in Tumors: A Metaanalysis
- Evaluation of Mouse Tail-Vein Injections Both Qualitatively and Quantitatively on Small-Animal PET Tail Scans