


Abstract
The importance of 18F-FDG PET in imaging head and neck squamous cell carcinoma (HNSCC) has grown in recent decades. Because PET has prognostic values, and provides functional and molecular information in HNSCC, the genetic and biologic backgrounds associated with PET parameters are of great interest. Here, as a systems biology approach, we aimed to investigate gene networks associated with tumor metabolism and their biologic function using RNA sequence and 18F-FDG PET data. Methods: Using RNA sequence data of HNSCC downloaded from The Cancer Genome Atlas data portal, we constructed a gene coexpression network. PET parameters including lesion–to–blood-pool ratio, metabolic tumor volume, and tumor lesion glycolysis were calculated. The Pearson correlation test was performed between module eigengene—the first principal component of modules’ expression profile—and the PET parameters. The significantly correlated module was functionally annotated with gene ontology terms, and its hub genes were identified. Survival analysis of the significantly correlated module was performed. Results: We identified 9 coexpression network modules from the preprocessed RNA sequence data. A network module was significantly correlated with total lesion glycolysis as well as maximum and mean 18F-FDG uptake. The expression profiles of hub genes of the network were inversely correlated with 18F-FDG uptake. The significantly annotated gene ontology terms of the module were associated with immune cell activation and aggregation. The module demonstrated significant association with overall survival, and the group with higher module eigengene showed better survival than the other groups with statistical significance (P = 0.022). Conclusion: We showed that a gene network that accounts for immune cell microenvironment was associated with 18F-FDG uptake as well as prognosis in HNSCC. Our result supports the idea that competition for glucose between cancer cell and immune cell plays an important role in cancer progression associated with hypermetabolic features. In the future, PET parameters could be used as a surrogate marker of HNSCC for estimating molecular status of immune cell microenvironment.
- head and neck squamous cell carcinoma
- positron emission tomography
- next generation sequencing
- tumor microenvironment
Currently, 18F-FDG PET is widely used for staging and monitoring treatment response in head and neck squamous cell carcinoma (HNSCC) (1). It can be used as an imaging biomarker providing functional and molecular information such as metabolism, hypoxia, and proliferation (2). Clinically, 18F-FDG PET plays a great role in HNSCC because of its high accuracy for staging and its prognostic value (3). Several PET parameters such as maximum SUV, metabolic tumor volume (MTV), and total lesion glycolysis (TLG) have been used for prognostic quantitative markers (4–6).
HNSCC is highly heterogeneous in terms of genetic and molecular pathogenesis (7). It has hampered the development of new therapeutic strategies and the improvement of survival in recent decades. Therefore, understandings of the biologic and genetic background of HNSCC, which could lead to improved tailoring of treatment modalities, have received attention in the era of the precision medicine. As PET provides biologic information in vivo, previous literatures have demonstrated the significant correlation between gene expression profiles and the PET parameters (8–10). However, these genetic profiles have focused only on individual genes and not considered fully the systemic property. Because it is more evident that biologic processes are derived from various interactions between many cellular components, systemic gene network analysis could provide more information about carcinogenesis and therapeutic intervention (11). To evaluate the systemic gene network of HNSCC associated with in vivo metabolic characteristics identified by PET, we used weighted gene coexpression network analysis (WGCNA) in this study. The WGCNA algorithm takes into account the correlation between 2 genes as well as the degree of similarity between a pair of genes in their correlation structure within the rest of the network, so that it captures a systems perspective of genetic network (12).
The aims of this study were to apply systems biology analysis using RNA sequencing (RNA-seq) data of HNSCC and corresponding 18F-FDG PET images, and to identify and define a gene coexpression network that significantly correlated with tumor metabolism. We identified the sole network module showing high correlation with 18F-FDG uptake, and it accounted for the function associated with immune cell microenvironment. From the perspective of gene network, we could define the major systemic genetic background of tumor metabolic feature.
MATERIALS AND METHODS
WGCNA
We used RNA-seq data publicly available in The Cancer Genome Atlas (TCGA) (13). Detailed RNA-seq data preprocessing is described in the supplemental materials (available at http://jnm.snmjournals.org). Using the WGCNA R/Bioconductor package (12), we constructed weighted gene coexpression networks from the preprocessed RNA-seq data. We created a correlation matrix on the basis of the Pearson correlation coefficient for all pairwise genes across all samples. The power—the key parameter for weighted network—was selected to optimize both the scale-free topology and the sufficient node connectivity, and we chose a threshold of 6 in this study. The correlation matrix was transformed into adjacency matrix (matrix of connection strength) using the power function, and pairwise topologic overlap between genes was calculated. We identified network modules using the hierarchical clustering method with topologic overlap dissimilarity as the distance measure (12). The modules were detected by the dynamic tree cut algorithm in the WGCNA package (14), defining a height cutoff value of 0.99, deep split as 2, and a minimum module size cutoff value of 50. Genes that were not assigned to any module were classified to the color gray.
18F-FDG PET/CT Data and Image Processing
In this study, we used 18F-FDG PET/CT data provided by The Cancer Imaging Archive (15,16). We identified 23 patients who had both genetic and 18F-FDG PET data available. 18F-FDG PET/CT images were acquired according to the standard imaging protocol of each institute. Patients were administered 18F-FDG (6.45 MBq/kg [range, 2.53–12.6 MBq]), and images were acquired 60 min after administration. PET data were reconstructed by an iterative algorithm (ordered-subset expectation maximization). The acquisition and reconstruction parameters such as matrix size were different according to the imaging protocol of institute.
Patient data were acquired by a publicly available dataset that removed patient identifiers. The publicly available data were collected with patients’ informed consent approved by the institutional review boards of all participating institutions following the 1964 Helsinki declaration and its later amendments or comparable ethical standards.
To obtain PET imaging parameters, semiautomated quantitative analyses were performed. First, a primary cancer lesion was identified and its SUVmax was obtained. Metabolically active tumor was segmented by a threshold value of 40% of SUVmax. The volume of segmented lesion was measured (MTV). As acquisition and reconstruction parameters were different, SUVs were corrected by blood-pool activity. A manually drawn spheric volume of interest on the ascending aorta was used to measure blood-pool activity. SUVs of the lesion were divided by SUVmean of the blood pool, which produced a lesion–to–blood-pool ratio (LBR). Because The Cancer Imaging Archive data were obtained from multiple centers, SUV interchangeability may be limited. To overcome this issue, we used LBR as a parameter for 18F-FDG uptake. For quantitative analyses, maximum LBR and mean LBR were used as representative parameters of each tumor. Corrected TLG value of a lesion was calculated as mean LBR × MTV, which reflects both the metabolic activity and the tumor burden. Image parameters were obtained using the Metavol package (17).
Correlation Test Between Network Modules and PET Parameters
RNA-seq data of 23 samples were preprocessed to conduct a correlation test. To summarize the module expression profile for the correlation test, we calculated the module eigengene (ME), the first principal component of the expression matrix of the corresponding module, for the representation of each network module. The Pearson correlation test was performed to evaluate associations between each PET parameter and the ME of each network module. The modules with a P value under 0.05 were considered significantly correlated modules. To estimate robustness of the correlation between PET parameters and the ME, we estimated confidence intervals of the correlation coefficient using the nonparametric jackknife method. The Pearson correlation was repeatedly estimated in resampled data with a sample removed. The gene ontology biologic process terms were annotated for significantly correlated network module (supplemental materials).
Identification of Hub Genes of Significantly Correlated Module
We calculated gene module membership by testing the correlation between the individual gene’s expression profile and the ME of its assigned module. Because genes with high gene module membership also demonstrate high intramodular connectivity in the network module, we considered genes with high gene module membership as hub genes of the respective module (12). In addition, a trend of the association between hub genes and PET parameters was investigated. We performed the Pearson correlation test between PET parameters and gene expression values of the top 20 hub genes of the significantly correlated module.
Cell Types Enrichment Analysis
To evaluate the relationship between cell types of tumor tissues and PET parameters, we conducted cell type enrichment analysis using xCell (18). The xCell is a gene-signature–based method for inferring cell types of tissue transcriptome profiles. The composite scores of microenvironment score (the sum of immune and stromal cells) and immune scores (the sum of immune cells) were also obtained. The normalized messenger RNA expression data of HNSCC were entered into the xCell tool. Enrichment scores for various cell types were obtained and correlated with PET parameters using the Pearson method.
Survival Analysis and Identification of Network Modules Related to Tumor Stage
The relationship between PET parameter–correlated network modules and patients’ overall survival was analyzed using the Cox proportional hazards model. A continuous ME value of the selected module was used as an input for the Cox model. Additionally, the subjects were divided into tertiles according to the ME value, each containing a third of all subjects. Kaplan–Meier survival curves were depicted to compare overall survival among these 3 groups. The statistical significance was tested by the log-rank test. We also tested whether network modules were associated with tumor stage. The effects of different tumor stages on MEs were compared using 1-way ANOVA.
RESULTS
The preprocessed RNA-seq data consisted of 5,827 genes from 490 HNSCC samples. The clinical and pathologic characteristics of the preprocessed data are described in Table 1. Using WGCNA, we identified 9 coexpression network modules (Fig. 1).
Demographic and Baseline Clinical Characteristics of Preprocessed Data

Gene coexpression network module identification using WGCNA. Clustering dendrogram of genes of preprocessed RNA-seq data from 490 HNSCC samples is presented. In dendrogram, each leaf (short vertical line) corresponds to single gene, and each branch is coexpression module consisting of highly interconnected genes. Below dendrogram, module colors are displayed together. Total of 9 coexpression network modules were identified, except gray color, representing genes not assigned to any module.
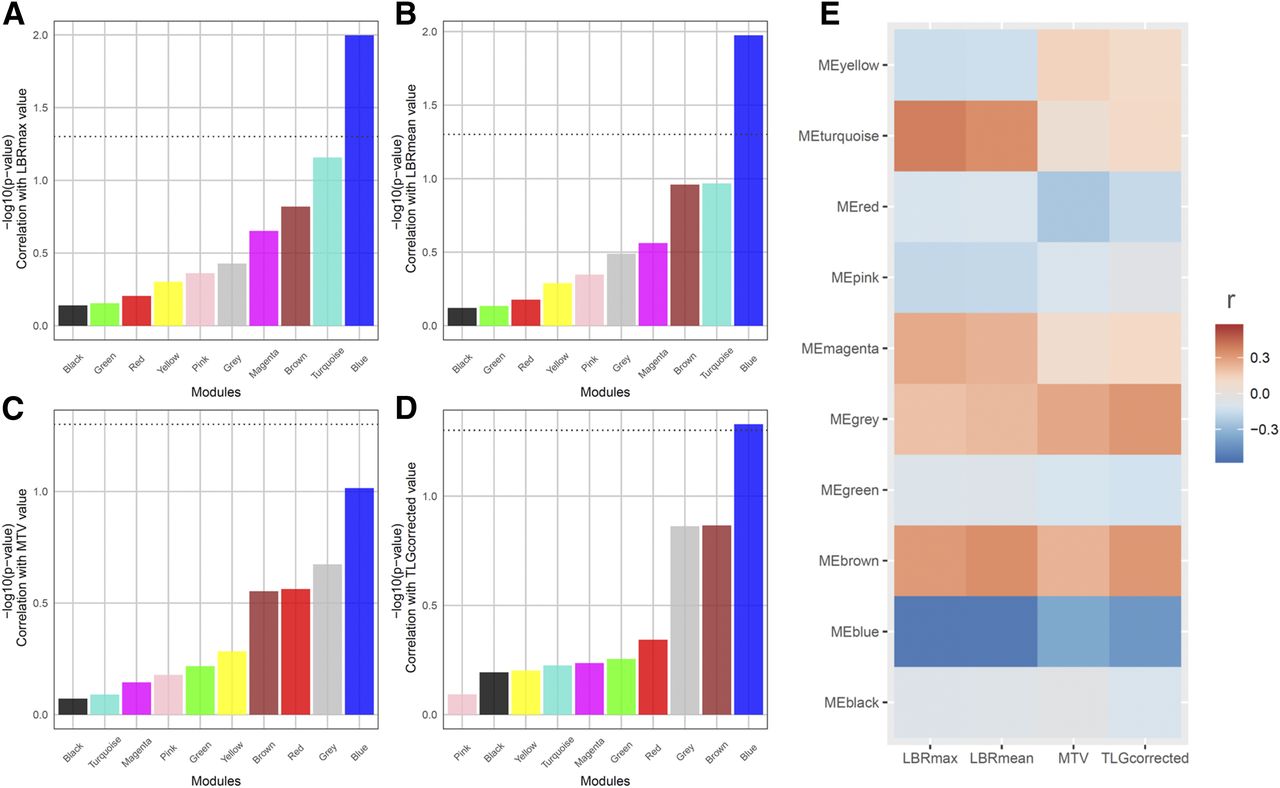
The Pearson correlation test demonstrated that only the blue module was significantly associated with maximum LBR (P = 0.010, r = −0.52; 95% confidence interval, −0.46 to −0.58), mean LBR (P = 0.012, r = −0.52; 95% confidence interval, −0.51 to −0.58), and corrected TLG value (P = 0.025, r = −0.47; 95% confidence interval, −0.41 to −0.53). There was no module significantly associated with MTV (Fig. 2). The association between each PET parameter and MEs of the blue module is shown in Figures 3A, 3B, and 3C, and the network of the blue module is presented in Figure 3D (Supplemental Fig. 1, high-resolution image). There was not a significant effect of tumor stage on the blue module (F = 1.85, P = 0.14), whereas the other 3 modules (brown, red, and pink) showed a trend of association between tumor stage and MEs (Supplemental Fig. 2).

Correlation test between coexpression network modules and PET parameters. (A–D) P value of correlation test was shown with bar plot. Dotted line represents statistical significance (P = 0.05). Only blue module was significantly correlated with maximum LBR (A), mean LBR (B), and corrected TLG (D). There was no module significantly correlated with MTV (C). (E) Heat map generated with Pearson correlation coefficients demonstrated that blue module exhibited negative correlation with all PET parameters. Color scale indicates degree of correlation. LBRmax = maximum lesion–to–blood-pool ratio; LBRmean = mean lesion–to–blood-pool ratio; TLGcorrected = corrected TLG.

18F-FDG uptake–related module and its hub genes. (A–C) Scatterplots show association between ME of blue module and each PET parameter, maximum LBR (LBRmax) (P = 0.010, r = −0.52) (A), mean LBR (LBRmean) (P = 0.012, r = −0.52) (B), and corrected TLG (TLGcorrected) (P = 0.025, r = −0.47) (C). (D) Coexpression network of blue module was visualized. Note that 300 genes among 666 genes of blue module and their connections were shown. (E) Heat map generated with Pearson correlation coefficients between 20 hub genes of blue module and PET parameters. y-axis represents gene symbols, and color scale indicates degree of correlation.
The blue module was functionally annotated with gene onotology biologic process terms. The top 10 significantly enriched terms are shown in Table 2. These terms were mostly associated with immune cell activation and aggregation. We selected 20 hub genes in order of high gene module membership from the blue module to evaluate the trend of correlation between genes’ expression profiles and PET parameters. The selected hub genes were NCKAP1 L, CD53, SASH3, DOCK2, PTRPC, TNFRSF1B, CD4, MYO1F, IL10RA, EVI2B, SELPLG, FERMT3, IKZF1, IRF8, LCP2, WAS, ABI3, GIMAP4, SPI1, and CYBB. All hub genes showed significant negative correlation with 18F-FDG uptake parameters (maximum and mean LBR), although most of them showed no significant correlation with MTV and corrected TLG value (Fig. 3E).
Top 10 GO Biologic Process Terms of Blue Module
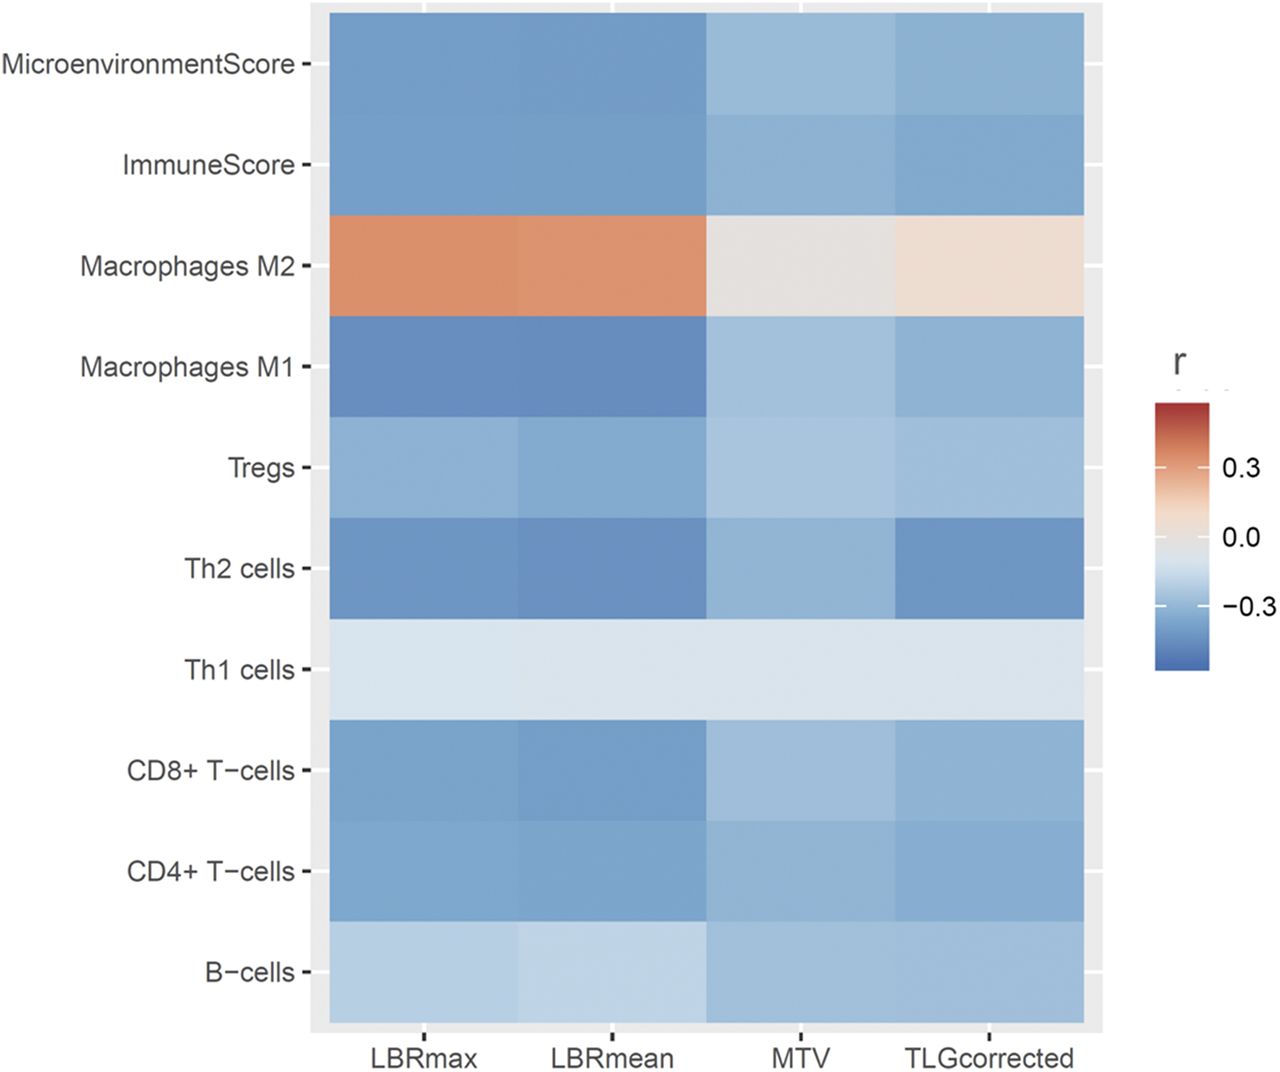
The relationship between 18F-FDG uptake and cell type enrichment in the tumor was evaluated. The maximum and mean LBR were negatively correlated with enrichment scores of CD8+ T cells, Th2 cells, and M1 macrophage. The composite scores, microenvironment, and immune score were also negatively correlated with the 18F-FDG uptake parameters. Conversely, the M2 macrophage enrichment score was positively correlated with the 18F-FDG uptake parameters (Fig. 4).

Relationship between 18F-FDG uptake and cell type enrichment in tumor cells. Heat map generated with Pearson correlation coefficients between PET parameters and enrichment scores for various cell types, microenvironment scores, and immune scores obtained with xCell. y-axis represents enrichment scores, and color scale indicates degree of correlation. Most scores showed negative correlation with PET parameters; however, M2 macrophage showed positive correlation with PET parameters.
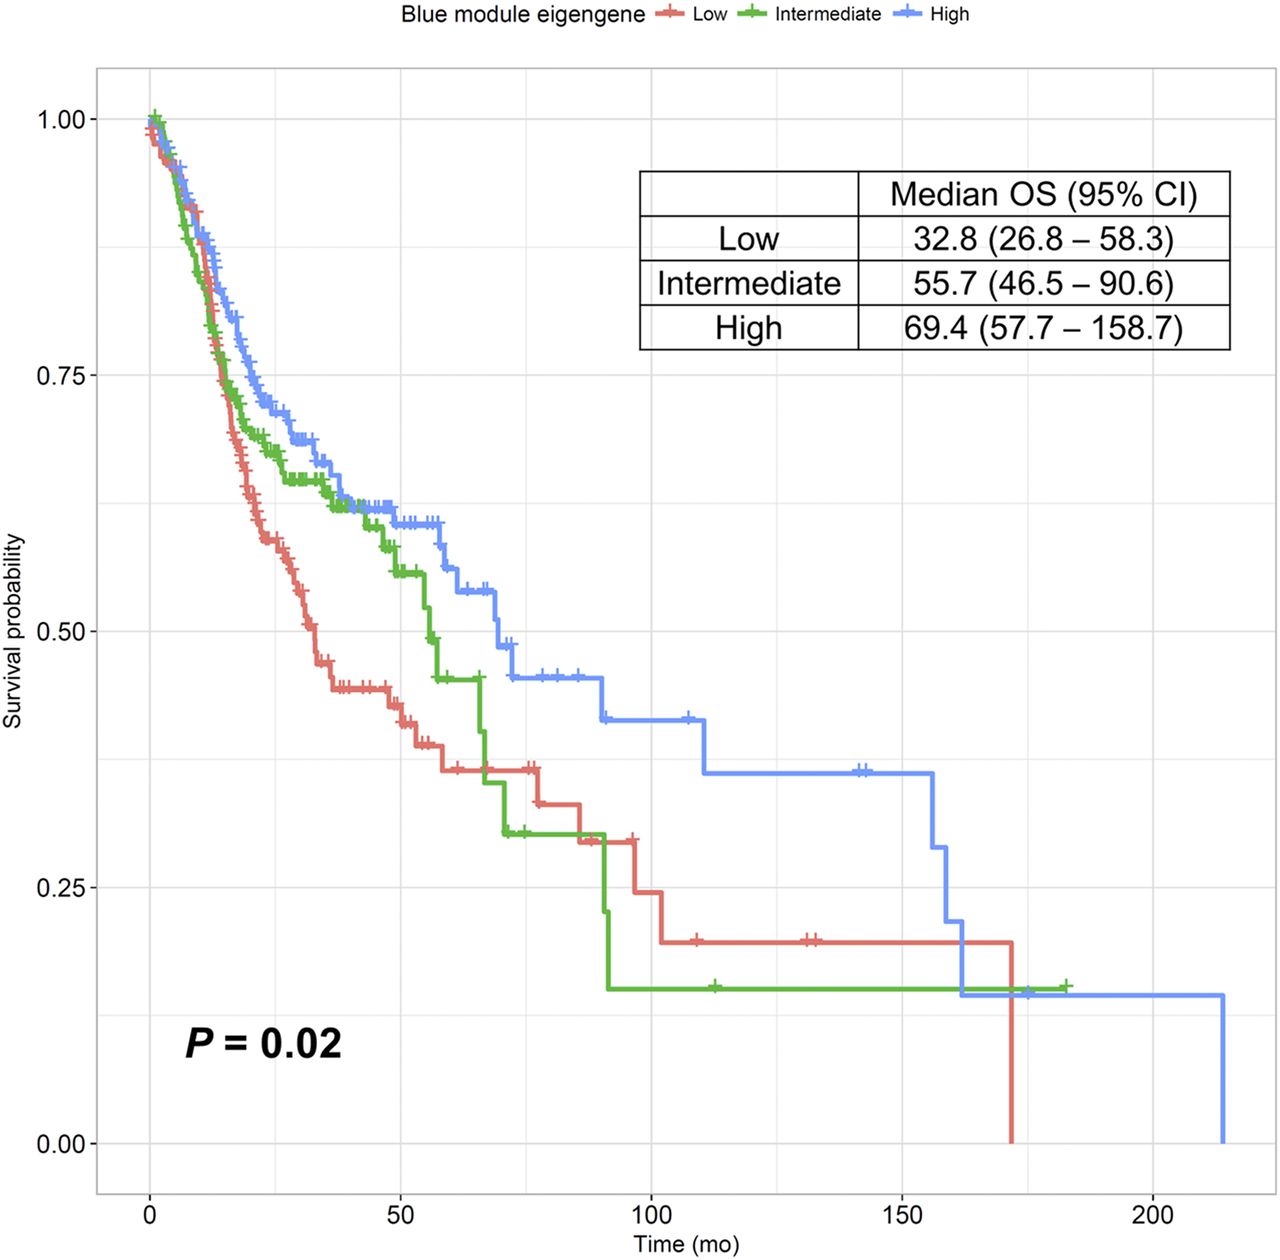
We evaluated the association between the blue module and patients’ prognoses. The univariate Cox analysis demonstrated that the ME of the blue module was significantly correlated with patients’ overall survival (P = 0.021). Figure 5 shows a Kaplan–Meier survival curve for the patient groups, and the group with high ME showed significantly better survival than the other groups (P = 0.022).

Kaplan–Meier survival curve for overall survival. Subjects were divided into tertiles of ME value of blue module to compare overall survival between groups. Group with high ME had significantly better survival than the 2 other groups (P = 0.022).
DISCUSSION
In this study, we used a systems biology approach, applying WGCNA to identify transcriptomic correlates of metabolic features in HNSCC. A significant gene network module correlated with 18F-FDG uptake represented the immune cell microenvironment of the tumor. Furthermore, the module was associated with patients’ survival. Until now, molecular backgrounds of tumor metabolism identified by 18F-FDG PET have not been fully understood, especially in terms of the systemic property of genes. Gene expression analyses combined with in vivo imaging studies have reported that expression level of various genes such as glucose transporters or tumor hypoxia–related genes were closely associated with 18F-FDG uptake in HNSCC (8–10). However, because of complicated functional gene–gene interactions, cancer phenotypes including metabolic features are dependent on systemic variation of gene expression rather than some individual genes (19). We successfully captured a gene network module associated with 18F-FDG uptake in HNSCC.
Our results demonstrated that a tumor metabolism–associated module represented immune cell activation and aggregation. Most cancer lesions are hypermetabolic and demand a high level of glucose, which has long been known as the Warburg effect. The underlying mechanisms of cancer hypermetabolism are complex and depend on several biologic and molecular factors. They include glucose metabolic pathway enzymes and glucose transporter system as well as cellular factors such as cancer cell differentiation (20). Despite the well-known individual molecular causality of tumor hypermetabolism, it has been hard to know the most important factor for tumor metabolism identified by 18F-FDG PET because of the complexity of molecular interactions and networks. Our results of a gene network related to 18F-FDG uptake could shed new light on an importance of immune cell activation and aggregation in tumor metabolism, particularly for HNSCC.
We found that tumor glucose uptake was inversely correlated with a network module accounting for immune cell activations in HNSCC. At first glance, this inverse correlation might be inconsistent with the fact that activated immune cells consume more glucose (21). However, recent studies have revealed that cancer metabolism is affected by various cellular processes in the cancer microenvironment (14,22). In particular, tumor cells are known to escape immunity by controlling the microenvironment. One of the most important mechanisms of immune escape is nutrient competition in the tumor microenvironment between cancer cells and T cells (23). Our results also supported this idea of metabolic competition for immunosuppressive microenvironment in aggressive cancer. Gene expression profiles of hub genes of the 18F-FDG uptake–related module were inversely correlated with LBR. This finding suggested that suppression of genes related to immune cell activation and aggregation could be due to relative glucose starvation of immune cells in a tumor microenvironment caused by cancer cell hypermetabolism. Furthermore, we found the negative correlation between immune cell type enrichment and glucose metabolism. Specifically, a CD8+ T cell in a tumor microenvironment was negatively correlated with 18F-FDG uptake in our results. Of note, CD8+ T cell is regarded as a key player of cancer immunity, and its abundance is a positive prognostic marker (24). Glucose metabolism was also negatively correlated with M1 macrophage whereas it was positively correlated with M2 macrophage. Macrophages contribute to immune evasion mediated by reducing the cytotoxic M1 macrophage and inducing M2 macrophages, which have a role in immune suppression through the production of IL-10 and TGF-β (25). Our results implied that hypermetabolic HNSCC was associated with microenvironment appropriated for immune evasion contributed by T cells and macrophages. The idea of metabolic competition between cancer cells and immune cells has been also supported by in vitro and in vivo studies. A study showed that tumor glucose metabolism was negatively correlated with tumor-infiltrating T cells in squamous cell carcinoma (26). That finding was consistent with our result of negative correlation between CD8+ T cells and 18F-FDG uptake. The study also showed that the low immunotherapy responsiveness was associated with higher glycolysis and low tumor-infiltrating T cells (26). According to these results, a clinical study regarding the relationship between immunotherapy responsiveness and pretreatment 18F-FDG uptake will be promising.
The module correlated with 18F-FDG uptake was also associated with prognosis. We found that hypermetabolism was negatively correlated with the ME of the blue module. Patients with low blue ME showed poor prognosis compared with those with high blue ME. To recapitulate the results, cancer hypermetabolism could affect the suppression of the gene network accounting for immune cell activation and aggregation in a microenvironment. This relationship could provide important clinical information in recent cancer immunotherapy such as anti–PD-1 therapy (27). Glucose limitation in tumor-infiltrating T cells caused by competition with cancer cells leads to increased expression of PD-1, which mediates immunosuppression (28). In addition, increased PD-1 functionally inhibits glycolysis as well (28,29). The close association between PD-1 and T cell metabolic reprogramming in a tumor microenvironment induces tumor aggressiveness by exhausting T cells, and increased PD-1 can be eventually associated with prognosis (30,31). In this regard, metabolic characteristics measured by 18F-FDG PET could be used as a surrogate marker for immune cellular status for monitoring the response of cancer immunotherapy. Because PD-1 inhibition increases glucose metabolism of immune cells and reduces cancer cell metabolism (23,29), 18F-FDG uptake could be used for early treatment response evaluation. Recently, several studies showed the feasibility of applying 18F-FDG PET in lung cancer patients as a tool for early response monitoring of immunotherapy (32,33). A recent finding of increased 18F-FDG uptake in lymphoid tissue associated with immunotherapy response could also support the feasibility of 18F-FDG PET as a valuable biomarker for response monitoring based on the mechanism of competitive 18F-FDG uptake between immune cells and cancer cells (34).
This study has some limitations. First, the design of this study was retrospective and WGCNA was performed using public data, including small samples with both 18F-FDG PET and RNA-seq data. The intrinsic limitations of the coexpression network approach are that the dataset has to be large and contain a good proportion of genes with significant signals to obtain robust and reproducible results of the coexpression network computed by correlation between each pair of genes. Although we successfully found a tumor metabolism–related module and its biologic function, further study with a well-controlled prospective design is warranted. Second, PET images were acquired by multiple centers, limiting the acquisition of interchangeable and precise PET parameters. Because we used the TCGA and The Cancer Imaging Archive database, it was an inevitable limitation as a study based on publicly available data. To overcome this limitation, we used the normalized PET parameter LBR, rather than SUV, to correct factors affecting PET parameters such as reconstruction. As a future study, standardized PET images across multiple centers will be a prerequisite for developing precise PET biomarkers reflecting gene networks. Third, as an intrinsic limitation of the correlation analysis, our findings of a relationship between PET parameters and gene networks hardly explain causality. In vitro and preclinical models will be needed to support the idea whether hypermetabolic cancer cells suppress lymphocyte activation. Last, further study is needed for different types of cancer to identify whether the relationship between 18F-FDG uptake and the gene network accounting for tumor microenvironment is universal across multiple tumor types.
CONCLUSION
To our knowledge, the current study is the first study of a systems biology approach to evaluate gene networks associated with glucose metabolic features identified by 18F-FDG PET. A gene coexpression network module accounting for immune cell aggregation and activation function was significantly correlated with 18F-FDG uptake and prognosis, and expression level of its hub genes was negatively correlated with 18F-FDG uptake in the tumor. This link of gene network and in vivo imaging features sheds light on the understanding of tumor microenvironment related to the metabolic competition between cancer cell and immune cell. Hence, we suggest that PET parameters could be used as a surrogate biomarker for estimating systemic status of gene networks and tumor microenvironment in the future.
DISCLOSURE
No potential conflict of interest relevant to this article was reported.
Acknowledgments
The results here are in whole based on data generated by the TCGA Research Network: http://cancergenome.nih.gov/.
Footnotes
Published online Jun. 6, 2017.
- © 2018 by the Society of Nuclear Medicine and Molecular Imaging.
REFERENCES
- Received for publication April 2, 2017.
- Accepted for publication May 30, 2017.


Jump to section
Related Articles
Cited By...
- No citing articles found.