


Abstract
PET imaging is useful for evaluating locally advanced primary breast cancer. Expression of specific molecular markers in these cancers, such as estrogen receptor (ER), progesterone receptor (PR), and HER2 status, has direct prognostic and therapeutic implications in patient management. This study aimed to determine whether a relationship exists between tumor glucose use and important molecular markers in invasive breast cancer. For our purposes, tumor glucose use is quantified by the PET-derived parameter maximum standardized uptake value (SUV). Methods: Breast tumors from 36 patients were excised and examined histologically after PET. ER, PR, and HER2 status were determined for all lesions histopathologically. In addition, genomewide expression for a subset of 20 tumors was analyzed using the human genome U133A oligonucleotide microarray. Results: A significant association was found between estrogen ER status and lesion SUV. ER-negative tumors (n = 17; median SUV, 8.5) demonstrated a significantly higher maximum SUV than did ER-positive tumors (n = 19; median SUV, 4.0) (P < 0.001). No significant association existed between SUV and PR status, HER2/neu status, lymph node involvement, or tumor size. Unsupervised hierarchic clustering of the 20 genetically profiled cancers segregated tumor samples into 2 primary groups of 10 patients each, largely corresponding to ER status. Conclusion: In locally invasive primary breast cancer, ER-negative tumors display higher 18F-FDG uptake than ER-positive tumors. Microarray analysis confirms these data and identifies genes associated with increased glucose use as measured by PET. These genes significantly overlap those of a previously validated ER-status molecular phenotype. These preliminary data support a growing body of evidence that ER-positive and ER-negative breast cancers have distinct disease-specific patterns. Further validation prospectively and with larger numbers will be required to establish a robust molecular signature for metabolic uptake and patterns of aggressive behavior in advanced breast cancer.
Breast cancer is the most frequently diagnosed solid malignancy in women in the United States and the second most common cause of cancer-related mortality. It was estimated that 184,450 new cases of invasive breast cancer would be diagnosed in 2008 and that 40,930 patients would succumb to the disease (1). Given this disease burden, numerous imaging techniques and prognostic variables have been explored to detect, stage, monitor, and evaluate tumor response to therapy. Hormone receptor status, particularly estrogen receptor (ER) status, is an important pathologic disease prognosticator and thus is a standard marker for evaluating diagnostic and therapeutic tools (2).
PET imaging with 18F-FDG is an important noninvasive technique for evaluating malignancy, and the degree of 18F-FDG uptake in lung carcinoma, lymphoma, and esophageal carcinoma correlates well with validated prognostic markers (3). In breast cancer, however, attempts to correlate 18F-FDG uptake with known tumor markers have been frustrated by technical limitations, tumor heterogeneity, and the limited pool of candidate biomarkers (4–8). Newly available microarray technology and concurrent advances in imaging allow the relationship between breast tumor glucose metabolism and patient prognosis to be revisited.
Genomewide microarray analysis allows simultaneous measurement of thousands of messenger RNA species in a tumor sample. Such analyses help define breast cancer subtypes not previously visualized by traditional histopathology (9–12). Improved biologic tumor classification unmasks clinically distinct patient subsets with respect to intermediate- and long-term prognosis and the development of distant metastasis (13–16).
This study investigated the relationship between 18F-FDG uptake (maximum SUV) in invasive breast cancer and clinicopathologic variables (ER, PR, and HER2 status). A genomewide molecular profile of hormone receptor status and 18F-FDG uptake was also considered.
MATERIALS AND METHODS
Patient Characteristics
Patients were recruited as a subset of a larger trial of high-risk patients referred to the Memorial Sloan-Kettering Cancer Center for operative management of primary aggressive breast carcinoma. Eligibility criteria included either a tumor larger than 5 cm (T3) or clinically positive axillary lymph nodes (N1 or N2).
Thirty-six patients who presented between October 2001 and March 2004 for operative management of breast cancer at Memorial Sloan-Kettering Cancer Center were deemed eligible and agreed to participate. The study was approved by the Institutional Review Board. A physician explained the protocol, and participating patients gave written informed consent. Patients were recruited at the time of initial diagnosis. Patients with recurrent disease were excluded from this analysis. Of the 36 tumors analyzed, 33 were invasive ductal carcinomas and 3 were invasive lobular carcinomas.
In 20 patients, RNA was extracted for genomewide microarray analysis. Tumors in this subset included 18 invasive ductal and 2 invasive lobular carcinomas.
Technique of 18F-FDG Whole-Body PET
All patients fasted for at least 6 h before imaging, and the preexamination blood glucose level was measured. The patients were injected with 370–555 MBq (10–15 mCi) of pyrogen-free 18F-FDG. Imaging was performed 50–60 min later on an Advance (GE Healthcare) whole-body PET scanner in accordance with the Memorial Sloan-Kettering Cancer Center PET protocol (emission and transmission images were acquired for 4 min each per bed position; transmission data were used for attenuation correction in all cases). Beginning in 2002, studies were also acquired on combined PET/CT tomographs, either Biograph (Siemens/CTI) or Discovery LS (GE Healthcare). Both machines combine multislice CT with a PET tomograph. CT data were used for attenuation correction.
Image Analysis
All images were iteratively reconstructed using postemission transmission attenuation–corrected datasets. A standard region-of-interest analysis tool provided with the scanner was used to calculate the maximal 18F-FDG concentration within the primary tumor mass. Similarly sized large, circular regions of interest, ranging from 1,000 to 1,500 mm2, were drawn on transaxial images as previously described at our institution (17). Maximum SUVs were obtained by correcting for the injected dose and patient weight, again using the standard software tools. Only 18F-FDG uptake in the primary site was analyzed; partial-volume correction was not used. All microarray patient data were obtained after 2002 and therefore were obtained from either of the 2 PET/CT systems.
Histology and Microarray Gene Expression Analysis
Biopsy samples were obtained from the primary breast tumors in all patients, snap frozen, and subjected to standard immunohistologic techniques. Briefly, immunohistochemical detection was performed using streptavidin–biotin–peroxidase and microwave antigen retrieval methodology as previously described (18). We defined HER2 positivity as 3+ by immunohistochemistry, or 2+ by immunohistochemistry with gene amplification of 2.1 or greater. Amplification was measured by fluorescence in situ hybridization as previously described (19). ER and PR samples were considered positive if more than 10% of cell nuclei were immunoreactive. Semiquantitative analysis of ER expression was performed using whole sections obtained from the original paraffin-embedded tissue samples. Signal intensity was graded on a scale of 0–3. A final immunohistochemistry score was computed by multiplying the percentage of positive nuclei by the intensity.
Tissue was manually dissected from the frozen block to provide a consistent tumor cell content of more than 70%. RNA for microarray analysis was extracted from frozen tissues by homogenization in TRIzol reagent (GIBCO-BRL; Invitrogen Corp.) and was evaluated for integrity using denaturing agarose gel. Complementary DNA was synthesized from total RNA using a T7 promoter–tagged dT primer. RNA target was synthesized by in vitro transcription and was labeled with biotinylated nucleotides (Enzo Biochem). Labeled target was assessed by hybridization to Test3 arrays (Affymetrix). All gene expression analysis was performed using the Affymetrix U133A chip. The GeneChip human genome U133A array includes 14,500 well-characterized human genes. The hybridization conditions used were standards derived from the manufacturer with interlaboratory variation as previously described (20). Cluster analysis was performed using Gene-Spring 6.1 (Silicon Genetics).
Statistical Analysis
Signals were quantified using Affymetrix Microarray Analysis, version 5.0, and before the unsupervised analysis the gene expression measurements were filtered and normalized. Filtering and normalization were performed independently for each analysis. Two-way unsupervised hierarchic clustering was performed using the software R 2.3 (www.r-project.org). To cluster data, we used an uncentered standard correlation (Pearson correlation around zero) as our measure of similarity. In constructing dendograms, we used centroid linkage as the measure of proximity between clusters. Tumor subsets were formed on the basis of results if clustering and the distribution of extraneous variables (such as ER status) was compared between groups using the Fisher exact test. The correlation between gene expression values and SUV was determined using rank-based methods (Spearman rank correlation), and the genes were ranked according to the absolute value of this correlation. To evaluate the presence of statistically significant overlap to an independent gene list, we used the Fisher exact test to calculate the hypergeometric probability of overlap between a specified list and a random list. The resulting P value was adjusted with a Bonferroni multiple-testing correction. The difference in uptake between clinically defined groups was tested using the Wilcoxon rank-sum test. Our use of rank-based methods (Spearman correlation and Wilcoxon test) avoided undue influences from one outlying observation with a high SUV.
RESULTS
Increased Glucose Uptake in ER-Negative Primary Breast Cancer
Patients in this study were selected from a population with advanced operable breast cancer. With one exception, these tumors were grade III histologically (data not shown). Mean patient age was 50.4 y (range, 28–72 y) (Table 1). Of the 36 tumors analyzed, 33 were invasive ductal carcinomas and 3 were invasive lobular carcinomas. Twenty of these cancers were further scrutinized with microarray analysis.
A Select Subset of Genes That Most Correlated with Increased Tumor 18F-FDG Uptake
The average lesion was relatively large, with a mean size of 2.95 cm. Larger tumors tended to have more 18F-FDG accumulation than smaller tumors (Fig. 1A), but the correlation was weak (r = 0.36; P = 0.03). There was no significant association with SUV and PR status. The PR-positive median SUV was 6.8 (range, 3.6–12.7), versus a PR-negative median of 5.4 (range, 3.8–7.5) (P = 0.24). Similarly, the HER2/neu-positive median SUV was 5.7 (range, 3.6–15.3), versus a HER2-negative median SUV of 6.4, (range, 4–11.45) (P = 0.76) (Figs. 1B and 1D). Axillary lymph node status did not correlate with 18F-FDG uptake in the primary lesion (Fig. 1C). Again, because this population was selected for advanced disease, most patients had evidence of locoregional spread.

(A) 18F-FDG accumulation correlates weakly with tumor size. (B–D) Neither HER2 status (B), node status (C), nor PR status (D) correlates with maximum SUV. (E) Accumulation does correlate with ER status. Open circles denote tumor samples subjected to microarray analysis. Closed circles do not have gene profiles.
18F-FDG accumulation did in fact correlate with ER status, although there was a wide overlap between these groups. ER-negative tumors (n = 17; median SUV, 8.5; range, 4.1–15.3) had a significantly higher SUV than did ER-positive tumors (n = 19; median SUV, 4.0; range, 3.5–7.5) (P < 0.001) (Fig. 1E).
The ductal carcinomas appeared to exhibit greater 18F-FDG accumulation than did lobular tumors; however, the small number of lobular carcinomas precluded statistical comparison.
Because of limited statistical power, the various combinations of ER, PR, and node status subgroups were not further analyzed. We believed that the group numbers of the various combinations were too small to allow meaningful comparisons.
Contribution of SUV to Dominant Molecular Distinctions of Primary Breast Cancers
RNA was available for a representative subset of patients (Table 1). Using unsupervised hierarchic clustering of genomewide expression profiles, tumors were clustered into 2 groups of 10 (Fig. 2). Not surprisingly, a dominant feature affecting grouping was expression of the ER and ER-related genes (Fig. 2B). In group 1, 9 of 10 of the tumors were ER-positive by immunohistochemistry, whereas group 2 contained only ER-negative tumors (P < 0.001). Visual inspection of 2-dimensional hierarchic-clustering diagrams revealed that the first group was also characterized by expression of genes associated with the previously described “luminal” subtype of breast cancer (11). The second group was defined by a subcluster with gene expression resembling the “basal” subtype. Accordingly, this subcluster had relative overexpression of MASPIN and FOXC1, as well as of the basal cytokeratins KRT17, KRT6, and KRT5.
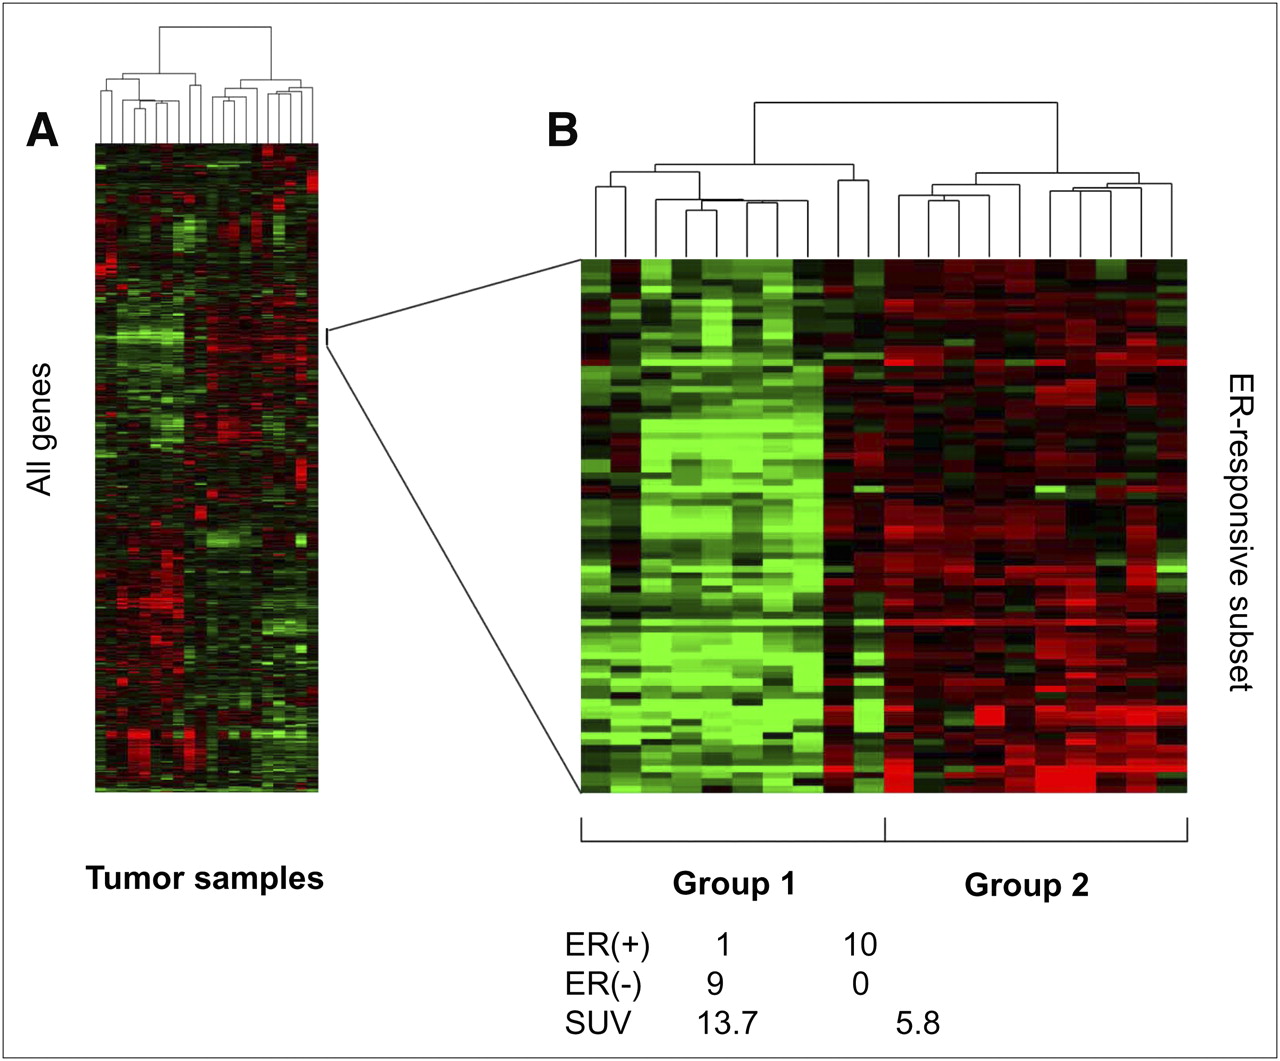
Twenty tumors clustered into 2 groups of 10 each on basis of genomewide expression profile. (A) Complete gene list. (B) ER and ER-related genes were main grouping discriminators.
Because of the association between SUV and ER status, we asked whether SUV was also associated with the molecular structure of primary breast cancer. Analysis of the primary tumor clusters revealed that the average SUV of group 1 was greater than that of group 2 (13.7 vs. 5.8, P = 0.035)
Taken together, these data provide preliminary evidence to suggest that SUV may be associated with the dominant molecular distinctions among primary breast cancer. The use of an independent validation set will be required to confirm this suggestion.
Correlation of Gene Expression and Glucose Uptake Among Primary Breast Cancers
Next, we used our dataset to identify specific genes associated with increased glucose use in these tumors. Using Spearman rank-based methods, we identified the 500 genes most correlated with increased 18F-FDG uptake (selected genes are depicted in Table 1; the entire list is presented in Data Supplement 1 [supplemental materials are available online only at http://jnm.snmjournals.org]). The selected genes in Table 1 include genes that segregate with poor prognosis and loss of the ER, such as orosomucoid, as well as genes that have implications in glucose metabolism, such as hexokinase and amino acid/glucose (SLC2A8) transporters (8,21–26). The final 2 genes in the list were reported as significantly correlating with 18F-FDG avidity in the only other known study evaluating microarray data in PET-identified breast cancer lesions (26).
These genes are the preliminary representation of an ongoing “training” set to identify the candidate genes associated with high SUV in breast cancer. We further subdivided the gene array into well-known glucose use genes present on our microarray platform, including hexokinase variants and glucose transporters. These genes generally demonstrated a low correlation and rank order (Data Supplement 2).
We then sought to determine whether there was overlap between this preliminary gene set and a validated gene set associated with ER status (Fig. 3). For this purpose, we selected an independent gene expression dataset of 99 primary breast cancers validated on the same Affymetrix U133A platform (27). There was a significant overlap between the ER status gene list and these 500 genes whose expression correlated with SUV (P < 0.001) (Data Supplement 3). Given this overlap, we hypothesize that the glucose use list may identify important genes for specific investigation as the sample size increases. On visual inspection of the top 100 genes, individual genes could be identified from the glycolytic pathway, amino acid transport, and cell cycle, but no obvious pattern of expression was identified.
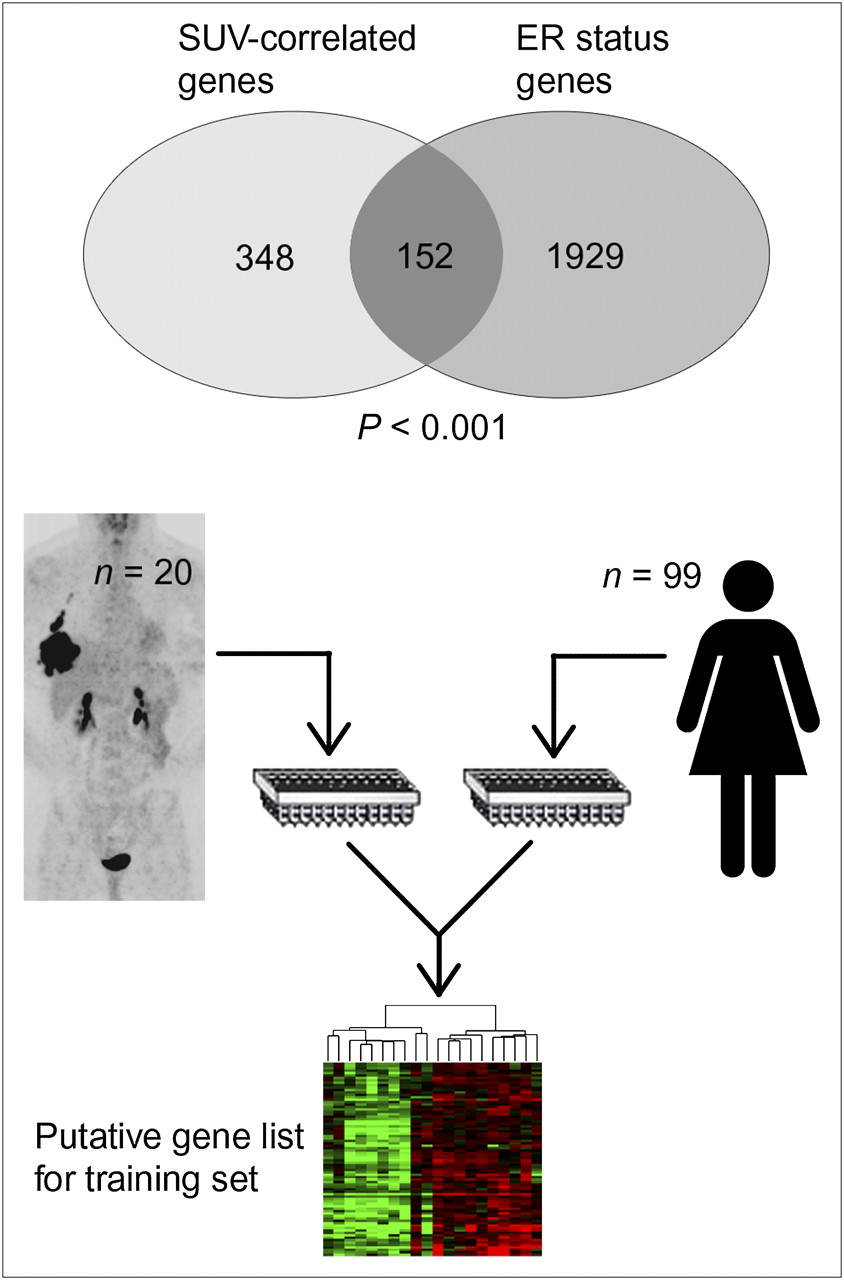
Overlap between validated ER status gene list (generated from tumor bank of 99 women) and the 500 genes whose expression most correlated with SUV from our sample of 20 tumors (P < 0.001).
DISCUSSION
The challenge of managing patients living with progressive breast cancer remains formidable (1). Developing effective noninvasive imaging is a priority in formulating treatment plans for over 2 million American women living with breast cancer. Preoperative 18F-FDG PET has demonstrated its value in providing single-examination disease staging and assessment of response to therapy (8,25,28,29). Microarray analysis of breast cancer contributes to patient prognosis and will continue to evolve with more years of clinical validation (16,30). The overlap between the 2 technologies extends our understanding of breast neoplasms and aids in the development of algorithms to manage these patients. These data include microarray analysis on 20 subjects that contributes to our understanding but requires validation in a much larger cohort to minimize well-known bias in genomewide studies.
ER Versus SUV
18F-FDG PET breast cancer analysis has been limited by a combination of tumor-specific and imaging factors. Compared with other tumor types, breast carcinomas are a heterogeneous species often with relatively low uptake (4–6,31–33), and as a result, there has been little consensus on detection sensitivity or specificity. In addition, the combination of poor first-generation PET scanner resolution and small tumor volume historically has degraded examination accuracy.
Prior attempts to correlate hormone receptor status with 18F-FDG uptake were plagued by confounding factors such as heterogeneous tumor size, grade, and sampling technique. In many seminal studies such as Crippa et al., median SUVs were used, which may have decreased the observed correlation (7,8,34). In addition, earlier studies included smaller, less advanced lesions, increasing partial-volume effects and likely including less aggressive disease. The study by Avril et al. (8), which is a careful examination of the link between SUV and histology, used mean SUV, a normalizing scale, and a significant proportion of small lesions, making a direct comparison unsatisfactory.
Using similar techniques, Mavi et al. demonstrated a link between ER status and SUV in 118 tumors (35). Similar to our results, PR and HER2/neu status did not correlate with 18F-FDG uptake. Cermik et al. further demonstrated that SUV also correlates with advanced local disease and distant metastasis, further validating this observed correlation in patients with locally advanced breast cancer (36). This significance, however, is relatively weak, with significant overlap of 18F-FDG uptake between ER-positive and ER-negative tumors.
Microarray
Microarray technology enables researchers to simultaneously assay the expression of several thousand genes. In breast cancer, this is an important adjunct to algorithms based on hormone receptor status. Microarray-generated data have the ability to predict patient prognosis with accuracy superior to older algorithms (30). Although many researchers have attempted to correlate breast cancer histologic markers with 18F-FDG uptake, there have been only preliminary attempts to correlate imaging criteria (26,37) with microarray gene data. Our effort demonstrates the correlation of unsupervised genetic clustering to locally advanced preoperative breast tumor glucose metabolism.
The attempt to correlate 18F-FDG PET uptake and gene expression in breast cancer has had preliminary success. To this end, Avril et al. collected data for the common histologic markers as well as glucose transporter 1 and MIB-1, whereas Crippa et al. investigated thymidine labeling index and p53 expression (6,7). Because no correlation was evident between ER status and SUV in these experiments, comparison to our results is limited. In addition, although isoforms of glucose transporter 1 and p53 are present in the microarray, there is no representative transcript for MIB-1. Comparing these results to prior immunohistochemical data on hexokinase II and glucose transporter genes proved difficult, because the transcript levels in genomewide analysis, protein levels in immunohistochemistry, and transport/enzymatic activity that can be inferred by PET lack a common statistically relevant platform. To this end, we sought other reports of microarray data and breast cancer PET.
The most similar microarray analysis was performed by Ueda et al. (26). This group examined preoperative breast tumors, but in patients with tumors of a lower stage and grade than in our sample. The genes that demonstrated the greatest upregulation between their “high-SUV” and “low-SUV” samples (CENP-F and CDC-6), however, did not show a significant correlation with SUV in our tumors. This discrepancy is likely due in part to the sample size and composition but also likely reflects significant differences in the composition of the genomewide Affymetrics array and the oncogene-specific IntelliGene Human Cancer CHIP array (version 4.0; Takara). As a result, these genes showed a relatively low rank (Fig. 3) in our SUV correlation scheme. Greater sample size, similar microarray platforms, and paired training and validation sets in the future will make differences in these approaches easier to reconcile.
Here, we present a preliminary investigation of a correlation between 18F-FDG uptake and molecular profiles of breast tumors. Unsupervised clustering segregates patients into 2 groups characterized by the dominant discriminator—the ER. Not surprisingly, there is a difference in the median SUV of these 2 groups (13.7 vs. 5.8, P = 0.035). Our gene list that correlates best with SUV in this population includes genes already known to participate in glucose metabolism. Because proliferation genes are one of the most important determinants of prognosis across microarray platforms, the theoretic links to lesion uptake on a PET scan have to be explored (16).
Investigations comparing microarray data and 18F-FDG uptake in breast carcinoma will likely find the greatest success when consensus methodologies or platforms are determined and the patients most at risk for incorrect stratification are clearly identified (16). Further investigations would likely include a high-throughput analysis across tumor types to validate a genetic signature of glucose metabolism to overcome the uncertainty inherent in both measures. Although a genetic signature is useful in a single tumor type, demonstrating common genes across neoplasms would create a better understanding of the pathways affecting tumoral 18F-FDG uptake and tumor metabolism. These findings could, in turn, have implications for therapeutic strategies. Furthermore, understanding these genes would help validate comparisons and development of novel tracers and specialty tracers such as 18F-fluoroestradiol (31,34,38,39).
As 18F-FDG PET has become widely available to oncologists, several investigators have attempted to correlate 18F-FDG uptake with specific gene expression. 18F-FDG uptake is a prognostic marker for a wide range of cancers such as non–small cell cancer of the lung, lymphoma, colon cancer, and pancreatic adenocarcinoma. For instance, in liver cancer, high 18F-FDG accumulation correlates with upregulation of genes involved in vascular cell adhesion, invasion, metastasis, and antitumor activity (40). In giant cell tumors, 18F-FDG accumulation shows a close association with the expression of genes related to angiogenesis and proliferation (such as vascular endothelial growth factor A and the cyclin Cdc2) (41). Finally, in breast cancer, many investigations have focused on the hormone receptor agonist 18F-fluoroestradiol for noninvasive assessment of ER expression. Relating 18F-FDG uptake to these tracers in the context of genomewide expression may create a context for understanding investigational tracers and assist in the development of new tracers. These studies, however, will need to be done on large series of patients with extensive clinical follow-up. Our present understanding of genomewide associations informs us that generating gene lists is only the first step in revealing insights into tumor biology or imaging.
CONCLUSION
Our study demonstrates that a relationship exists between lesion 18F-FDG uptake and ER status in preoperative advanced locoregional breast cancer. This finding suggests that increased glucose consumption can be linked to a specific genetic signature. Further validation of this preliminary gene set should lead to a greater understanding of whole-body quantitative 18F-FDG PET analysis and may add clinical value uncovering early characteristics of tumor aggressiveness. Future investigators need to determine how effective a tool 18F-FDG is in discriminating between receptor status and need to validate the findings in a larger series.
Acknowledgments
We dedicate this article to William Gerald, who is remembered for his outstanding scientific contributions as well as his dedication, warmth, and humility. We thank Dr. Monica Morrow, the chief of the breast surgery service at Memorial Sloan-Kettering Cancer Center, for providing helpful guidance in constructing the manuscript. This research was supported by P50-CA 86438-5 ICMIC (In Vivo Cellular Molecular Imaging Center) Young Investigator supplement NCI/CMBB and by NCI grant P01CA094060.
Footnotes
-
↵†Deceased.
-
COPYRIGHT © 2010 by the Society of Nuclear Medicine, Inc.
References
- Received for publication April 10, 2009.
- Accepted for publication December 10, 2009.


Jump to section
Related Articles
Cited By...
- 18F-FDG PET/CT for Systemic Staging of Newly Diagnosed Breast Cancer in Men
- Evaluation of the Usefulness of FDG-PET/CT for Nodal Staging of Breast Cancer
- Initial Results of a Prospective Clinical Trial of 18F-Fluciclovine PET/CT in Newly Diagnosed Invasive Ductal and Invasive Lobular Breast Cancers
- Src Inhibition Blocks c-Myc Translation and Glucose Metabolism to Prevent the Development of Breast Cancer
- Imaging Features of HER2 Overexpression in Breast Cancer: A Systematic Review and Meta-analysis
- Prognostic PET 18F-FDG Uptake Imaging Features Are Associated with Major Oncogenomic Alterations in Patients with Resected Non-Small Cell Lung Cancer
- Oestrogen-related tumour phenotype: positron emission tomography characterisation with 18F-FDG and 18F-FES