


Abstract
PET has the invaluable advantage of being intrinsically quantitative, enabling accurate measurements of tracer concentrations in vivo. In PET tumor imaging, indices characterizing tumor uptake, such as standardized uptake values, are becoming increasingly important, especially in the context of monitoring the response to therapy. However, when tracer uptake in small tumors is measured, large biases can be introduced by the partial-volume effect (PVE). The purposes of this article are to explain what PVE is and to describe its consequences in PET tumor imaging. The parameters on which PVE depends are reviewed. Actions that can be taken to reduce the errors attributable to PVE are described. Various PVE correction schemes are presented, and their applicability to PET tumor imaging is discussed.
PET has the potential to produce quantitatively accurate measurements of tracer concentrations in vivo. Thanks to PET/CT systems and fast iterative reconstruction, quantitative functional imaging has become a clinical reality. Large quantitative biases introduced by attenuation and, to a lesser extent, scatter can now be corrected for. However, quantitative biases of the same order as those caused by attenuation are introduced by the partial-volume effect (PVE). However, PVE is not routinely dealt with and is often overlooked, even in clinical research. As indices characterizing uptake, such as standardized uptake values (SUVs), become more widely used in PET to assist in the interpretation of the findings, more attention must be paid to PVE.
Understanding PVE is of foremost importance in the context of measuring the response to therapy with PET (1,2). Indeed, one of the most promising uses of PET is to quantify changes in tumor metabolism or physiology as a function of time. The hope is that the physiologic response of a tumor to therapy (e.g., by a change in the glucose metabolic rate) will become apparent long before gross changes in tumor size occur. Such information would potentially permit changing or eliminating a particular course of therapy depending on whether it was producing a change in metabolism. The consequences of such a test would be profound—for example, sparing patients from the potentially devastating effects of an ineffective course of chemotherapy or allowing an alternative therapy to be instituted. PET with 18F-FDG is highly reproducible (SD around 9%) (3). This fact would seem to make PET ideal for monitoring tumor therapy. Unfortunately, PVE can have a significant negative impact on the ability of PET to be used for this function.
We first describe what PVE is and its consequences in PET tumor imaging. We next present the parameters that affect the magnitude of PVE. Because there is currently no widely accepted solution for PVE correction, we review the different methods that have been proposed so far to reduce the errors attributable to PVE. The relevance of these solutions in the context of PET tumor imaging is discussed. Examples are provided to illustrate the potential impact of PVE correction in that context.
WHAT IS PVE?
The term “partial-volume effect”—somewhat of a misnomer—actually refers to 2 distinct phenomena that make intensity values in images differ from what they ideally should be. The first effect is the 3-dimensional (3D) image blurring introduced by the finite spatial resolution of the imaging system. The spatial resolution in PET images is limited by the detector design (by the pitch of the crystal in the axial direction, for instance) and by the reconstruction process (4). The resulting 3D blurring causes spillover between regions, as illustrated in 2 dimensions in Figure 1, although the effect is actually 3D. Because of the finite spatial resolution, the image of a small source is a larger but dimmer source. Part of the signal from the source “spills out” and hence is seen outside the actual source (Fig. 1). Mathematically speaking, the finite resolution effect is described by a 3D convolution operation. The image is formed by the convolution of the actual source with the 3D point spread function of the imaging system.

Circular source (diameter of 10 mm) of uniform activity (100 arbitrary units) in nonradioactive background yields measured image in which part of signal emanating from source is seen outside actual source. Maximum activity in measured image is reduced to 85.
The second phenomenon causing PVE is image sampling. In PET, the radiotracer distribution is sampled on a voxel grid. Obviously, the contours of the voxels do not match the actual contours of the tracer distribution. Most voxels therefore include different types of tissues. Figure 2 illustrates this effect in 2 dimensions, although again, it is actually a 3D effect. This phenomenon is often called the tissue fraction effect. The signal intensity in each voxel is the mean of the signal intensities of the underlying tissues included in that voxel (Fig. 2). Note that even if the imaging system had perfect spatial resolution, there would still be some PVE because of image sampling. This phenomenon is why PVE not only is an issue in emission tomography, which has poor spatial resolution compared with other imaging modalities, but also is of concern in high-resolution imaging, such as MRI or CT.
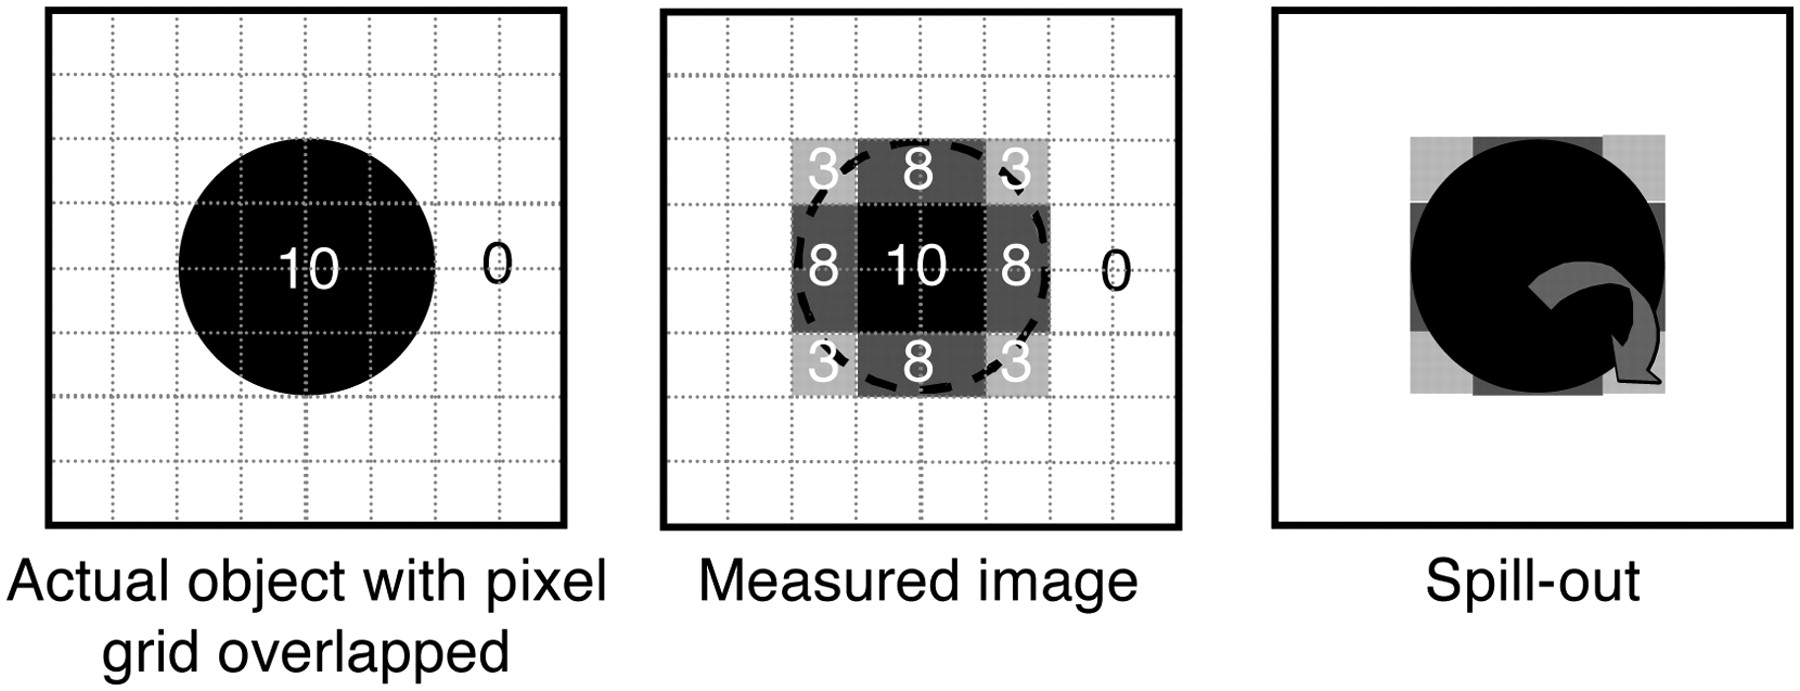
Influence of image sampling on PVE. Pixels on edges of source include both source and background tissues. Signal intensity in these pixels is mean of signal intensities of underlying tissues. Part of signal emanating from source is seen outside actual object and therefore is described as spilling out.
Ideally, compensation for PVE should account for both the finite resolution effect and the tissue fraction effect. Motion, especially respiratory motion, also introduces a blurring effect that results in additional PVE. However, this specific source of PVE is not covered in this article.
PRACTICAL CONSEQUENCES OF PVE
PVE can severely affect images both qualitatively and quantitatively. For any hot lesion of a small size and embedded in a colder background, PVE spreads out the signal. This effect typically occurs whenever the tumor size is less than 3 times the full width at half maximum (FWHM) of the reconstructed image resolution. The maximum value in the hot tumor then will be lower than the actual maximum value (Fig. 1). A small tumor will look larger but less aggressive than it actually is.
PVE compensation is complicated by the fact that not only does activity from inside the tumor spill out but also activity from outside the tumor spills into the tumor, partially compensating for the spilling out (Fig. 3). Obviously, the spilling out (signal from inside the tumor that goes outside the tumor [Fig. 3]) depends on the uptake inside the tumor. Most often, it is not balanced by the spilling in (signal from outside the tumor that comes inside the tumor); therefore, it is difficult to predict the overall effect of PVE. In tumors with wholly or partially necrotic centers, spilling in will cause one to think that there may be more viable tumor tissue within the tumor center than there really is. Simultaneously, the active part of the tumor will look less aggressive than it actually is (5).

The measured image (D) of the activity distribution (A) results from mixture of spilling out (B) and spilling in (C). Image sampling affects background activity, creating spilling in within tumor (C). Resulting image is sum of spilling in and spilling out (D).
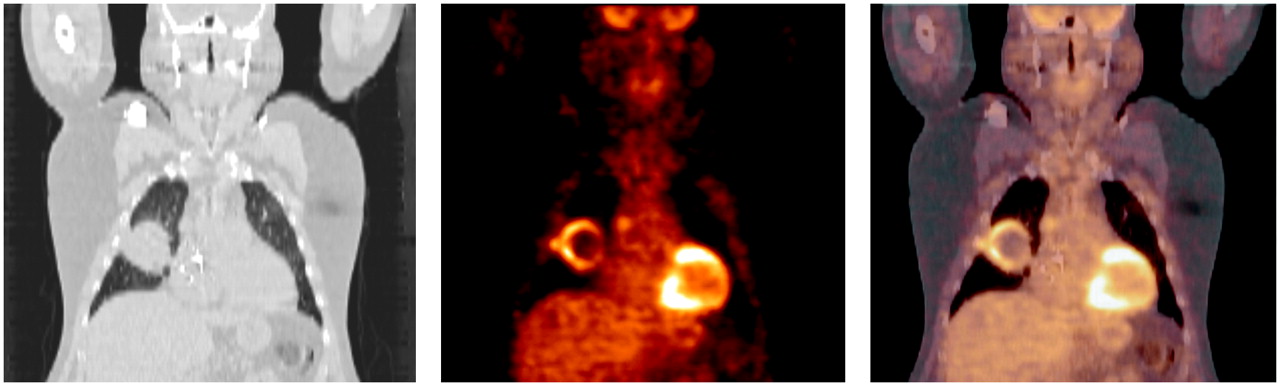
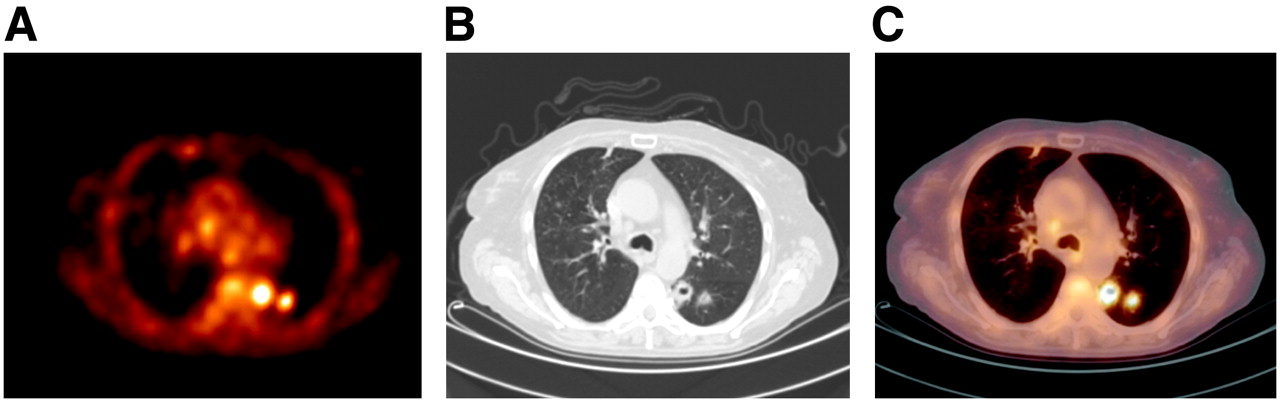
PVE also affects the apparent tumor size. This effect is especially problematic when PET is used to assist in radiotherapy treatment planning. The contours of a lesion as seen on a PET image may encompass more than the real metabolically active part of the tumor because of the limited spatial resolution in PET images (∼5 mm). In PET/CT, the fusion of the PET and CT images usually clearly shows this discrepancy between the tumor contours as displayed on the CT image and on the PET image (Fig. 4). However, frequently the contours seen on the CT image do not delineate the metabolically active part of the tumor, as CT does not show metabolically active tissue but rather shows only the attenuating properties of the tissue. Only high-resolution functional imaging provides an accurate delineation of the metabolically active part of the tumor. The quest for higher-resolution PET systems therefore remains highly relevant, despite the current availability of PET/CT scanners.

(A) PET image. (B) Corresponding CT image. (C) PET/CT image. Discrepancy between tumor contours as seen on CT and PET images is clearly visible.
In the absence of background activity, PVE does not affect the total activity in the tumor. If a large enough region could be drawn around the tumor, then the total activity in the tumor could be recovered. In other words, PVE does not cause any loss of the signal; it just displaces the signal in the image.
PARAMETERS AFFECTING PVE
The biases introduced by PVE depend on numerous parameters, only some of which can be controlled. All of these parameters must be kept in mind in the context of tumor follow-up, as they may not remain constant from one imaging session to another, making the biases introduced by PVE vary from one imaging session to another.
Tumor Size and Shape
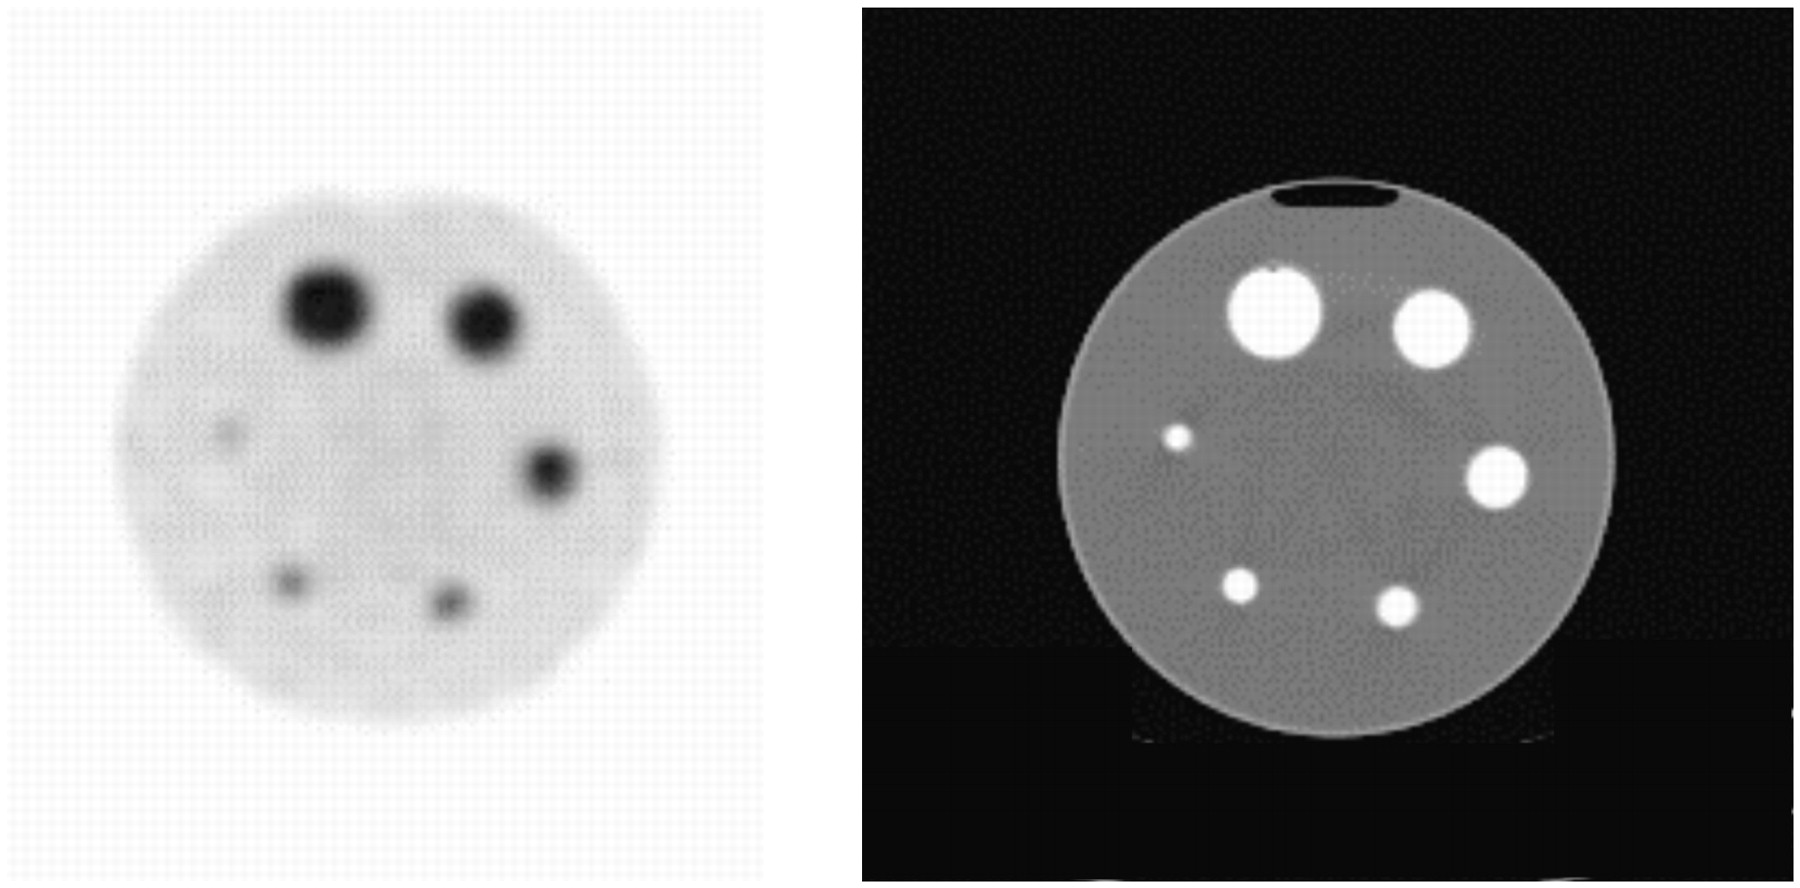
PVE strongly depends on the size of the tumor. The smaller the tumor, the greater the underestimation of the uptake value. As a result, different tumors with exactly the same uptake value but with different sizes yield tumor images with different degrees of brightness and hence different estimated uptake values (Fig. 5) (6).

Transverse PET slice of 6 radioactive spheres with different diameters (10, 12, 16, 22, 28, and 34 mm) and filled with same radioactivity concentrations in uniform radioactive background (left) and corresponding CT slice (right). PVE makes apparent uptake decrease when sphere size decreases.
The nonlinear correlation that PVE causes between SUV and tumor size has been shown in several clinical studies (e.g., studies by Vesselle et al. (7) and Hallett et al. (8)): small tumors appear less aggressive than they actually are. This dependence is extremely confounding in the context of therapeutic follow-up. Indeed, if a tumor shrinks in size as the course of therapy progresses, then it will erroneously appear to have less activity when it is small than when it was larger. Therefore, even if the true metabolic rate has stayed constant or increased slightly, PVE may cause an erroneous decrease in apparent uptake. Conversely, if a tumor is small to begin with but increases in size over the course of therapy, then uptake will erroneously appear to increase, even if the true metabolic rate has decreased or remained constant. If the tumor increases in size while the metabolic activity decreases, then the 2 effects will partially compensate for each other. The net apparent change in uptake will depend on the respective magnitudes of the changes in tumor volume and the changes in tumor uptake. These problems illustrate why PVE is so difficult to deal with.
PVE also depends on the shape of the tumor, more precisely, on how “compact” it is. The term “compact” refers to how much surface area a tumor has for a given volume. The larger the surface area for a given volume, the less compact the tumor. Spheric tumors are the most compact. For a given volume, tumors that are less compact are more affected by PVE than are spheric tumors, because a larger part of the tumor is close to the tumor edges and is thus prone to spilling in and spilling out. For instance, a cylindric tumor with a diameter of 2.3 cm and with a volume identical to that of a 4.6-cm-diameter sphere will yield an apparent activity about 40% lower than that of a spheric tumor when activity is measured within the actual contours of the tumor (9).
Surrounding Tissues
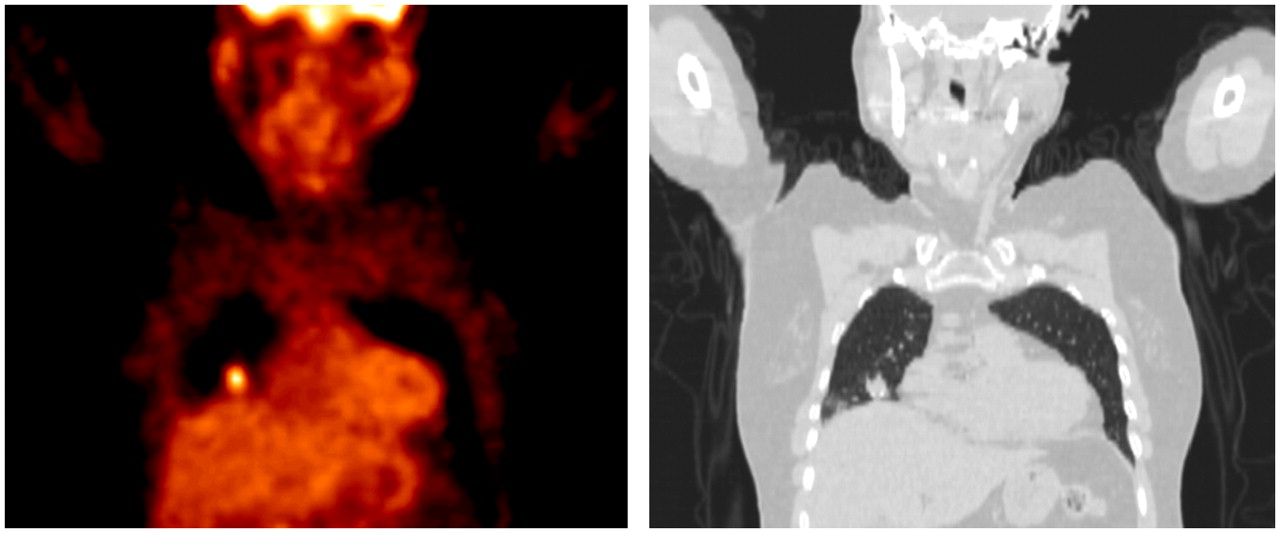
As previously stated, PVE results in spilling in and spilling out (Fig. 3). The size, shape, and uptake of the tumor fully determine the spilling out for a given spatial resolution. However, the spilling in depends on the surrounding background activity. For example, with 18F-FDG a lung tumor will be less affected by spilling in than will a tumor in the liver. The lung tumor therefore will appear dimmer than the liver tumor even if both tumors have the same size, shape, and uptake. The spilling in is often difficult to estimate, especially when the tumor is surrounded by a variety of tissues with different uptake values (Fig. 6). When SUVs are measured for therapeutic follow-up, the surrounding non–tumor-specific activity (e.g., myocardial uptake, bowel uptake, and activity in the urinary tract) can change from one scan to another. Changes in apparent tumor uptake therefore should be interpreted only after changes in the nearby background tissue also have been considered, as a change in apparent tumor uptake may reflect only a change in spilling in, without any change in the metabolic activity of the tumor.

PET slice (left) and corresponding CT slice (right). Tumor is close to 3 types of tissues (lung, liver, and mediastinum).
Similarly, the spilling in depends on whether a tumor includes a necrotic region. For a tumor of given size and uptake at a fixed spatial resolution, the apparent uptake value will always be lower if the tumor includes a necrotic region (5).
Spatial Resolution in Reconstructed Images
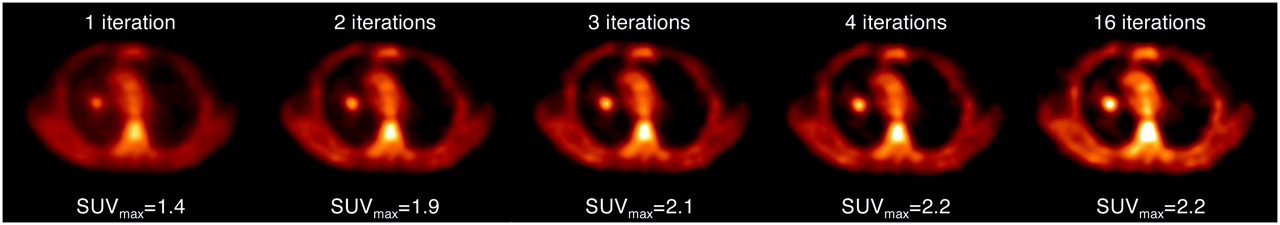
Although tumor size and shape and uptake in tissues surrounding the tumor cannot be controlled, the impact of PVE also depends on parameters that can be tuned. The most important of these parameters is the spatial resolution in the reconstructed images. Spatial resolution determines how far the signal spreads around its actual location (Fig. 1). High spatial resolution introduces little spread, whereas low spatial resolution introduces a large amount of spread. Therefore, a given tumor will vary in size, brightness, and SUV depending on spatial resolution (10). Spatial resolution is partly determined by scanner features (e.g., crystal size and arrangement and 2-dimensional [2D] or 3D acquisition mode (11)), but it also depends on reconstruction parameters (e.g., number of iterations, number of subsets in ordered subset–type algorithms, filter in filtered backprojection algorithms, and postfiltering (12,13)). Therefore, PVE can be partly controlled through the choice of these parameters: better spatial resolution yields less PVE. Figure 7 illustrates how spatial resolution affects the measured SUV: when too few iterations are used (as in the left side of Fig. 7), resolution is reduced, and the tumor appears less bright. As the number of iterations increases, resolution improves (right side of Fig. 7), and the tumor appears brighter (13). Eventually, the reconstruction routine will have reached its maximum resolution, and further increases in the number of iterations will increase noise without further increasing resolution (not shown in Fig. 7). The effects of noise on the measured uptake are discussed further later in this article.

Transverse PET slices of same PET data reconstructed with ordered-subset expectation maximization with different numbers of iterations (8 subsets). SUVmax varies substantially at early iterations.
Because of these resolution effects, when sequential measurements of tumor uptake are obtained over the course of therapy, it is essential to compare tumor uptake values only in images with identical spatial resolution values. Any change in reconstruction software potentially affecting the spatial resolution in reconstructed images therefore must be avoided.
Image Sampling
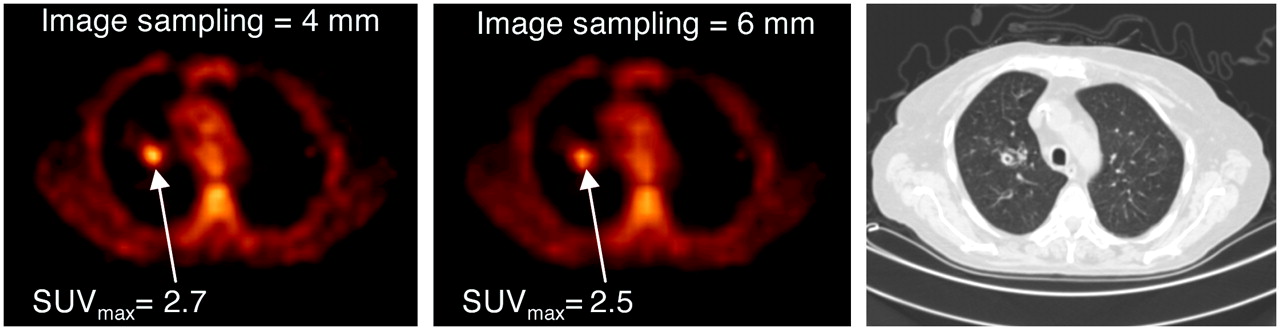
Image sampling affects the magnitude of PVE through the tissue fraction effect. Large pixels have a greater chance of containing a mixture of tissues than small pixels. The use of large pixels (or thick slices) increases the probability of mixing tumoral with necrotic or healthy tissues and thereby underestimating the actual metabolic activity of the tumor. For instance, increasing the pixel size by 50% can yield a decrease in the SUV of 7% when the SUV is measured with the maximum pixel value (Fig. 8).

Transverse PET slices from same patient with image sampling at 4 and 6 mm, resulting SUVmax, and corresponding CT slice.
Measurement Method
As mentioned previously, PVE affects tumors with diameters less than 2 or 3 times the resolution (FWHM) of the imaging system (14). This criterion is valid primarily when tumors with uniform uptake are assessed and when tumor uptake is assessed from a small region near the center of the tumor. Indeed, biases introduced by PVE depend on the size of the region used to measure tumor uptake. There is currently no consensus regarding how to define the region used to quantify tumor uptake. Several different possibilities are reviewed here, and their respective merits and drawbacks are discussed.
Maximum Value.
The maximum SUV (SUVmax) (or any uptake index) is always obtained for the 1-pixel region of interest (ROI) corresponding to the maximum pixel value in the tumor. In the absence of noise, this SUVmax is indeed the least affected by PVE (Fig. 1) and so is often considered the best measure of tumor uptake. Unfortunately, SUVmax is strongly affected by noise and therefore by the reconstruction algorithm (10,12,15), by any smoothing that may be performed, and even by the pixel size (the smaller the pixel size, the greater the pixel-to-pixel noise). In any real imaging situation, noise is always present, making SUVmax highly variable. It usually provides an overestimate of the true maximum pixel value but can occasionally even underestimate it. Therefore, SUVmax depends strongly on noise and, in high-noise situations, can behave in an unpredictable manner. Consequently, the use of SUVmax for comparing patient values from one scanner to the next or even for comparing one scan to the next (e.g., before therapy and after therapy) on the same scanner is problematic. Unless the effect of noise can be rigorously accounted for, observed changes in SUVmax may be statistical fluctuations rather than true metabolic changes. Use of the maximum pixel value in a tumor to characterize tumor uptake, however, does make the measurement independent of the observer. This is why, despite its sensitivity to noise, the use of SUVmax is popular. However, it should be emphasized that even without noise, a single pixel may not be representative of the overall tumor uptake in a nonhomogeneous tumor.
Mean Value in Manually Drawn Region.
For the determination of tumor uptake, a region around the tumor can be manually drawn, and the mean number of counts in that region can be calculated. This approach is a subjective one prone to observer variability but nevertheless has been used in several studies (12,15).
Mean Value in Fixed-Size Region.
One simple approach to avoiding variability in region drawing is to use a region of fixed size (e.g., a circle or square), regardless of the tumor size. If the placement of the ROI can be automated (for instance, centering the ROI around the center of “gravity” of the tumor, as determined by counts), then this method is insensitive to operator variability. However, the use of a region of fixed size can yield very biased results, depending on the size of the tumor with respect to the size of the region. For instance, the mean value from a 15 × 15 mm ROI placed on a 4-cm-diameter tumor yields nearly the true uptake value (assuming a 3-mm pixel size) when imaged with a scanner that has a 6.5-mm spatial resolution. If the tumor were instead 2 cm in diameter, then the tumor uptake would be underestimated by 18% with this same ROI. Therefore, during therapy, if the tumor shrinks from 4 cm to 2 cm without any change in metabolic activity, then uptake estimated from this fixed-size region will erroneously indicate an 18% decrease in metabolic activity.
Mean Value in Region Based on Intensity Threshold.
Another objective method for drawing a region is to use an isocontour, defined as a percentage of the maximum pixel value in the tumor (typically between 50% and 80%). A drawback of this approach is that the resulting region may depend on how much noise is present, as the isocontour value is often based on the maximum pixel value in the tumor. For instance, for a 2-cm-diameter tumor seen at a 6.5-mm spatial resolution with an uptake of 100 (arbitrary units), a 75% isocontour based on noise-free data will be set to 75 and will include 65% of the tumor volume. If the maximum pixel value is 112 instead of 100 because of noise, then the isocontour will be set to 84 and will include 37% of the tumor volume. This problem can be addressed by smoothing the image aggressively before determining the maximum and then using the resulting isocontour value to draw the region on the original (nonsmoothed) data. Alternatively, the threshold can be based on some other average value within the tumor rather than simply on the maximum. A second shortcoming of isocontour methods is that if the percentage used is too low (for instance, 30%), then the resulting region may spread out to inadvertently include a significant proportion of the background (12). To bypass this problem, the isocontour value can be based, for example, on the difference between the tumor activity and the background activity (10). Like isocontour methods and with many of the same advantages and limitations, a 3D region-growing algorithm can be used to include in the region all contiguous voxels having values above a fixed percentage of the maximum pixel value in the tumor.
When isocontour or region-growing approaches are used for therapeutic follow-up, if the true metabolic activity of the tumor decreases, then the isocontour value, expressed as a percentage of the maximum pixel value in the tumor, will also decrease. One proposal for addressing this problem is to use the isocontour value determined from a pretherapy study to determine the region for a posttherapy study or vice versa.
A potential advantage of these isocontour or region-growing methods is that they yield information regarding the metabolically active volume of the tumor, a parameter that may be relevant for the monitoring of patients. The tumor size determined with these approaches is a metabolic size, which may disagree with the CT- or MRI-based morphologic size. When these threshold-based ROI definitions are used, uptake and metabolic tumor size are not necessarily independent parameters.
Figure 9 shows how SUVs vary with different region-drawing methods. For a 1.8-cm-diameter tumor, the mean SUVs within the drawn regions were 47%, 37%, 24%, and 16% lower than the SUVmax when the regions were drawn manually, drawn with a 15 × 15 mm fixed sized, or drawn with region growing at 50% and 75% thresholds, respectively. Similar trends were reported by Krak et al. (12), who investigated changes in 18F-FDG uptake in breast cancer patients during chemotherapy. Although various region-drawing schemes yielded different absolute results, the relative changes in 18F-FDG uptake during chemotherapy showed the same trends regardless of the ROI used. The largest changes (a decrease of about 55% after 6 courses of chemotherapy) were observed with the 15 × 15 mm fixed region, whereas the smallest changes (a decrease of about 35%) were observed with manual drawing. Such variability in the magnitude of changes may be problematic for early follow-up.

Different measurement methods yield different SUVs. SUVmax was calculated from maximum uptake in tumor. SUV75% and SUV50% were mean values in ROI corresponding to isocontours equal to 75% and 50% SUVmax, respectively. SUV15×15 was measured in fixed rectangular region of 15 × 15 mm. SUVmean was measured in manually drawn region (represented in red on CT slice [right]).
In summary, biases introduced by PVE depend on several parameters. A relevant meta-analysis of findings reported by different groups regarding tumor uptake and therapy monitoring would require that all of the parameters that can be controlled be given. These might include spatial resolution, spatial sampling in images, the total number of counts (or coincidences) achieved, and the region dimensions and placements used to measure tumor metabolic rates or uptake. Tumor sizes (e.g., from CT or MRI, when available) should also be given to provide a complete representation of what the influence of PVE might have been. Without a careful analysis of these data, meta-analyses are almost meaningless, given the huge variability (>50%) in estimated uptake values that can be introduced by differences in image quality and measurement methods.
PARTIAL-VOLUME CORRECTION
PVE has been identified as a major source of bias in PET brain imaging measurements for a long time because of the number of intricate, small structures in the brain. Most work regarding the development of PVE corrections therefore has been performed for brain PET. However, no general, widely accepted solution to the PVE problem has yet been found. Therefore, several methods currently under investigation for PVE correction are presented here, and their relevance to tumor imaging is discussed.
Reducing Biases Attributable to PVE
Precautions can be taken to reduce the biases introduced by PVE in tumor imaging. Obviously, the better the resolution (e.g., through appropriate reconstruction parameters), the smaller the errors caused by PVE but, of course, increased resolution often has to be balanced against increased noise. One very important method for enhancing spatial resolution is modeling the detector (or collimator, for SPECT) response into the system matrix used in iterative reconstruction (16). Better spatial resolution in reconstructed images may prevent some structures from being affected by PVE and will reduce the biases introduced by PVE in others. Pixel size should also be kept small to reduce the tissue fraction effect.
It should be emphasized that the images most appropriate for quantitative measurement may not be the “best” images for qualitative assessment (i.e., lesion detection). The use of different images for these 2 purposes may be worth considering for certain applications, focusing on high-resolution—but noisy—images for quantitative measurement while using smoother images for visual interpretation.
Correction Methods Applied at Regional Level
Some PVE correction methods are applied at a regional level, meaning that a value (e.g., mean SUV) is measured in a region of the image, and then some property of that particular region is used to modify the value to obtain a PVE-corrected value. Such methods do not yield PVE-corrected images but rather yield only PVE-corrected regional values. Therefore, these methods may be suitable for the quantification of tumor uptake but not for visual analysis. Several such methods are described here.
Recovery Coefficient (RC).
The use of RCs is a very simple method for PVE correction. To apply the method, one multiplies the measured uptake value in the ROI (here, a tumor) by a correction factor called the RC. This RC is precalculated for an object whose size and shape are similar to those of the structure of interest. This calculation must be performed separately for the resolution of each scanner (which may differ at different locations in the scanner field of view). A necessary assumption is that the volume and shape of the metabolically active part of the tumor are approximately known. For a spheric tumor, the RC can be readily calculated as a function of the sphere size and the sphere-to-background contrast for a wide range of spatial resolution values (6,14) and then used for correction. The method can also be applied for a tumor that is not spheric. In this situation, the RC can be calculated by convolving a binary image of the tumor shape with the known spatial resolution. The RC depends not only on tumor volume but also on image sampling. The RC can be calculated by assuming no surrounding activity, and the uptake surrounding the tumor, which has to be estimated to compensate for spilling in, can be accounted for subsequently by use of a simple formula when the RC is applied (17–21).
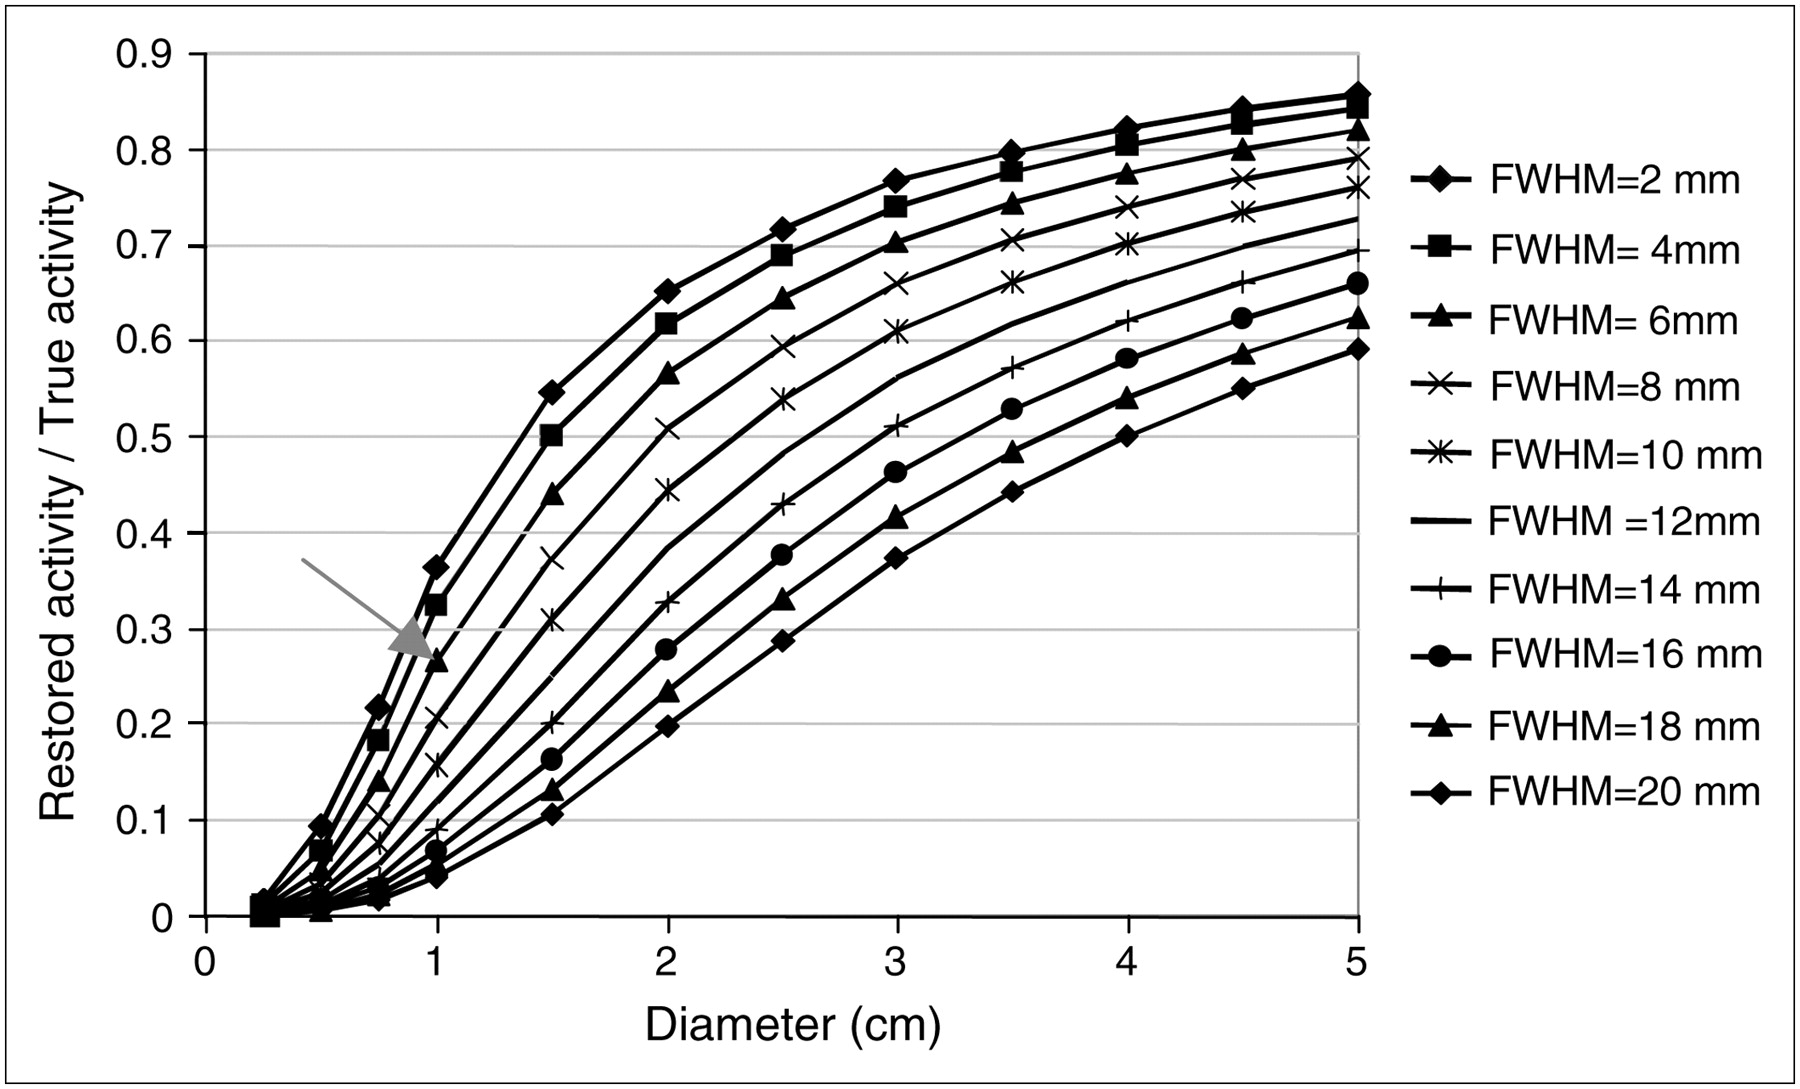
As an example, the curves in Figure 10 were determined by analytically simulating uniform radioactive spheres of various sizes in a nonradioactive background for different spatial resolution values. Each curve represents the mean activity measured in the true sphere contours divided by the true activity in the sphere as a function of the sphere size. For a 1-cm-diameter spheric tumor in a nonradioactive background, Figure 10 shows that the RC would be 1/0.27, or 3.7, for a 6-mm spatial resolution; therefore, the measured activity would have to be multiplied by 3.7 to obtain the PVE-corrected value.

Restored activity measured in actual contour of spheres in cold background as function of sphere diameter and spatial resolution of imaging system.
This approach is extremely simple and is commonly used for PVE correction in PET tumor imaging (18,19,22,23). Usually, tumors are assumed to be spheric, and their diameters are estimated from CT. Ideally, the contour of the metabolically active part of a tumor should be delineated, as PVE depends not only on the tumor volume but also on the tumor shape. Also, the method assumes that the uptake is uniform throughout the tumor—although a necrotic part could be excluded if the tumor is delineated—and the method usually accounts only for uniform known surrounding activity. If the tumor is close to 2 structures with different uptake values, then the use of the RC may be inappropriate (Fig. 6).
Geometric Transfer Matrix (GTM).
Although the RC method accounts only for spillover between 2 structures (the tumor and the surrounding tissues with uniform uptake), the GTM method can account for spillover among any number of structures. This method was initially proposed in the context of brain imaging to correct for the spillover among gray matter, white matter, and cerebrospinal fluid (24–27). The idea was to use anatomic data to delineate n functional structures of interest (called compartments) with the assumption that the structures have uniform uptake. The image of each compartment as seen by the imaging system is obtained with the knowledge that each compartment will be blurred by the point spread function of the imaging system. The resulting image yields the proportions of signal emanating from the compartment but detected in each of the n – 1 other compartments (Fig. 11). By repeating this step for each compartment, one can calculate transfer coefficients Wij, corresponding to the fraction of signal emanating from compartment i and detected in compartment j. The measured values mj in each compartment of the image to be subjected to PVE correction can be expressed as a linear combination of the true unknown values vi in each compartment; the coefficients of this linear combination are the transfer coefficients Wij. The PVE-corrected values for each compartment i are obtained by solving the system of n equations with n unknowns. The only requirement of this method is the delineation of the functional regions corresponding to the different compartments, which are assumed to have uniform uptake. Such delineation is often performed on anatomic data registered with PET data.
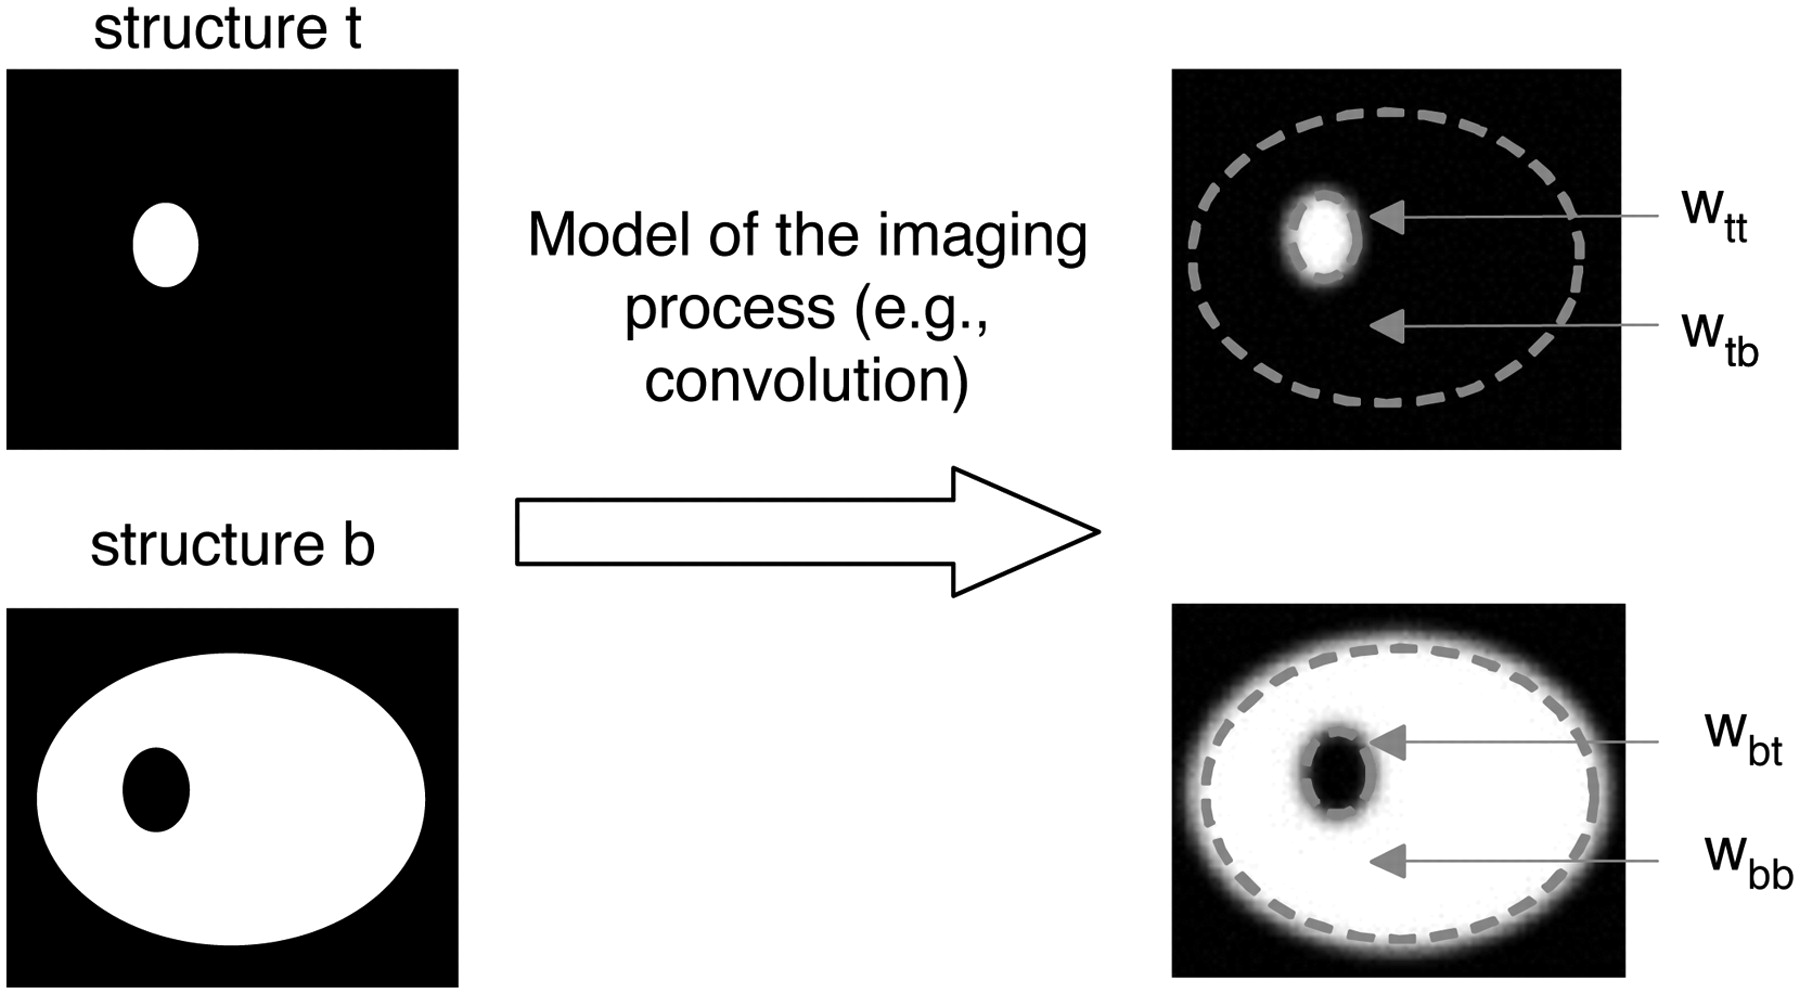
Calculation of transfer coefficients for 2 compartments (tumor [t] and background [b]). Image of each binary compartment as seen by imaging system is obtained by modeling imaging system response. Resulting image is nonbinary image from which 4 transfer coefficients can be calculated. For example, Wtt corresponds to fraction of signal emanating from tumor and detected in tumor, whereas Wtb corresponds to fraction of signal emanating from tumor and detected in background.
The GTM method can be seen as a generalization of the RC method to more than 2 compartments. As with the RC method, the transfer coefficients have to be calculated with the same spatial sampling as that used for the images to be corrected. The transfer coefficients can be calculated either by convolving the binary image of each compartment with the imaging system response function or by projecting and then reconstructing this binary image (28). The latter approach accounts for local variations in the spatial resolution in the reconstructed images. However, it does not account for possible nonlinear effects inherent in iterative reconstruction algorithms. Such effects can be dealt with by use of perturbations during calculation of the transfer coefficients (29). This generalization may be useful for reconstruction methods involving corrections that introduce strong nonlinear effects, such as detector response compensation.
The GTM method has been successfully applied in PET brain imaging, resulting in biases of less than 10% in the estimation of striatal uptake (25,28). Its applicability to tumor imaging is severely restricted by the required delineation process, which can be very challenging (Fig. 12), and by the assumption of a piecewise constant activity distribution. It may still be worth investigating the use of the GTM method for local correction when a tumor is close to more than one compartment (for instance, a lung tumor close to the liver). In that specific circumstance (Fig. 6), it may yield more accurate results than the RC method.
CT image (left), corresponding PET image (middle), and PET/CT image (right) of tumor with no uptake in center. Delineation of tumor from CT image would yield inappropriate definition of metabolically active part of tumor.
Deconvolution.
Deconvolution is often used for image restoration, that is, to recover spatial resolution. As PVE is partly caused by finite spatial resolution, deconvolution has been suggested to estimate the spillover effect caused by the point spread function. One approach used an iterative deconvolution technique (30): at each iteration n, given a local model of the point spread function (F), the image that would be obtained if the true image was  is calculated (
 ) and compared with the image I that was actually acquired. The difference is weighted (by the factor α) and added to the current estimate
  of the PVE-corrected image to yield a new estimate
  , as follows:
Deconvolution severely amplifies noise. The authors therefore proposed not using the PVE-corrected image  for visual interpretation. Instead, they evaluated the method with only the average pixel value in an ROI placed on this image, the ROI having been previously defined on the uncorrected image I with a region-growing approach (80% threshold).
In other words, the method first enhances spatial resolution through a deconvolution approach and then estimates the tumor uptake in a particular region through the use of an intensity threshold, although any ROI drawing method can be used.
The main advantage of this approach, compared with the RC or GTM approach, is that it does not require any assumption regarding tumor size, tumor boundary, tumor homogeneity, or background activity. It does, however, require that the local spatial resolution be known to within ∼1 mm. This approach does not seem to be appropriate for recovering uptake values in tumors with diameters less than 1.5 times the FWHM in reconstructed images. For tumors with diameters more than 1.5 times the FWHM, uptake values were recovered more accurately than if the maximum or mean value had been determined from uncorrected images.
Correction Methods Applied at Pixel Level
The methods previously described allow partial-volume correction to be applied to the uptake value within a tumor or other region. A greater challenge exists in producing PVE-corrected images that have low enough noise to be interpreted on a pixel-by-pixel basis. All methods in this category rely on the joint use of anatomic and PET images.
Partition-Based Correction.
This method, proposed for brain imaging, assumes that the true activity distribution can be segmented into a series of n nonoverlapping compartments with a known uniform uptake (as in the GTM method)—except for one compartment (the compartment of interest) (31–34). The compartment contours are defined from MR images perfectly registered with PET images. Given the contours and the uptake of all compartments except for one, the PET image that would be obtained if only these compartments were present can be modeled by first convolving the image of each compartment scaled to its uptake value by the point spread function of the imaging system and then summing the resulting images. This image is subtracted from the actual image, yielding an estimate of the activity distribution in the compartment with unknown activity. Given the contours of this latter compartment and the point spread function of the imaging system, the actual activity distribution in this compartment of interest can be recovered pixel by pixel. The advantage of this approach is that it yields a PVE-corrected image of the compartment of interest, which could be useful in investigating variations in uptake within a tumor. However, when one attempts to adapt the method to tumor imaging, as opposed to brain imaging, the underlying assumptions seem unrealistic, unless one restricts the analysis to a small region around the tumor. Even in this situation, one must still assume that the uptake of all compartments surrounding the tumor is known and that the tumor contours can be delineated. A variant of this method has been described to account for a nonstationary (i.e., variable throughout the image) point spread response function (35).
Another generalization of this method (36) does not require any assumption regarding the uptake in any of the n compartments and also accounts separately for the tissue fraction effect and the point spread function effect. Through convolving of the nonbinary image of each compartment, the spilling in and spilling out are modeled as in the GTM method, but on a pixel-by-pixel basis. One then must determine the activity distribution consistent with the values for spilling in and spilling out given the observed pixel value. This determination is typically made with a least squares method.
Multiresolution Approach.
A second method (37) yielding PVE-corrected images assumes that a high-resolution image (from CT or MRI) perfectly registered with a PET (or SPECT) image is available. The gray levels in the high-resolution image must be positively correlated with those of the functional image to be corrected for PVE. No segmentation of the high-resolution image is needed, a feature that is an advantage of this method over the partition-based correction method. The multiresolution method also assumes that the spatial resolution in reconstructed images is stationary (i.e., identical throughout the images). The details of this method were described by Boussion et al. (37) but are summarized here.
With the assumptions previously mentioned, details of the high-resolution image are extracted, transformed, and incorporated in the low-resolution PET image. Discrete wavelet transforms of both the high-resolution and the low-resolution images are performed to identify a level of spatial resolution common to both types of images. Details at the level of resolution present in the high-resolution image are then incorporated into the low-resolution image on the basis of the assumed correlation between the gray levels in the 2 types of images. A structure that is not visible in the high-resolution image remains unchanged in the PVE-corrected image. If a structure appearing as a hyperintense signal in the PET image corresponds to a hypointense signal in the high-resolution image, this structure will be wrongly corrected in the PVE-corrected image, but other structures will be properly corrected.
The assumption of a positive correlation between the gray levels in the anatomic and PET images is obviously unrealistic in whole-body imaging but may be reasonable for analysis of small regions within a whole-body image. A weakness of the method is that it is a 2D approach, because of the 2D nature of the wavelet transform, and therefore is applied slice by slice, whereas PVE is a 3D phenomenon. Further investigation of this recently described method is required to determine its applicability to tumor imaging.
Fitting Method.
In this method, one assumes that a tumor can be considered as a sphere with an unknown diameter and with uniform uptake and that the background level is uniform. The observed image then can be modeled as the result of the convolution of this sphere with the point spread function characterizing the local spatial resolution in the image (38). The unknown parameters of the model (sphere location, sphere size, sphere uptake, and background uptake) then can be estimated by minimizing an objective function characterizing the quality of the fit and penalizing unrealistic solutions. Similar fitting approaches were previously proposed and used in brain PET for striatal uptake measurements (39). The applicability of this approach to tumor imaging is limited by the assumptions needed regarding tumor shape and background (note that the method is not appropriate if the tumor is close to 2 structures with different activity levels). The advantages of this approach are that a possible dependence of the local point spread function on the structure of interest (40) could be accounted for and that no anatomic data are required.
Modeling PVE During Reconstruction.
All of the methods previously mentioned can be applied to images that have already been reconstructed. Several methods (many developed for brain PET) compensate for PVE during the reconstruction process (41). One such method uses a so-called “maximum a posteriori” approach, which incorporates previously determined anatomic information into the reconstruction process. Anatomic images (from MRI), which are assumed to be perfectly registered with PET images, are used to derive a model of tissue composition (and hence to compensate for the tissue fraction effect). Additional assumptions regarding the uptake distribution in some compartments are needed. The hypotheses are similar to those of the partition-based correction method already described. The major difference is that the partition-based correction method is applied after reconstruction, without the use of an explicit noise model, unlike the approach of Baete et al. (41), which compensates for PVE during reconstruction. With the latter approach, noise suppression can be restricted to specific compartments with anatomically based smoothing. In other words, if a pixel contains a mixture of activities from gray matter and white matter, smoothing can be applied to gray matter activity only. Smoothing during reconstruction therefore does not increase spillover. In addition, anatomical priors can be used to preserve strong edges between compartments. The method is very appealing from a theoretic point of view, but deriving a tissue fraction model in tumor imaging is much more challenging than it is in brain imaging. The applicability of the method to tumor imaging thus remains to be demonstrated. Obviously, because it modifies the reconstruction process, the method cannot be applied retrospectively (unless sinograms have been stored).
Kinetic Modeling.
PVE correction can also be incorporated into some kinetic models. This approach has been used in brain and cardiac imaging (42–45). The idea is to include in the kinetic model parameters that describe the tissue fraction effect and to fit these parameters in addition to the physiologic parameters of the model. The model thus includes more parameters to be estimated than when PVE is ignored, but spillover and tissue fraction effects are accounted for during the fit. This approach is obviously restricted to the analysis of time series and has been used primarily for tumor blood flow analysis (46,47). The approach is appealing because it uses the constraints brought by the kinetic model to determine the magnitude of PVE. The availability of different time frames also introduces some redundant information regarding the tissue fraction and spillover effects (which are invariant in time) and therefore facilitates a robust estimation of tissue fraction parameters. The feasibility of extending this method to the models used for assessing the glucose metabolic rate from dynamic 18F-FDG PET scans has yet to be studied.
Table 1 summarizes the different approaches that have been proposed for PVE correction.
Summary of Main Properties of 8 PVE Correction Approaches*
Which PVE Correction Should Be Considered?
In choosing among the various PVE correction methods previously described, one may have to strike a balance between improved absolute measurement and potentially increased variability. The results described so far suggest that even applying a method as simple as the RC method can greatly reduce the bias in uptake estimates with little or no increase in variability. The RC method has the advantages of being applicable retrospectively and of not requiring registered anatomic information. More sophisticated methods involving more compartments, such as the GTM method, may be more accurate for tumors close to several compartments with different uptake values, but this hypothesis remains to be proven. Furthermore, methods requiring the delineation of functional regions on the basis of anatomic images (CT or MRI) are prone to 2 types of errors that will directly affect the accuracy of the correction: first, misalignment between anatomic and functional images (48), and second, potential differences between the anatomic contours of the tumor and the contours of the metabolically active part of the tumor (5).
A major step toward practical PVE correction would be achieved if tumor delineation were not needed, as in the deconvolution or multiresolution approach, the former having the advantage of not requiring high-resolution anatomic information. The accuracy and the robustness of these methods need further study. Another major step that would enhance the value of PET for therapeutic follow-up would be the availability of PVE-corrected images rather than simply PVE-corrected uptake values. Such images would facilitate the detection of nonuniform tracer uptake within a tumor and possibly tumor tissue resistant to therapy. Some methods, such as the multiresolution approach or the partition-based correction approach and its variants, already offer this capability. The reliability of these methods for properly restoring uptake inhomogeneity at the pixel level must still be demonstrated. Including PVE correction within the kinetic modeling step is also an elegant approach that may be preferable to correcting PVE first and then performing a kinetic analysis. The latter approach can indeed suffer from poor local variance estimates in PVE-corrected images (49). From a practical point of view, however, this approach would require that dynamic PET scans be the rule and not the exception.
PRACTICAL IMPACT OF PARTIAL-VOLUME CORRECTION
The impact of PVE correction has been only recently studied in PET tumor imaging. Results so far confirm, as expected, that accounting for PVE can be crucial. For instance, the correlation between 18F-FDG uptake assessed by SUVmax and sphere size observed in non–small cell lung cancer (NSCLC) tumors disappeared after PVE correction (7). This effect occurred because this relationship was attributable mostly to the tissue fraction, which makes apparent activity depend on tumor size (Fig. 5). More puzzling, the correlation between primary NSCLC tumor stage and 18F-FDG uptake measured with SUVmax also disappeared after PVE correction (50). This result could suggest that 18F-FDG uptake may be prognostic of NSCLC outcome only through size dependence (i.e., larger non–PVE-corrected tumors had higher 18F-FDG recovery). This hypothesis is consistent with the observation that for tumors larger than 2.8 cm, which are thus weakly or not at all affected by PVE, there was no association between tumor stage and 18F-FDG uptake (50).
PVE correction can also reveal relationships that remain hidden without correction. For instance, a higher 18F-FDG uptake was found in high-grade non-Hodgkin's lymphoma than in low-grade non-Hodgkin's lymphoma only after PVE correction (51). Several studies have shown that benign and malignant lesions, such as small tumors (<2 cm in diameter), breast tumors (17,18), and lung nodules (23), were better distinguished with PVE correction than without.
Finally, in small-animal tumor imaging, it has been clearly shown that PVE correction is essential for making the radionuclide concentrations measured with PET agree with the radioactivity concentrations obtained by γ-counting (52).
The impact of PVE correction has been recently studied in the context of therapeutic follow-up. During a study of changes in blood flow and metabolism for breast cancer patients treated with chemotherapy, PVE correction reduced the changes observed after therapy (53). This result is consistent with the fact that for patients who respond to therapy, the decline in metabolic activity is often accompanied by shrinking of the tumor. This reduction in tumor size makes the apparent decrease in metabolic activity greater than it really is unless PVE is compensated for. A complementary study by the same group confirmed that PVE correction reduces the correlation seen between blood flow measurements and kinetic parameters characterizing 18F-FDG metabolism, although significant correlations remain even after PVE correction (54).
All of the results just mentioned were obtained with the RC method for PVE correction. To the best of our knowledge, other PVE correction methods have not yet been applied clinically in PET tumor imaging.
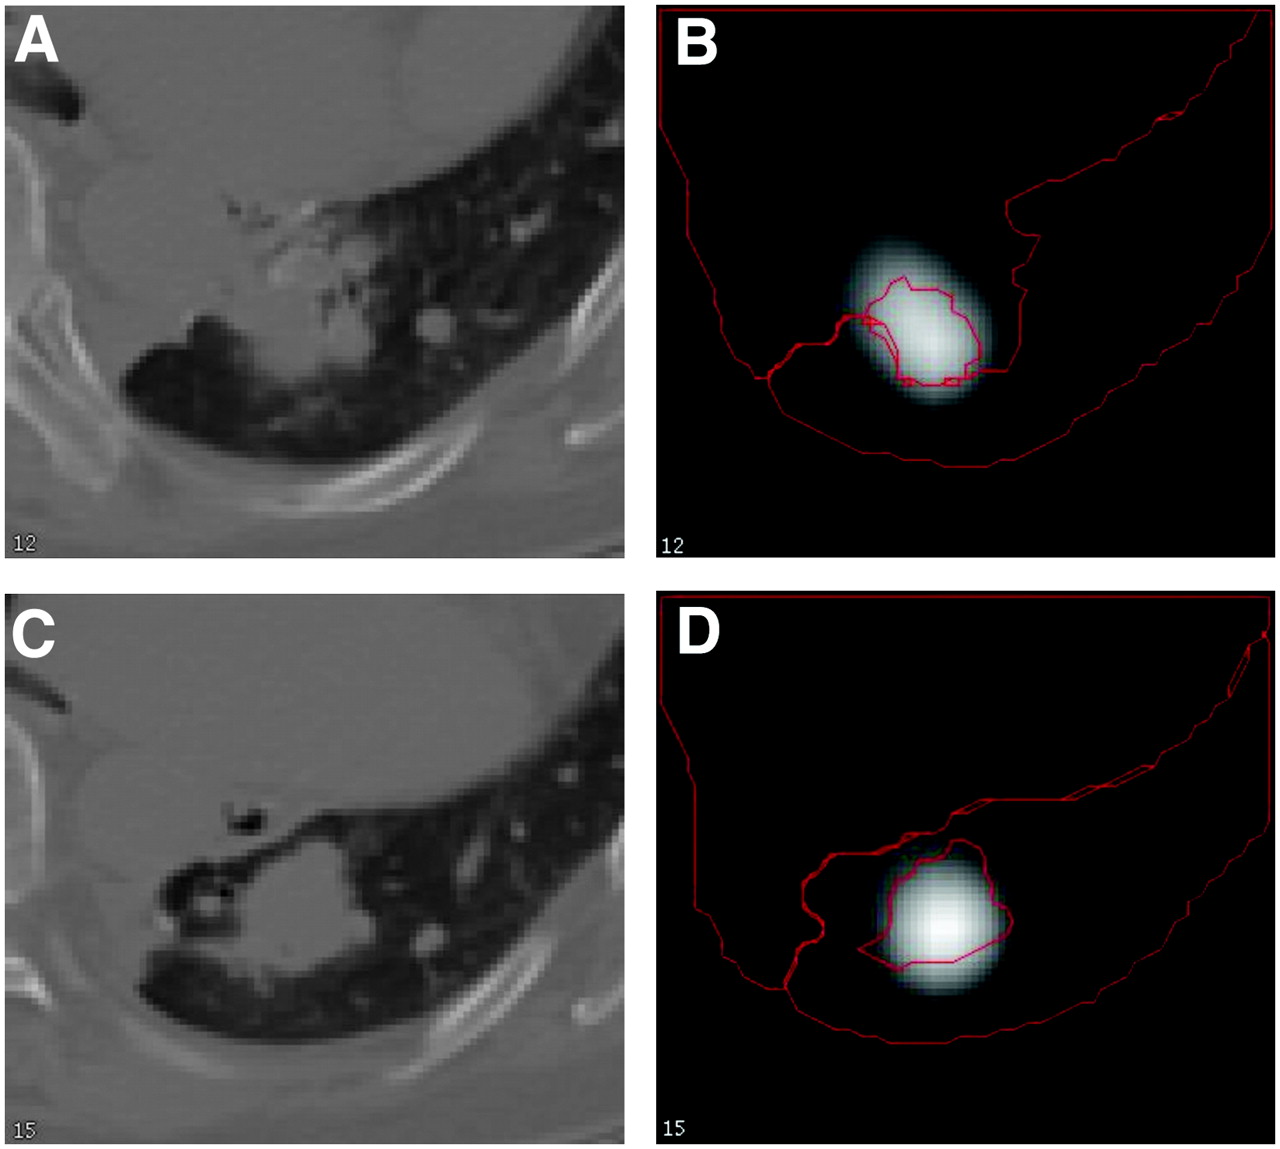
As an example, we applied 4 PVE correction methods and calculated the resulting SUV for a lung tumor (Fig. 13) measured with a PET scanner having a reconstructed spatial resolution of 6.5 mm. Four compartments, namely, the tumor, lungs, soft tissues, and “heart,” were manually delineated on the CT. The tumor volume, as estimated with manual delineation of the tumor on CT, was 6,539 mm3 (a sphere with an equivalent volume would have a 23-mm diameter). Without PVE correction, SUVmax was 11.2, and mean SUV calculated within the contours of the tumors as manually delineated on CT was 5.7. The RC was calculated given that the tumor contours were manually delineated on CT and assuming that the background was the lung compartment (only 1 background compartment can be considered with the RC approach). The GTM method was applied in a model with 4 compartments manually delineated on CT by use of a convolution model to calculate the 16 transfer coefficients. The partition-based method was applied with the same 4 compartments as those used for the GTM method, assuming that only tumor uptake was unknown. Finally, the deconvolution approach was applied, considering an 80% threshold for SUV measurement in the deconvolved image.

CT (A and C) and PET (B and D) images corresponding to 2 slices through lung tumor. Compartment contours as drawn from CT are shown in red on PET images.
PVE-corrected mean SUVs averaged within the tumor contours were 11.1, 11, and 10.8 for the RC, GTM, and partition-based methods, respectively, and the SUV was 12 with the deconvolution approach. When applying the RC method by considering the RC for a spheric tumor with the same volume as the volume determined from CT, the resulting SUV was 9.2. These results confirm that noncorrected SUVs can vary significantly, depending on how they are calculated, by as much as ∼100% (5.7 vs. 11.2). Although the true SUV cannot be known in a patient, it is interesting to note that PVE-corrected data are much more consistent, with only a small dependence on the method used for correction (resulting in SUVs of 9.2–12). Interestingly, for this example, the SUVmax (i.e., without PVE correction but with minimization of PVE) was close to the PVE-corrected values—a not entirely unexpected result given the relatively large tumor size. Comprehensive studies are needed to examine how the way in which SUVs are measured can affect the results and how the various PVE correction methods influence the measured SUVs.
DISCUSSION
PVE can have a major effect on the measurement of tumor uptake with PET. PVE can produce a large bias in measured uptake and depends in a complicated fashion on several parameters. These parameters may vary from patient to patient and from one scan to the next in the same patient. The effect is well understood, but the best way to deal with it has yet to be determined, especially for measurement of tumor uptake in the context of evaluating the change in uptake with therapy.
Possibly more deleterious than the bias that PVE introduces is the variability in apparent uptake that PVE can cause. PVE can cause the measured value of tumor uptake to vary greatly, depending on the tumor characteristics (e.g., its size and shape), on the tomograph (e.g., spatial resolution), on the processing (e.g., reconstruction), and on the measurement procedure. Because of this high variability, meta-analyses of published results are almost impossible, and prospective clinical trials are fraught with difficulty. Two strategies could be used to improve this situation. First, details regarding tumor size, spatial resolution in the reconstructed images, and measurement methods should systematically be reported. Second, standardized procedures could be introduced for acquisition, for reconstruction, or for processing (or preferably all 3). Standardization of acquisition and reconstruction protocols would at least permit more reliable comparisons to be made between scans performed with a particular scanner. This standardization would still result in intermachine differences, however. For cross-scanner comparisons, all acquisitions and reconstructions could be adjusted to achieve similar resolution, noise, and pixel sampling. Some systematic computational schemes for ROI determinations and uptake measurements could be adopted, although results will still depend on the image characteristics (e.g., spatial resolution, noise, and sampling). It may not be possible to find a single standardized protocol that is optimal under all conditions. However, such a standardized protocol might well be better than a plethora of more optimal procedures. The former might allow more accurate within-scanner and across-scanner comparisons to be made than the latter. A standardized phantom could also be scanned to at least precisely characterize the PVE for a given acquisition and processing protocol, so that such characterization could be subsequently used when one is pooling results from different studies. Standardization will require much work and cooperation but seems essential in order to untangle the complicated relationship between measured tumor uptake and tumor physiology. This approach would seem to be the only way to make reliable tumor imaging and therapeutic follow-up a reality. If such standardization is not achieved, many of the potential benefits of PET may not be realized.
This review has focused on errors in quantification caused by tissue fraction and limited spatial resolution. However, other errors can also occur in making measurements of tumor uptake. One of the most important of these is caused by motion—either inadvertent motion by the patient or physiologic motion—for example, the motion caused by respiration or even the motion caused by cardiac contraction. These latter types of motion can often be thought of as producing “blurring” in the resultant image and so, from that point of view, yield PVE similar to those produced by an imperfect scanner resolution or reconstruction algorithm. Motion can also introduce large biases in tumor uptake estimates (55). The effort expended in attempting to correct partial-volume errors must therefore be balanced against the magnitude of the other errors that might also be present in the images.
SUV is currently widely used to characterize 18F-FDG uptake. However, it remains only an approximate indicator of the glucose metabolic rate, and it is not clear that it will ultimately prove to be the optimum clinical measure of tumor glucose metabolism. As is well known, the validity of SUV is limited by its dependence on the time at which imaging is performed, by possible changes in the input function (i.e., by changes in the dose available to the tumor), and by the potential presence of residual blood activity and nonmetabolized 18F-FDG (56,57). It is possible that some clinically feasible method will be developed to permit more accurate measures of metabolic rate (e.g., full kinetic modeling or Patlak analysis). Some attempts to adopt kinetic analysis for routine clinical use have already been made (56,58–60). Until PVE can be incorporated into the 18F-FDG modeling process, however, such kinetic analyses will continue to be subject to the same PVE as SUV. This is why PVE is likely to remain a source of error regardless of the physiologic parameter used to characterize tumor 18F-FDG metabolism.
CONCLUSION
PVE is a major confounding factor in PET tumor imaging that cannot be ignored. Multiple approaches are under development to deal with it and better control its effects, especially in the context of therapeutic follow-up. Simple—although not ideal—correction methods are already applicable to substantially reduce the biases introduced by PVE. Until a widely accepted method is routinely available, great care must be taken to standardize acquisition, processing, and analysis.
Acknowledgments
The authors thank Kevin Teo for testing his deconvolution method (30) on our data.
Footnotes
-
↵* NOTE: FOR CE CREDIT, YOU CAN ACCESS THIS ACTIVITY THROUGH THE SNM WEB SITE (http://www.snm.org/ce_online) THROUGH JUNE 2008.
-
No potential conflict of interest relevant to this article was reported.
-
COPYRIGHT © 2007 by the Society of Nuclear Medicine, Inc.
References

- Received for publication October 9, 2006.
- Accepted for publication March 20, 2007.


Jump to section
Related Articles
Cited By...
- Prevalence and Medium-Term Outcomes of Patients with Biopsy-Proven Intermediate- to High-Risk Prostate Adenocarcinoma with Low Intraprostatic Uptake on [68Ga]Ga-PSMA-11 PET/CT in the proPSMA Study
- MIRD Pamphlet No. 32: A MIRD Recovery Coefficient Model for Resolution Characterization and Shape-Specific Partial-Volume Correction
- Characterizing meniscal calcifications with photon counting-based dual-energy computed tomography
- Cardiac Neuroendocrine Tumor Metastases on 68Ga-DOTATATE PET/CT: Identification and Prognostic Significance
- ISIT-QA: In Silico Imaging Trial to Evaluate a Low-Count Quantitative SPECT Method Across Multiple Scanner-Collimator Configurations for 223Ra-Based Radiopharmaceutical Therapies
- Impact of PET Reconstruction on Amyloid-{beta} Quantitation in Cross-Sectional and Longitudinal Analyses
- Artificial Intelligence for PET and SPECT Image Enhancement
- Long Versus Short Axial Field of View Immuno-PET/CT: Semiquantitative Evaluation for 89Zr-Trastuzumab
- Inter-scanner A{beta}-amyloid PET harmonization using barrel phantom spatial resolution matching
- Impact of PET reconstruction on A{beta}-amyloid quantitation in cross-sectional and longitudinal analyses
- 68Ga-PSMA PET/CT-Based Atlas for Prostate Bed Recurrence After Radical Prostatectomy: Clinical Implications for Salvage Radiation Therapy Contouring Guidelines
- Hot Spot Imaging in Cardiovascular Diseases: An Information Statement from SNMMI, ASNC, and EANM
- A Guide to ComBat Harmonization of Imaging Biomarkers in Multicenter Studies
- Investigating the in vivo biodistribution of extracellular vesicles isolated from various human cell sources using positron emission tomography
- MRI-based 3D retinal shape determination
- Semiautomatic Tumor Delineation for Evaluation of 64Cu-DOTATATE PET/CT in Patients with Neuroendocrine Neoplasms: Prognostication Based on Lowest Lesion Uptake and Total Tumor Volume
- Accuracy Assessment of SUV Measurements in SPECT/CT: A Phantom Study
- Converting an Anti-Mouse CD4 Monoclonal Antibody into an scFv Positron Emission Tomography Imaging Agent for Longitudinal Monitoring of CD4+ T Cells
- Optimization of Number of Iterations as a Reconstruction Parameter in Bone SPECT Imaging Using a Novel Thoracic Spine Phantom
- Multicenter Study of Quantitative SPECT: Reproducibility of 99mTc Quantitation Using a Conjugated-Gradient Minimization Reconstruction Algorithm
- Have Volume-based Parameters of Positron Emission Tomography/Computed Tomography Prognostic Relevance for Patients With Potentially Platinum-responsive Recurrent Ovarian Cancer? A Single Center Italian Study
- Total nodule number is an independent prognostic factor in resected stage III non-small cell lung cancer: a deep learning powered study
- Semiautomatically Quantified Tumor Volume Using 68Ga-PSMA-11 PET as a Biomarker for Survival in Patients with Advanced Prostate Cancer
- Radiomics Features of 18F-fluorodeoxyglucose Positron-Emission Tomography as a Novel Prognostic Signature in Colorectal Cancer
- 18F-DCFPyL PET/CT in Patients with Subclinical Recurrence of Prostate Cancer: Effect of Lesion Size, Smoothing Filter, and Partial-Volume Correction on PROMISE Criteria
- Performance of Digital PET Compared with High-Resolution Conventional PET in Patients with Cancer
- Assessing PET Parameters in Oncologic 18F-FDG Studies
- Revisiting Weight-Normalized SUV and Lean-Body-Mass-Normalized SUV in PET Studies
- Head-to-Head Comparison of 68Ga-DOTA-JR11 and 68Ga-DOTATATE PET/CT in Patients with Metastatic, Well-Differentiated Neuroendocrine Tumors: A Prospective Study
- Standardization of Preclinical PET/CT Imaging to Improve Quantitative Accuracy, Precision, and Reproducibility: A Multicenter Study
- 18Fluorodeoxyglucose Accumulation in Arterial Tissues Determined by PET Signal Analysis
- Assessing 18F-FDG Uptake in the Sentinel Lymph Node in Breast Cancer
- The Influence of Minimal Misalignment on the Repeatability of PET Images Examined by the Repositioning of Point Sources
- Time-of-Flight Information Improved the Detectability of Subcentimeter Spheres Using a Clinical PET/CT Scanner
- Generation of Structural MR Images from Amyloid PET: Application to MR-Less Quantification
- Targeting CXCR4 (CXC Chemokine Receptor Type 4) for Molecular Imaging of Aldosterone-Producing Adenoma
- Androgen and Estrogen Receptor Imaging in Metastatic Breast Cancer Patients as a Surrogate for Tissue Biopsies
- Mapping of human brown adipose tissue in lean and obese young men
- Rigor and Reproducibility in Analysis of Vascular Calcification
- Associations Between Somatic Mutations and Metabolic Imaging Phenotypes in Non-Small Cell Lung Cancer
- Baseline Metabolic Tumor Volume Predicts Outcome in High-Tumor-Burden Follicular Lymphoma: A Pooled Analysis of Three Multicenter Studies
- Accuracy and Precision of Partial-Volume Correction in Oncological PET/CT Studies
- Partial-Volume Effect Correction Improves Quantitative Analysis of 18F-Florbetaben {beta}-Amyloid PET Scans
- An Effective Immuno-PET Imaging Method to Monitor CD8-Dependent Responses to Immunotherapy
- SUVpeak Performance in Lung Cancer: Comparison to Average SUV from the 40 Hottest Voxels
- Primary tumour standardised uptake value is prognostic in nonsmall cell lung cancer: a multivariate pooled analysis of individual data
- Targeting CD146 with a 64Cu-labeled antibody enables in vivo immunoPET imaging of high-grade gliomas
- Estimation of Tumor Volumes by 11C-MeAIB and 18F-FDG PET in an Orthotopic Glioblastoma Rat Model
- Relationship Between 18F-FDG PET/CT Scans and KRAS Mutations in Metastatic Colorectal Cancer
- Influence of Statistical Fluctuation on Reproducibility and Accuracy of SUVmax and SUVpeak: A Phantom Study
- Multimodal Partial-Volume Correction: Application to 18F-Fluoride PET/CT Bone Metastases Studies
- Immuno-PET of Murine T Cell Reconstitution Postadoptive Stem Cell Transplantation Using Anti-CD4 and Anti-CD8 Cys-Diabodies
- Localization of Hidden Insulinomas with 68Ga-DOTA-Exendin-4 PET/CT: A Pilot Study
- [18F]-Fluorodeoxyglucose Positron Emission Tomography Standardized Uptake Value as a Predictor of Adjuvant Chemotherapy Benefits in Patients With Nasopharyngeal Carcinoma
- Variability and Uncertainty of 18F-FDG PET Imaging Protocols for Assessing Inflammation in Atherosclerosis: Suggestions for Improvement
- Metabolic PET/CT-Guided Lung Lesion Biopsies: Impact on Diagnostic Accuracy and Rate of Sampling Error
- Improving the Detection of Small Lesions Using a State-of-the-Art Time-of-Flight PET/CT System and Small-Voxel Reconstructions
- Effects of Intratumoral Inflammatory Process on 18F-FDG Uptake: Pathologic and Comparative Study with 18F-Fluoro-{alpha}-Methyltyrosine PET/CT in Oral Squamous Cell Carcinoma
- Clinical translation of an ultrasmall inorganic optical-PET imaging nanoparticle probe
- A Compartmental Model of Mouse Thrombopoiesis and Erythropoiesis to Predict Bone Marrow Toxicity After Internal Irradiation
- Glypican-3-Targeted 89Zr PET Imaging of Hepatocellular Carcinoma
- Prognostic Value of Metabolic Parameters in Patients with Synchronous Colorectal Cancer Liver Metastasis Following Curative-Intent Colorectal and Hepatic Surgery
- Quantitative ImmunoPET of Prostate Cancer Xenografts with 89Zr- and 124I-Labeled Anti-PSCA A11 Minibody
- The Effect of Small Tumor Volumes on Studies of Intratumoral Heterogeneity of Tracer Uptake
- Outcome Analysis of 18F-Fluorodeoxyglucose Positron-Emission Tomography in Patients with Lung Cancer After Partial Volume Correction
- Pre-clinical Validation of Orthotopically-implanted Pulmonary Tumor by Imaging with 18F-Fluorothymidine-Positron Emission Tomography/Computed Tomography
- Variability of Total Lesion Glycolysis by 18F-FDG-Positive Tissue Thresholding in Lung Cancer
- Combination of 18F-FDG PET/CT and Diffusion-Weighted MR Imaging as a Predictor of Histologic Response to Neoadjuvant Chemotherapy: Preliminary Results in Osteosarcoma
- Early Dynamic 18F-FDG PET to Detect Hyperperfusion in Hepatocellular Carcinoma Liver Lesions
- Subcentimeter Tumor Lesion Delineation for High-Resolution 18F-FDG PET Images: Optimizing Correction for Partial-Volume Effects
- Effect of Reconstruction Parameters in High-Definition PET/CT on Assessment of Lymph Node Metastases in Head and Neck Squamous Cell Carcinoma
- MR Imaging-Based Correction for Partial Volume Effect Improves Detectability of Intractable Epileptogenic Foci on Iodine 123 Iomazenil Brain SPECT Images: An Extended Study with a Larger Sample Size
- 18F-FDG Uptake by Metastatic Axillary Lymph Nodes on Pretreatment PET/CT as a Prognostic Factor for Recurrence in Patients with Invasive Ductal Breast Cancer
- Clinical PET of Neuroendocrine Tumors Using 64Cu-DOTATATE: First-in-Humans Study
- Prognostic PET 18F-FDG Uptake Imaging Features Are Associated with Major Oncogenomic Alterations in Patients with Resected Non-Small Cell Lung Cancer
- Noise Considerations for PET Quantification Using Maximum and Peak Standardized Uptake Value
- Relationship between 18F-Fluorodeoxyglucose Accumulation and KRAS/BRAF Mutations in Colorectal Cancer
- Large Decreases in Standardized Uptake Values After Definitive Radiation Are Associated with Better Survival of Patients with Locally Advanced Non-Small Cell Lung Cancer
- Impact of Partial-Volume Effect Correction on the Predictive and Prognostic Value of Baseline 18F-FDG PET Images in Esophageal Cancer
- 18F-Fluorodeoxy-glucose Positron Emission Tomography Marks MYC-Overexpressing Human Basal-Like Breast Cancers
- Value of 4-Dimensional 18F-FDG PET/CT in the Classification of Pulmonary Lesions
- 18F-FDG PET/CT for the Prediction and Detection of Local Recurrence After Radiofrequency Ablation of Malignant Lung Lesions
- 18F-FLT PET as a Surrogate Marker of Drug Efficacy During mTOR Inhibition by Everolimus in a Preclinical Cisplatin-Resistant Ovarian Tumor Model
- Kinetic Analysis of 18F-Fluoride PET Images of Breast Cancer Bone Metastases
- SUV: From Silly Useless Value to Smart Uptake Value
- Comparative Assessment of Methods for Estimating Tumor Volume and Standardized Uptake Value in 18F-FDG PET
- In Vivo Tumor Grading of Prostate Cancer Using Quantitative 111In-Capromab Pendetide SPECT/CT
- Standards for PET Image Acquisition and Quantitative Data Analysis
- One Step Closer to Imaging Vulnerable Plaque in the Coronary Arteries