


Abstract
Structural MR images concomitantly acquired with PET images can provide crucial anatomic information for precise quantitative analysis. However, in the clinical setting, not all the subjects have corresponding MR images. Here, we developed a model to generate structural MR images from amyloid PET using deep generative networks. We applied our model to quantification of cortical amyloid load without structural MR. Methods: We used florbetapir PET and structural MR data from the Alzheimer Disease Neuroimaging Initiative database. The generative network was trained to generate realistic structural MR images from florbetapir PET images. After the training, the model was applied to the quantification of cortical amyloid load. PET images were spatially normalized to the template space using the generated MR, and then SUV ratio (SUVR) of the target regions was measured by predefined regions of interest. A real MR-based quantification was used as the gold standard to measure the accuracy of our approach. Other MR-less methods—a normal PET template–based, a multiatlas PET template–based, and a PET segmentation–based normalization/quantification—were also tested. We compared the performance of quantification methods using generated MR with that of MR-based and MR-less quantification methods. Results: Generated MR images from florbetapir PET showed signal patterns that were visually similar to the real MR. The structural similarity index between real and generated MR was 0.91 ± 0.04. The mean absolute error of SUVR of cortical composite regions estimated by the generated MR-based method was 0.04 ± 0.03, which was significantly smaller than other MR-less methods (0.29 ± 0.12 for the normal PET template, 0.12 ± 0.07 for the multiatlas PET template, and 0.08 ± 0.06 for the PET segmentation–based methods). Bland–Altman plots revealed that the generated MR-based SUVR quantification was the closest to the SUVRs estimated by the real MR-based method. Conclusion: Structural MR images were successfully generated from amyloid PET images using deep generative networks. Generated MR images could be used as templates for accurate and precise amyloid quantification. This generative method might be used to generate multimodal images of various organs for further quantitative analyses.
The anatomic information of structural MR can help quantitative analysis of PET as well as provide detailed anatomic structures for functional images (1,2). Despite this usefulness, not all subjects have both PET and MR images in the clinical setting. For instance, either amyloid PET or structural MR could be acquired for subjects suspected of having cognitive decline in the clinic. In terms of quantitative analysis of PET, lack of structural information limits segmentation and accurate quantification.
Several imaging biomarkers were developed to characterize Alzheimer disease (AD) or to predict cognitive decline in mild cognitive impairment (MCI). In particular, on amyloid PET such as 11C-Pittsburgh compound B and 18F-florbetapir PET, a core pathologic marker, cortical amyloid deposition, can be quantitatively measured (3,4). Cortical amyloid load has been commonly quantified using SUV ratio (SUVR) between target and reference regions (3,5). In this quantification endeavor, accurate region segmentation is crucial for these regions, and structural MR has been used for the delineation of these regions (6–8). Typically, these methods have used MR for spatial normalization to template space and regional segmentation. The MR-based processing can be applied to the amyloid PET to measure the target and reference uptake of the radiotracers. Instead of structural MR, a PET template without MR has been attempted by direct spatial normalization to the PET template (9); however, this simpler trial resulted in biased estimation of SUVR. To overcome this bias, multiple PET template–based processing was developed for MR-less quantification. The method chose a PET template most similar to the subject’s image for normalization (10,11).
Until now, direct generation of structural MR from PET imaging has not yet been attempted. Because PET images have relatively low spatial resolution compared with structural MR, it has been challenging to directly generate mapping from PET to MR. In this study, we developed a model for generating structural MR images from amyloid PET. This model was trained by pairs of amyloid PET and MR images of AD and MCI patients and normal controls. We applied this model to the quantification of cortical amyloid load without structural MR and compared this method with the MR-based quantification as a gold standard. Furthermore, other MR-less quantification methods were also compared.
MATERIALS AND METHODS
Patient Population
In this study, image data were collected from the Alzheimer Disease Neuroimaging Initiative (ADNI) (http://adni.loni.usc.edu) database. The ADNI was launched in 2003 as a public–private partnership, led by Principal Investigator Michael W. Weiner, MD, VA Medical Center and University of California San Francisco. ADNI included subjects from more than 50 sites across the United States and Canada. The primary goal of ADNI has been to develop combined biomarkers by testing whether serial imaging and biologic markers and clinical and neuropsychologic assessment can be combined to measure the progression of MCI and early AD. For up-to-date information, see http://www.adni-info.org.
Two hundred sixty-one subjects who underwent both florbetapir PET and structural MR as baseline studies were included for this study. Test set data were independent from the training data to develop and validate the model that was generally compatible with various scanners at different sites. Thus, we divided the subsets according to image acquisition sites. Image data of training set were obtained from 10 sites, and those of the test set were obtained from 8 sites different from the training set. One hundred sixty-three pairs of PET and MR images were used for the training, and 98 pairs of the images were used for the independent test set. The institutional review boards of all participating institutions approved imaging studies, and all participants signed a written informed consent form. Demographics and baseline clinical diagnosis of the subjects are summarized in Table 1.
Demographics and Clinical Diagnosis of Training and Test Dataset
Image Preprocessing for Generative Model
Florbetapir PET images were downloaded with minimally preprocessed data to develop the generative model compatible with the image data acquired from various sites. The raw image data consisted of four 5-min frames 50–70 min after injection. We used the data of averaged images of all the 4 registered frames (12). Structural T1 images acquired concurrently with the baseline florbetapir images were used. High resolution 3-dimensional T1 images were acquired in the sagittal plane.
Because the images were acquired from different sites, they have different matrix sizes as well as orientations. The voxel size of axial slices ranged from 1.02 × 1.02 to 2.57 × 2.57 mm, and slice thickness ranged from 1.02 to 4.25 mm. Preprocessing was performed to fit the voxel size for the generative model; thus, the model used minimally processed PET images of different scanners without normalization. To train the generative model, PET images were coregistered to corresponding MR images using rigid transformation under statistical parametric mapping (SPM8, www.fil.ion.ucl.ac.uk/spm). For PET images of the test set, coregistration was not performed. We resliced the images to have the same voxel and matrix sizes. Voxel size of the resliced PET and MR images was 1.2 × 1.0 × 1.0 mm3. The matrix size of an axial slice of resliced images was 192 × 256. For the training data, axial slices of MR images out of range of PET scans were replaced by zero. After the reslicing, voxel values of PET and MR volumes of each subject were adjusted in the range of −1 to 1. Thus, the input image of the generative model was resliced PET images, which have different orientations but same matrix size.
Adversarial Training for MR Image Generative Model
The MR generation model was based on image-to-image translation using the GAN model (13). The model has 2 convolutional neural networks, generator, and discriminator (Fig. 1). The generator is trained to translate PET to MR images, which cannot be discriminated from real MR. The discriminator is trained to discriminate real MR from generated MR by the generator. This adversarial training results in realistic MR image generation. Axial slices of coregistered PET and MR images were used for the training. The total axial slices for the training process were 32,659 images. For the independent test and application to the quantitation of amyloid load, MR images of the test set, which included 98 subjects recruited from 8 sites different from training data, were generated by corresponding PET images. Detailed methods and architectures of neural networks are described in the supplemental materials, and in Supplemental Tables 1 and 2 (supplemental materials are available at http://jnm.snmjournals.org).

Adversarial training for MR generation network. GAN consists of multiple convolutional and deconvolutional layers to translate florbetapir PET to structural MR images. Training of network was aimed at generating MR images, which cannot be distinguished from real images. In contrast, another discriminator network was trained to distinguish real MR from generated MR images. They competed in entire training process.
Quantification of Amyloid Load
Cortical amyloid load was quantified for normalized florbetapir PET images of the test set. We compared the quantification results according to the different methods (Fig. 2). As a standard method, MR of each subject was segmented into gray matter (GM), white matter, and cerebrospinal fluids after image-intensity nonuniformity correction, and then nonlinear transformation parameters were calculated between the tissues of native space and the Montreal Neurologic Institute. The transformation was applied to the corresponding PET image. We applied the same normalization methods for generated MR.
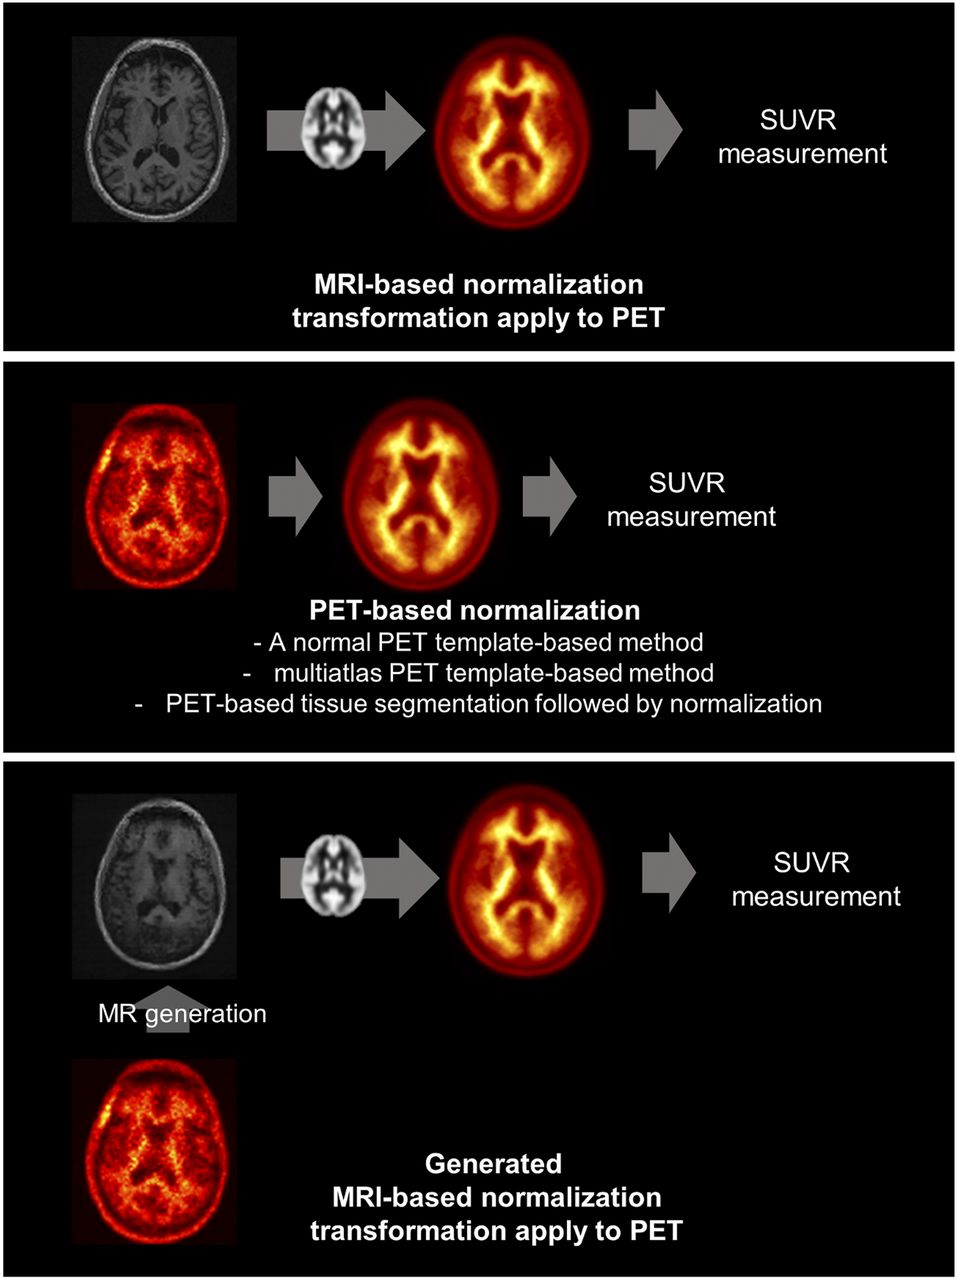
Amyloid PET quantification using different methods. We applied MR generation model to quantification of amyloid PET. As gold standard method, MR-based normalization was used. PET images were coregistered to corresponding MR and then nonrigid transformation of MR was performed for spatial normalization. Predefined cortical and reference regions were used for calculating SUVR. For normal PET template–based method, averaged florbetapir PET images of normal controls were used as template, and then all PET images were directly normalized to this template. Multiatlas PET template–based quantification chose PET template most similar to a subject’s PET image among various PET templates with different tracer uptake patterns, and then images were normalized to selected templates. In addition, as modified method, PET was directly used for tissue segmentation and segmented tissues were normalized into template space. As application of our GAN model, generated MR images were spatially normalized to MR template, and corresponding PET images were transformed to template space. We compared SUVRs measured by these 4 different normalization methods.
As an MR-less quantification method, PET template–based normalization, using a normal PET template or multiatlas PET template, was also performed. Normal subjects’ PET templates were generated by the MR-based normalized PET images of normal controls. All subjects’ PET images of native spaces were spatially normalized into the PET template. As a modified MR-less quantification method, multiatlas normalization was adopted as a Web-based tool, Capaibl (https://capaibl-milxcloud.csiro.au/) (11,14). Briefly, this method chose the best template among multiple PET templates by calculating similarity, and then a subject’s PET image was registered to the normalized space. As another modified method, amyloid PET of each subject was used for tissue segmentation by directly inputting PET instead of MR for the tissue segmentation algorithm of SPM8 and then nonlinear transformation was performed.
After normalization comprising these 5 methods, authentic MR-based, generated MR-based, a normal PET template–based, multiatlas PET template–based, and PET segmentation-based, cortical uptake (SUVR) was scaled using the GM-masked cerebellum defined by automated anatomic labeling map. A template GM mask of SPM8 was identically applied regardless of normalization methods. Composite cortical SUVRs were computed using the mean SUVR in the GM-masked region consisting of the frontal, superior parietal, lateral temporal, and anterior and posterior cingulate regions. As uptake in specific regions, frontal, cingulate, superior parietal, and lateral temporal SUVRs were also obtained and compared.
Statistics
To measure the similarity between generated MR and real MR, the structural similarity (SSIM) index was calculated (15). where μ and σ represent mean and SD of image x and y.
  and
and  represent 2 constant variables determined by pixel-value range. SSIM can have a value between −1 and 1, and SSIM = 1 means that 2 images are the same. Because PET and MRI have different fields of-view, tissues outside the brain are differently included in generated and real MR. Thus, SSIM was measured for the extracted brain of both images. One-way ANOVA was conducted to compare the effect of subjects’ diagnosis on SSIM.
SUVRs of MR-less methods were compared with those of authentic MR-based methods using the paired t test. Mean absolute errors (MAEs) of SUVR for each MR-less method were calculated using the MR-based method as a gold standard. MAEs of different methods were compared using the paired t test. Bland–Altman plots were drawn to evaluate the agreement between MR-less and MR-based methods.
RESULTS
Our model generated structural MR images using amyloid PET images. The processing time for a subject was approximately 11 s under GPU (GTX 1080Ti; NVIDIA) and 49 s under CPU (i7-7700; Intel). The examples of generated MR images are represented in Figure 3. The generated MR image had signal intensity patterns similar to those of real MR. Note that generated MR images could be obtained in both AD patients and normal subjects regardless of various tracer uptake patterns. Overall, SSIM was 0.91 ± 0.04 (range, 0.77–0.98) for the brain. Subjects’ diagnosis had no effect on SSIM (0.91 ± 0.04, 0.92 ± 0.04, and 0.91 ± 0.04 for AD, MCI, and normal controls, respectively; F2,97 = 0.68, P = 0.52).

Examples of generated MR images. After training, MR images were generated from amyloid PET images of independent test set. Regardless of subjects’ diagnosis, MR images were generated, and signal patterns similar to corresponding real MR images were observed. Quantitative similarity measured by structural similarity index measurement between real and generated brain was 0.91 ± 0.04.
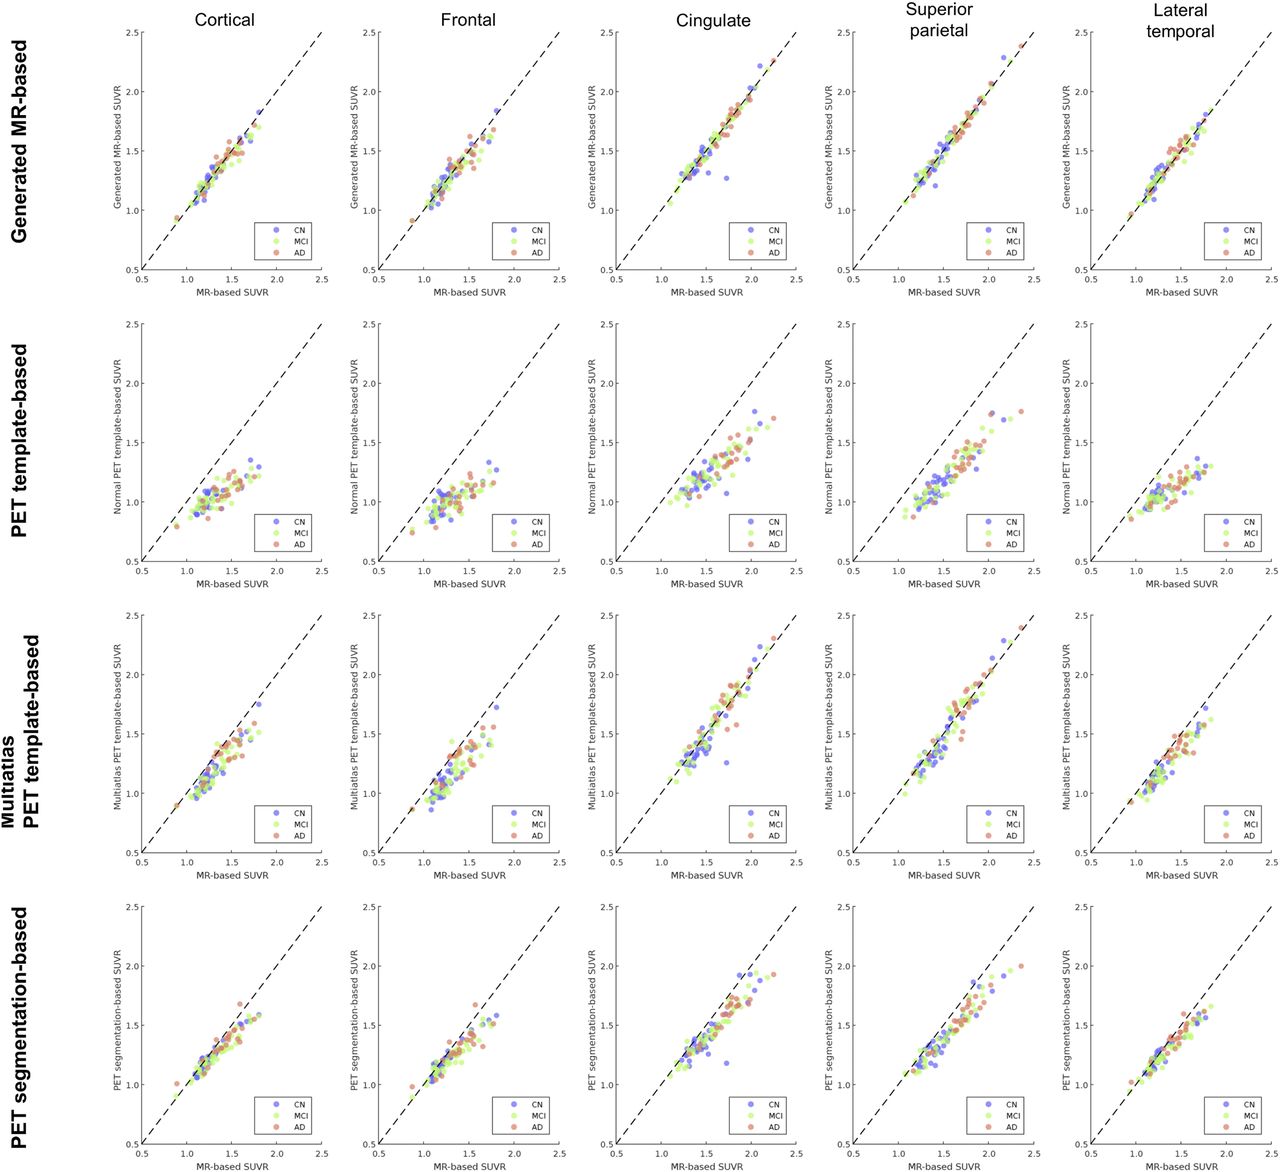
We applied this model to the quantitative assessment of amyloid PET images. We compared the quantification of cortical amyloid load using different normalization methods. MAEs of MR-less methods were computed using the MR-based method as a gold standard (Table 2). The MAE of SUVR of composite regions estimated by the generated MR-based method was 0.04 ± 0.03, which was significantly smaller than other MR-less methods (0.29 ± 0.12 for the normal PET template–, 0.12 ± 0.07 for multiatlas PET template–, and 0.08 ± 0.06 for PET segmentation–based methods). MAEs of generated MR-based methods for other regions of interest were significantly lower than other methods (P < 0.0001 for all regions). SUVRs calculated by MR-based and MR-less methods for each subject were plotted (Fig. 4). Bland–Altman plots were also drawn to compare the methods (Supplemental Fig. 1). As shown in the figures, SUVRs of generated MR-based method most highly corresponded to those of the MR-based method, whereas PET-based methods (normal template–based, multiatlas-based, and PET segmentation–based) showed relatively higher errors and biases. In particular, normal PET template–based and PET segmentation–based methods showed higher bias when a subject had AD. The multiatlas-based method showed less bias than the normal PET template–based method; however, it still tended to underestimate SUVRs. SUVRs of different regions calculated by these 5 different methods were compared (Table 3). The normal PET template–based and PET segmentation–based methods showed significant underestimation compared with MR-based methods regardless of subjects’ diagnosis as well as cortical regions of interest. The multiatlas PET template–based method also showed significantly lower SUVRs in composite cortical, frontal, and lateral temporal regions. SUVRs calculated by the generated MR-based method showed no significant difference with the gold standard in most brain regions of interest.
Errors of SUVR of Florbetapir Measured by MR-Less Methods

Scatterplots of SUVRs calculated by different normalization methods. SUVRs measured by MR-less methods were compared with MR-based quantification results. Generated MR-based SUVR quantification results were highly correlated with MR-based quantification results. However, normal PET template–based method showed biased results. Multiatlas PET template–based and PET segmentation–based methods showed less biased results than normal PET template–based method, however, relatively higher error than generated MR-based method. CN = controls.
SUVR of Cortical Florbetapir PET Measured by Different Methods
DISCUSSION
The MR generation from PET is challenging because PET has relatively less structural and textural information than MR. We used a recently developed deep neural network model, GAN (16). In brief, GAN typically has 2 network components, a generator and discriminator. The generator is trained to estimate mapping of realistic images from a few feature vectors with particular distribution, and the discriminator is trained to discriminate between true and generated data. In our approach, we used the network translating PET images to MR images as the generator component. Generated MR was paired with the matched PET and entered into the discriminator. This type of image translation based on the adversarial training was recently reported for generating realistic images from image sketches (13). The image translation could be useful in medical images because multimodal images have provided different information. We extended this image translation method to MR generation from PET and suggested a clinically feasible application to MR-less amyloid quantification.
Accurate cortical amyloid quantification is crucial in AD diagnosis as well as for predicting future cognitive decline in MCI and early dementia patients (17). A simple normal PET template–based normalization resulted in considerable bias in SUVR calculation. AD patients showed underestimated SUVR compared with MR-based methods, which corresponded to the previous result (9). This bias could be caused by nonrigid registration error as it used intensity-based registration. For AD patients, high florbetapir uptake in the cortex tends to shift to the white matter of the template atlas during normalization, which could lead to the underestimation (9). The biased results were much less in multiatlas PET template–based and PET segmentation–based methods; however, they also showed a trend of underestimation. The generated MR-based method was highly correlated with real MR-based normalization results as well as unbiased. Bland–Altman plots showed that SUVR measured by the generated MR-based method was the closest to SUVR of MR-based method. The deviation of SUVR from the MR-based SUVR was also lower than the other methods. In addition, MAEs of the generated MR-based method were significantly lower than those of other methods. The accurate MR-less quantification method enables the use of PET data without MR for large clinical trials, and it can be used clinically as a quantitative marker for predicting cognitive outcome.
Though the amyloid load was variable according to the subjects’ diagnosis and the regions of interest, our model could generate pseudo–MR images irrespective of the uptake patterns. This is a crucial advantage of our GAN method in PET image quantification because common spatial normalization algorithms are used in intensity-based nonrigid transformation (18). As aforementioned, when regional tracer uptake is variable between regions and between individuals according to the disease status, the normalization based on intensity-based nonrigid transformation could cause seriously biased results. Other examples were reported when the investigators applied normalization for dopamine transporter imaging; the results were biased in severe patients (19,20). Quantification of tracer accumulation using generated MR could substantially overcome these biases. Furthermore, our GAN model could be trained for a variety of other PET imaging, and the generated MR images could be easily used for further spatial normalization and region segmentation. We think that this GAN method might be also used for quantitative analysis of other organs. Several unsolved problems in multimodal imaging can be solved with this GAN method. For example, MR generation could be applied to lesion segmentation in cancer imaging and CT generation could be used for attenuation correction without real CT images (21). It could be also used in partial-volume correction without anatomic images (22,23). As a future work, various validation studies are warranted by the application of a generative network model to multimodal imaging.
Despite promising quantification results in our proposed GAN model, there are some limitations. Even though our model could generate realistic MR images, they could not reach the quality of the real MR images. Generated MR images tended to be blurred, making it difficult to visually distinguish between gray and white matter. Specifically, several generated MR images showed artifacts and inhomogeneous intensity across the brain (Supplemental Fig. 2). These artifacts could be caused by GAN, which tends to generate noisy images compared with other generative models. In addition, model learning based on patches instead of a whole image may cause inhomogeneous signal intensity. Therefore, in terms of amyloid load quantification, the benefit of generated MR could be a rough tissue segmentation for spatial normalization instead of definite brain tissue contrast. Nonetheless, as the direct PET segmentation–based method showed significant bias for the quantification, the generated MR seemed to play a role in accurate MR-less processing. Further modification in network architectures and training processes might improve the image quality in the near future. In addition, our model was optimized for the training dataset, which limits the use of the generated MR images in the patients with seriously distorted architecture such as tumors or large tissue losses. Because the training dataset in our study included all the subjects with various amounts of amyloid deposit and brain atrophy, MR generation for this clinically observed spectrum of florbetapir PET would be feasible. Another strength of this model was the compatibility of PET images obtained by various scanners as training was performed by minimally processed images acquired from various sites. We reiterate that MR generation was successfully achieved in the test set regardless of PET images of different image quality that were due to various machines. Thus, we expect that our model could be applied to another florbetapir PET database. As a further work, the GAN model could be applied to prospectively acquired PET images other than those in the ADNI database to establish the generalized use of this method.
CONCLUSION
We developed a model for generating structural MR from florbetapir PET using deep generative networks. Generated brain MR images were similar to real MR images, and they were successfully applied to MR-less quantification of cortical amyloid load. Cortical florbetapir uptake measured using generated MR was the closest to that measured using real MR among MR-less quantification methods. Because our model generating MR from brain PET and application to PET quantification is one of the most feasible applications for the image generation, we expect that the model will be used for various imaging modalities as well as applications for developing quantitative imaging biomarkers.
DISCLOSURE
This research was supported by the National Research Foundation of Korea (NRF) grant funded by the Korean government (MSIP) (no. 2017M3C7A1048079). This research was also supported by a grant of the Korea Health Technology R&D Project through the Korea Health Industry Development Institute (KHIDI), funded by the Ministry of Health & Welfare, Republic of Korea (HI14C0466), and funded by the Ministry of Health & Welfare, Republic of Korea (HI14C3344), and funded by the Ministry of Health & Welfare, Republic of Korea (HI14C1277), and the Technology Innovation Program (10052749). Data collection and sharing for this project was funded by the Alzheimer's Disease Neuroimaging Initiative (ADNI) (National Institutes of Health grant U01 AG024904) and DOD ADNI (Department of Defense award number W81XWH-12-2-0012). ADNI is funded by the National Institute on Aging, the National Institute of Biomedical Imaging and Bioengineering, and through generous contributions from the following: AbbVie, Alzheimer’s Association; Alzheimer’s Drug Discovery Foundation; Araclon Biotech; BioClinica, Inc.; Biogen; Bristol-Myers Squibb Company; CereSpir, Inc.;Eisai Inc.; Elan Pharmaceuticals, Inc.; Eli Lilly and Company; EuroImmun; F. Hoffmann-La Roche Ltd. and its affiliated company Genentech, Inc.; Fujirebio; GE Healthcare; IXICO Ltd.; Janssen Alzheimer Immunotherapy Research & Development, LLC; Johnson & Johnson Pharmaceutical Research & Development LLC; Lumosity; Lundbeck; Merck & Co., Inc.; Meso Scale Diagnostics, LLC; NeuroRx Research; Neurotrack Technologies; Novartis Pharmaceuticals Corporation; Pfizer Inc.; Piramal Imaging; Servier; Takeda Pharmaceutical Company; and Transition Therapeutics. The Canadian Institutes of Health Research is providing funds to support ADNI clinical sites in Canada. Private sector contributions are facilitated by the Foundation for the National Institutes of Health (www.fnih.org). The grantee organization is the Northern California Institute for Research and Education, and the study is coordinated by the Alzheimer's Disease Cooperative Study at the University of California, San Diego. ADNI data are disseminated by the Laboratory for Neuro Imaging at the University of Southern California. No other potential conflict of interest relevant to this article was reported.
Acknowledgments
Data used in preparation of this article were obtained from the Alzheimer’s Disease Neuroimaging Initiative (ADNI) database (adni.loni.usc.edu). As such, the investigators within the ADNI contributed to the design and implementation of ADNI and/or provided data but did not participate in analysis or writing of this report. A complete listing of ADNI investigators can be found at: http://adni.loni.usc.edu/wp-content/uploads/how_to_apply/ADNI_Acknowledgment_List.pdf
Footnotes
Published online Dec. 7, 2017.
- © 2018 by the Society of Nuclear Medicine and Molecular Imaging.
REFERENCES
- Received for publication July 18, 2017.
- Accepted for publication November 15, 2017.


Jump to section
Related Articles
Cited By...
- Improving 18F-FDG PET Quantification Through a Spatial Normalization Method
- Evaluating Biases and Quality Issues in Intermodality Image Translation Studies for Neuroradiology: A Systematic Review
- Fast and Accurate Amyloid Brain PET Quantification Without MRI Using Deep Neural Networks
- Deep learning for in vivo near-infrared imaging
- Artificial Intelligence in Nuclear Medicine