


Abstract
Targeting the mammalian target of rapamycin (mTOR) pathway is a potential means of overcoming cisplatin resistance in ovarian cancer patients. Because mTOR inhibition affects cell proliferation, we aimed to study whether 3′-deoxy-3′-18F-fluorothymidine (18F-FLT) PET could be useful for monitoring early response to treatment with mTOR inhibitors in an animal model of cisplatin-resistant ovarian tumor. Methods: BALB/c nude mice bearing subcutaneous human SKOV3 ovarian cancer xenografts were treated with either the mTOR inhibitor everolimus (5 mg/kg) or vehicle, and 18F-FLT PET was performed at baseline, day 2, and day 7 of treatment. 18F-FLT uptake was evaluated by calculation of mean standardized uptake value (SUVmean) corrected for partial-volume effect. Ex vivo immunohistochemistry studies were performed on separate cohorts of mice treated as above and sacrificed at the same time points as for the PET studies. The ex vivo analysis included bromodeoxyuridine incorporation as a marker of cell proliferation, and phosphorylation of ribosomal protein S6 as a downstream marker of mTOR activation. Results: During the treatment period, no significant change in tumor 18F-FLT uptake was observed in the vehicle group, whereas in everolimus-treated mice, 18F-FLT SUVmean decreased by 33% (P = 0.003) at day 2 and 66% (P < 0.001) at day 7, compared with baseline. Notably, the reduction of 18F-FLT uptake observed at day 2 in the everolimus group preceded changes in tumor volume, and a significant difference in 18F-FLT uptake was observed between vehicle and drug-treated tumors at both day 2 (P = 0.0008) and day 7 (P = 0.01). In ex vivo studies, everolimus treatment resulted in a 98% reduction in phosphorylated ribosomal protein S6 immunostaining at day 2 (P = 0.02) and 91% reduction at day 7 (P = 0.003), compared with the vehicle group. Bromodeoxyuridine incorporation was reduced by 65% at day 2 (not significant) and by 41% at day 7 (P = 0.02) in drug versus vehicle groups. Conclusion: Reduction in 18F-FLT uptake correlates well with the level of mTOR inhibition by everolimus in the SKOV3 ovarian tumor model. These data suggest that early treatment monitoring by 18F-FLT PET may be of use in future preclinical or clinical trials evaluating treatment of cisplatin-resistant ovarian tumors by mTOR inhibitors.
Ovarian cancer is the leading cause of death among gynecologic cancers, because disease has often already disseminated to the peritoneal cavity and lymph node stations at diagnosis. Despite optimal treatment, including debulking surgery and adjuvant or neoadjuvant chemotherapy with a platinum–paclitaxel combination, which yield response rates of over 80%, most of the patients will eventually relapse (1). The issue of platinum resistance may arise at the first relapse or later in the course of the disease, but the response rate to chemotherapy regimens will decrease at each subsequent relapse. There is therefore a need for new therapeutic strategies including molecularly targeted therapies to overcome this chemoresistance (2).
The phosphoinositide-3-kinase/AKT signaling pathway may be a potential target, because AKT regulates various cellular pathways promoting cell survival, cell proliferation, angiogenesis, and invasion. Among the downstream effectors of AKT is the mammalian target of rapamycin (mTOR) (3), which is inhibited by several molecules including rapamycin, temsirolimus (CCI-779; Wyeth) (4,5), and everolimus (RAD001; Novartis) (6). Everolimus has been shown to inhibit human ovarian cancer cell proliferation and to enhance the effect of cisplatin in vivo in an ovarian cancer xenograft model (7). Also, everolimus has been shown to delay tumor onset and progression in a transgenic mouse model of ovarian carcinoma (8).
PET imaging has been shown to be particularly useful for evaluating the efficacy of molecularly targeted therapies given either alone or in combination with conventional chemotherapies in preclinical studies (9,10). In clinical trials, PET can predict metabolic changes before tumor shrinkage, at a time when conventional imaging modalities and conventional criteria of evaluation (the criteria of the World Health Organization or the response evaluation criteria in solid tumors) are ineffective (11). PET may also be particularly useful in the field of molecularly targeted therapies, which often have a cytostatic effect.
The aim of the present study was to evaluate the ability of 3′-deoxy-3′-18F-fluorothymidine (18F-FLT), a PET probe for cell proliferation (12), to predict early response to everolimus in a mouse model of subcutaneously transplanted human cisplatin-resistant ovarian cancer.
MATERIALS AND METHODS
Cell Line Culture
SKOV-3 cells (National Institutes of Health), a human clear cell carcinoma cell line that is resistant to cisplatin, were grown in RPMI medium supplemented with 10% fetal calf serum, 1% L-glutamine, and 1% penicillin/streptomycin.
Animal Models
Six- to 10 wk-old nude mice (Animal Resources Centre) received a subcutaneous injection in the right hind limb of 10 × 106 SKOV-3 cells in 0.05 mL of 50% RPMI/Matrigel (BD Bioscience). To improve the tumor uptake rate, we gave the animals a single 2.5-Gy dose of whole-body irradiation 24 h before cell implantation.
The animals were allowed to feed ad libitum. Experiments were performed in accordance with the National Health and Medical Research Council code of practice for the care and use of animals for scientific purposes and with approval from the Peter MacCallum Cancer Centre Animal Experimentation Ethics Committee. At 4 wk after implantation (tumor volume ≈60 mm3), tumor-bearing animals were randomized into 2 groups and drug treatment commenced. Tumor volumes were estimated using the formula (greatest diameter × smallest diameter2)/2. The same experienced animal technician always performed caliper measurements.
Drug Preparation
Everolimus emulsion (provided by Novartis) was diluted in 5% glucose and administered orally once daily at 0.1 mL/10 g of body weight. Control animals received placebo emulsion diluted in glucose as above.
Study Design
Two cohorts of mice were used (Table 1). The first consisted of 14 mice (7 treated and 7 control), which were imaged by 18F-FLT PET at baseline, 2 d, and 7 d after daily treatment with everolimus (treated group) or vehicle (control group). The second cohort (15 mice) was used for correlative immunohistochemistry studies, 3 mice being sacrificed for tumor harvesting at baseline and 3 each control and drug-treated animals sacrificed at days 2 and 7 of treatment.
Details of the Experimental Design
Tracer Production
18F-FLT was prepared on the Tracerlab FXFN module (GE Healthcare) using the method described by Machulla et al. (13). Tracer purity was controlled by high-performance liquid chromatography, and ethanol concentration was always kept below 7%.
Small-Animal (SA) PET Examinations
SA PET examinations were performed on a Mosaic SA PET scanner (Philips). The resolution of this system is 2.7 mm at the center of the field of view (14). The energy window was 450–700 keV, and the coincidence-timing window was 6 ns. Data were acquired in 3-dimensional mode, corrected for decay and randoms. Acquisition time was 10 min per bed position. Reconstruction was performed with the 3-dimensional row-action maximum-likelihood algorithm (15). Attenuation correction was not applied.
SA PET calibration was performed as recommended by the manufacturer. Briefly, a 6-cm-diameter cylinder was filled with an 18F-FDG solution of known activity. The cylinder was dynamically scanned (20 frames) overnight. A circular region of interest encompassing the entire cylinder diameter was drawn on 4 consecutive transverse planes at the middle of the cylinder. The calibration factor was obtained by dividing the known radioactivity in the cylinder (MBq/mL) by the image region of interest (counts/pixel/s).
Animals were kept fasting for 3 h and were injected intravenously with an average activity of 15 MBq of 18F-FLT through a tail vein as described previously (10).
Quantification of Tracer Uptake
Tumor activity was obtained from a volume of interest (VOI) encompassing the entire lesion. VOIs were determined by means of an isocontour, which was set so that the VOI matched the apparent tumor volume on PET. This kind of VOI is warranted when one wants to correlate tracer uptake with immunochemistry with whole-histologic-section quantification, in order to take into account tumor heterogeneity. Mean standardized uptake value (SUVmean) was computed according to the following formula: SUVmean = (tumor activity [Bq/mL])/(injected activity [Bq]/animal weight [g]), assuming a density of 1 g/cm3. Maximum standardized uptake value (SUVmax) was also computed, using the same formula but with the maximum voxel value within the tumor VOI.
Because the use of VOI may lead to partial-volume effects (16), a correction for partial-volume effects was applied using recovery coefficients determined with a phantom study. A microDeluxe mouse-sized phantom (Data Spectrum Corp.) was used. This consisted of a cylinder (internal diameter, 4.5 cm; external diameter, 5 cm) containing fillable spheres. The fillable sphere diameters were 3.95, 4.95, 6.23, 7.86, and 9.89 mm, and their centers were on a single transaxial plane. Both cylinder and spheres were filled with an 18F-FDG solution with a background activity of 0.46 MBq/mL and sphere-to-background ratios of 5 and 2.5. Recovery coefficients, defined as the ratio between measured and true activity (16), as used previously in SA PET phantom and rat imaging (9,17), were computed. Measured activity, expressed in Bq/mL, was obtained from a region of interest, which was drawn in a transverse plane according to the sphere dimensions. Plots of recovery coefficient against sphere diameters were obtained, and curves were then fitted to obtain recovery coefficient as a function of sphere diameters. Radioactivity measurements on animal tumors were then corrected using the recovery coefficient values based on greatest tumor diameters, as measured by caliper the day of the SA PET examination.
Immunohistochemistry
Each mouse received a 100 mg/kg intraperitoneal injection of bromodeoxyuridine (BrdU), and 1 h later the tumors were harvested, fixed in formalin, and embedded in paraffin. Sections (4 μm) were stained for BrdU (catalog no. 347580; BD Biosciences) or phosphorylation of ribosomal protein S6 (pS6) (catalog no. 2211; Cell Signaling) using standard techniques in a Dako Autostainer, and sections were counterstained with hematoxylin. Quantification was performed using Meta Imaging series 7.6 software. For BrdU staining, 3 representative low-power images per section were analyzed for BrdU-positive cells, with the average positive cell count determined for the viable tumor. For pS6 staining, 3 representative low-power images per section were analyzed for integrated optical density (average intensity of positive staining per field) of areas of viable tumor (18).
Statistical Analysis
Data are presented as mean ± SD. The change in SUVmean over the different time points is reported as a percentage, compared with baseline, according to the following formula: change in SUVmean at day x = [(SUVmean at day x – SUVmean at baseline)/SUVmean at baseline] × 100. The change in BrdU or pS6 staining in the everolimus groups, compared with the vehicle group, at days 2 and 7 is defined as follows: [(mean immunohistochemistry quantitative value in everolimus group – mean immunohistochemistry quantitative value in vehicle group)/(mean immunohistochemistry quantitative value in vehicle group)] × 100.
The paired t test was used to compare tracer uptake in the same tumors over time, and the Student t test was used to compare tumor uptake, tumor volume, and immunohistochemistry quantitative data in the control and treated groups at specific time points. A 2-tailed P value of 0.05 or less was considered statistically significant. Statistical analyses were performed with MedCalc (MedCalc Software), and graphs and plots were performed with Prism (GraphPad Software).
RESULTS
Impact of Everolimus on Tumor Xenograft Growth
Tumor growth was monitored over 7 d of treatment with everolimus (Fig. 1A). In the vehicle group, tumor growth was observed from day 0 (64 ± 21 mm3) to day 2 (77 ± 27 mm3, P = 0.02) and day 7 (91 ± 20 mm3, P = 0.16), with a mean tumor volume doubling time of 8.7 ± 3.1 d. In the everolimus-treated group, tumor volume remained stable from day 0 (53 ± 17 mm3) to day 2 (60 ± 16 mm3, P = 0.63) and day 7 (54 ± 16 mm3, P = 0.13). No difference in tumor volumes between treated and vehicle mice was seen at day 2 (P = 0.16), but a statistically significant difference was observed at day 7 (P = 0.005), indicating that this model is responsive to mTOR inhibition.
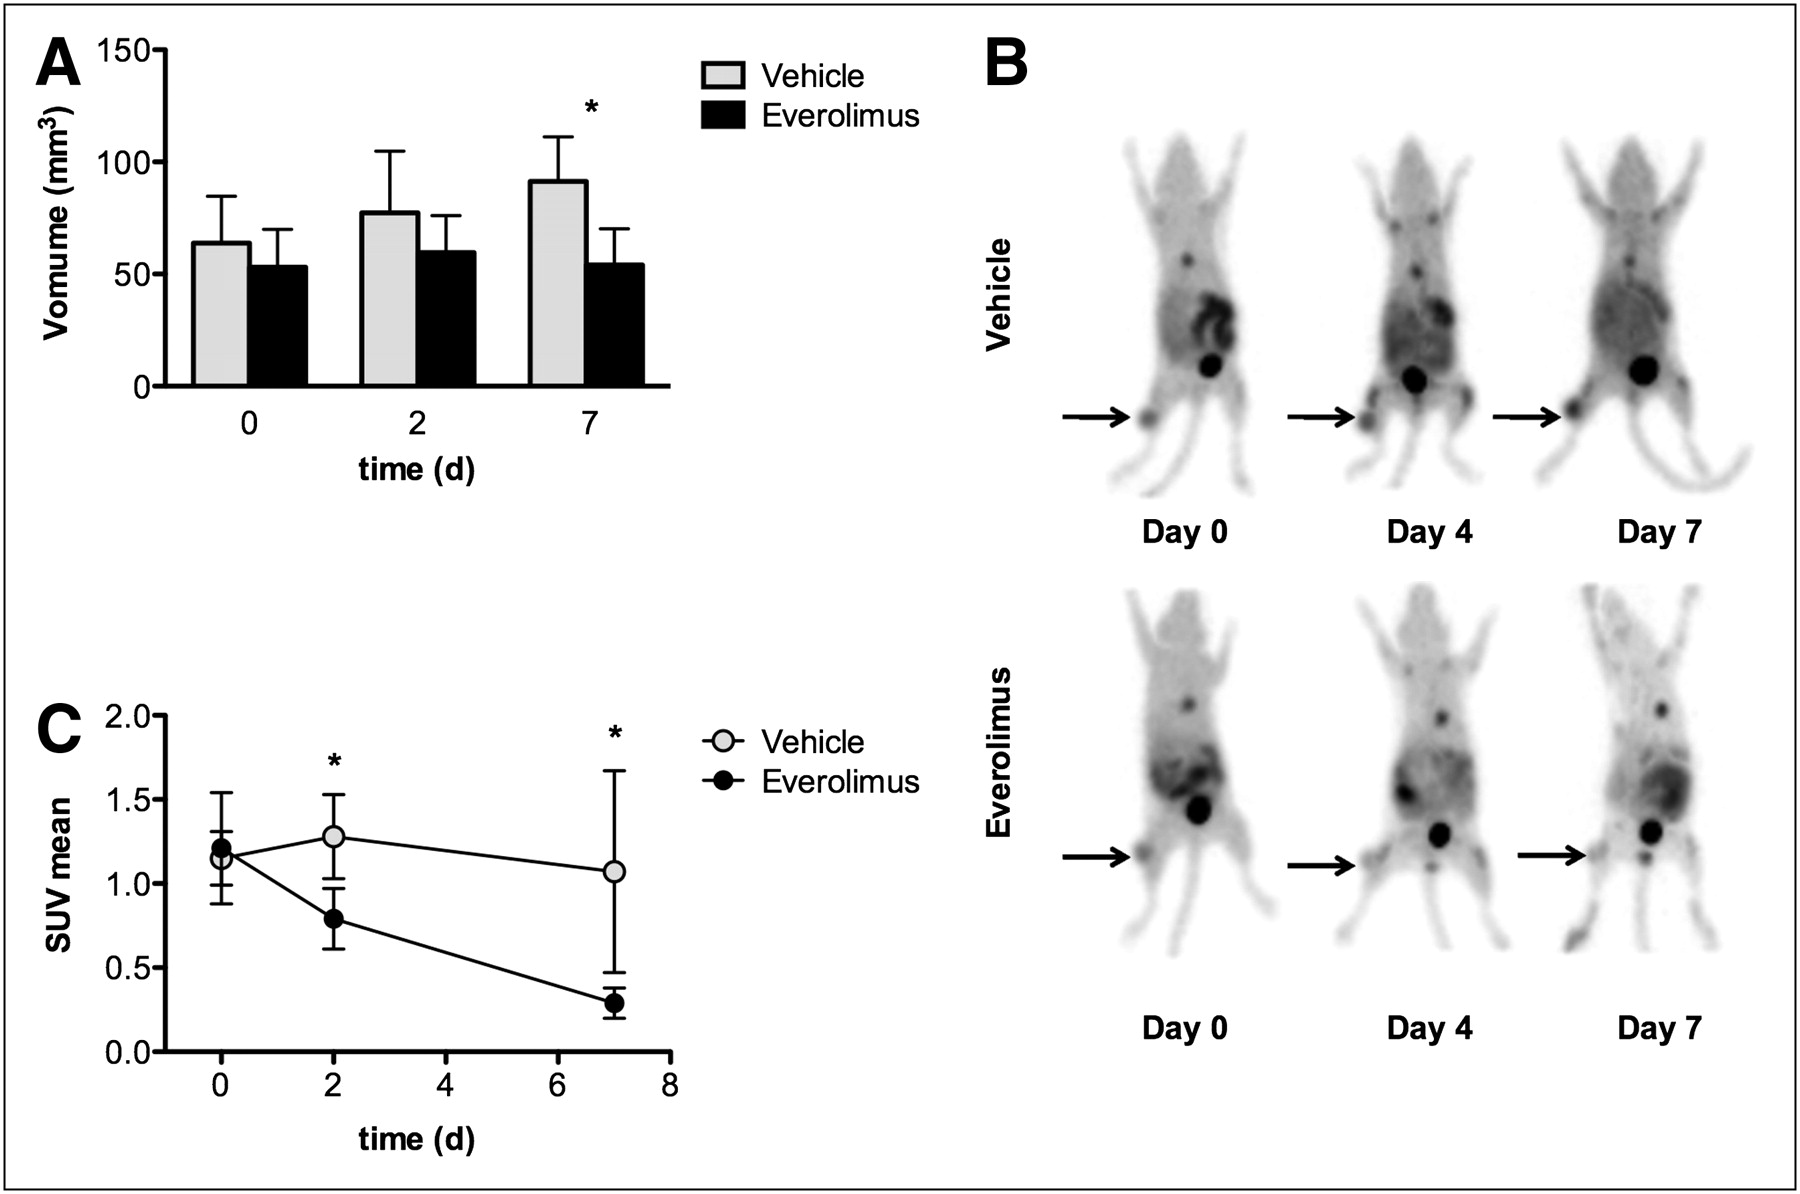
18F-FLT imaging identifies early metabolic changes after treatment by everolimus: tumor volume in everolimus and vehicle groups (A), maximum-intensity projection of representative animal in everolimus and vehicle groups (B), and SUVmean changes (mean ± SD) of tumors in mice receiving either everolimus or vehicle (C). *P < 0.05.
Impact of Everolimus on 18F-FLT Accumulation in SKOV-3 Xenografts
Changes in 18F-FLT uptake in response to everolimus were measured using PET (Figs. 1B and 1C). At baseline, there was no difference in 18F-FLT SUVmean between tumors that had been randomized in the vehicle and everolimus groups (P = 0.78). In the vehicle group, a nonsignificant increase in tumor 18F-FLT SUVmean was observed at day 2 (+9% ± 26%, compared with baseline; P = 0.45), followed by a nonsignificant decrease at day 7 (−8% ± 47%, compared with baseline; P = 0.76).
In contrast, 18F-FLT SUVmean in everolimus-treated mice showed a marked decrease from day 0 to day 2 (−33% ± 12%, compared with baseline; P = 0.003), at a time when no change in tumor volume was detectable between everolimus-treated and vehicle mice. The decrease in 18F-FLT accumulation in the treated tumors was even more significant at day 7, when SUVmean was reduced by 66% ± 8%, compared with that at baseline (P < 0.0001).
A significant difference between 18F-FLT SUVmean in vehicle and treated tumors was observed at day 2 (P = 0.0008) and at day 7 (P = 0.01). Despite a relatively large SD in the vehicle group at day 7, there was no overlap between SUVmean values in the vehicle and everolimus mice at any time point. We computed SUVmean in order to take into account the whole metabolic behavior of tumors. However, similar results were obtained when using SUVmax, with a significant difference between 18F-FLT SUVmax in vehicle and treated tumors being observed at day 2 (P = 0.0003) and at day 7 (P = 0.01) (Supplemental Fig. 1, available online only at http://jnm.snmjournals.org).
Impact of Everolimus Treatment on BrdU Incorporation and pS6 Activity in SKOV-3 Tumors
We used BrdU staining as a biomarker of cell proliferation, and pS6 staining as a specific biomarker of mTOR activity (Fig. 2). In the vehicle group, BrdU incorporation (percentage of stained cells) remained above 5%, without a significant change between baseline, day 2, and day 7. In the everolimus group, BrdU incorporation showed a decrease at day 2 (1.9 ± 1.3, P = 0.16) and at day 7 (2.9 ± 1.6, P = 0.02), compared with vehicle tumors. The decrease in the mean value for BrdU staining at days 2 and 7 of everolimus treatment represented a 65% and 41% reduction, respectively, compared with vehicle groups.

Changes in 18F-FLT reflect decrease in cell proliferation and inhibition of mTOR pathway. (A and C) Quantitative immunohistochemistry data (mean ± SD) are shown. (B and D) Representative tumor sections for BrdU (×20, B) and pS6 (×40, D) are displayed. *P < 0.05.
A significant decrease in pS6 staining was observed in the everolimus-treated tumors at day 2 (3.6 × 10³ ± 2.2 × 10³, P = 0.02) and at day 7 (15.5 × 10³ ± 7 × 10³, P = 0.003), which represented a 98% and 91% reduction of the mean value, respectively, compared with the vehicle groups. In the vehicle group, pS6 activity (optical density) was essentially unchanged during the treatment period.
DISCUSSION
This study demonstrated the ability of 18F-FLT PET to predict early response to mTOR inhibition in a cisplatin-resistant ovarian cancer model. The results suggest that this technique should be considered for therapeutic response assessment in humans.
Cisplatin resistance is common in ovarian cancer, and the need for second-line therapies is pressing. One such therapeutic option is targeting the phosphoinositide-3-kinase/AKT pathway or its downstream target mTOR, which has an important role in cell growth and proliferation. Despite some promising preclinical results (19), there is a need for improved noninvasive imaging tools for early mTOR inhibition, because 18F-FDG PET has been shown in a recent clinical study to be ineffective in predicting response to mTOR inhibition by rapamycin in patients with various types of cancer (20). In the current study, 18F-FLT was chosen because mTOR inhibition is known to cause a decrease in cyclin D1 expression and an increase in p27, leading in turn to a cell-cycle arrest in G1 (21), a state in which thymidine kinase 1 activity is low (19). Consistent with this observation, the significant 18F-FLT response as early as 2 d after initiation of treatment, with uptake decreasing by 33% at a time when no change in tumor volume was detectable between everolimus-treated and vehicle mice, is expected given that 18F-FLT is a substrate for thymidine kinase 1. The concordant change in tissue biomarkers of mTOR signaling, including a marked decrease in pS6 activity (98%, compared with vehicle), further suggests that decreased 18F-FLT uptake is a valid imaging biomarker of abrogation of signaling through this pathway. The reduced incorporation of BrdU—although not reaching statistical significance at day 2, possibly because of the low number of animals used for correlative studies at that time point—was statistically significant at day 7, indicating that a 18F-FLT PET response may also be imputed as a biomarker of reduced cellular proliferation as a consequence of mTOR inhibition.
The potential implications of the present study are 2-fold. First, 18F-FLT PET could be used to evaluate novel combination therapies, potentially including a combination of everolimus and conventional chemotherapy agents, with the goal of improving outcomes in platinum-resistant ovarian cancer. The use of 18F-FLT PET response during longitudinal studies would provide more efficient treatment validation than do tissue biomarker studies, such as immunohistochemistry. A proof-of-concept preclinical study of the utility of molecular imaging in molecularly targeted drug development has recently been published by Cejka et al. (22), who used 18F-FDG PET to define the optimal dose of the mTOR inhibitor everolimus in a model of human gastric cancer in nude mice. Those authors demonstrated that doses above 5 mg/kg did not further reduce 18F-FDG uptake. If one assumes that maximal metabolic response reflects abrogation of signaling through the mTOR pathway, it may be possible to titrate the optimal administered dose using molecular imaging and thereby improve the therapeutic index of this therapy by reducing off-target side effects. Although conceptually appealing, the study from Ma et al. (20) suggests that 18F-FDG may not be the optimal PET probe for evaluation of treatment with mTOR inhibitors in cancer patients. The present study demonstrates that 18F-FLT imaging is useful in a widely applied ovarian cancer cell line (23,24) and may also be useful for early evaluation of molecularly targeted therapies developed for ovarian cancer.
Although the utility of 18F-FDG PET for therapeutic response assessment is increasingly recognized, potential limitations have also been demonstrated in preclinical (9,25) and clinical studies (26). Similarly, the role of 18F-FLT PET for therapeutic monitoring requires further validation and definition of optimal timing in relation to treatment. In particular, it should be recognized that inhibition of proliferation can be a transient phenomenon, especially in the setting of intermittent drug administration, and may be followed by synchronization of cells moving back into cycle. This factor may account for the unexpected rise in 18F-FLT uptake 7 d after treatment observed in a recent study investigating mTOR inhibition in a murine lymphoma model (27). That study used a single dose of temsirolimus in a tumor model in which cyclin D1 messenger RNA is overexpressed. The increase in 18F-FLT retention at day 7 likely related to cyclin D1 driving cell-cycle progression of the tumor after release from mTOR inhibition. Accordingly, it will be important to consider the pharmacodynamics of the therapeutic agents being used in designing 18F-FLT imaging protocols for response assessment.
Despite these challenges, there are clear practical advantages to noninvasive imaging biomarkers that can be used serially in clinical trials of molecularly targeted therapies (2). These include the ability to evaluate multiple lesions throughout the body. Because invasive procedures such as evaluation of Ki67 staining in serial tumor biopsy samples (28) are rarely clinically feasible, they have been replaced by evaluation of biomarkers in surrogate tissues such as skin biopsies or peripheral mononuclear cells (29,30). However, phosphorylation of S6, as shown by clinical data (28), is a marker of target inhibition in normal tissues but not necessarily of tumor response. Moreover, even if serial tumor samples are achievable for tumor proliferation evaluation, they may still be hampered by tumor heterogeneity, whereas 18F-FLT PET can reliably study cell proliferation within multiple metastases in a single patient. Therefore, findings reported in the present study strongly support the use of 18F-FLT PET as a complementary tool to predict early response to mTOR inhibition in cancer patients.
CONCLUSION
In the SKOV-3 model of cisplatin-resistant ovarian cancer, therapeutic response to everolimus, as visualized by 18F-FLT PET, is closely linked with mTOR inhibition, as demonstrated by reduced S6 phosphorylation and BrdU incorporation. These data support the concept of using 18F-FLT PET to refine imaging and treatment protocols assessing mTOR inhibitors, and potentially other molecularly targeted therapies, in future clinical trials evaluating treatment of cisplatin-resistant ovarian tumors.
Acknowledgments
This work was supported by a fellowship from the Fondation de France and by a grant from the French Ligue contre le cancer, Comité du calvados. The authors thank the animal technologists and research assistants (Rachel Walker, Susan Jackson, Kerry Ardley, Jeannette Valentan, Ekaterina Bogatyreva, and Laura Kirby) from the Centre for Molecular Imaging for caring for the animals, injecting the tracer, and acquiring the SA PET images. Dr. Aide is indebted to Dr. Delphine Lerouge for her continuous support during this work.
- © 2010 by Society of Nuclear Medicine
REFERENCES
- Received for publication January 25, 2010.
- Accepted for publication March 24, 2010.


Jump to section
Related Articles
Cited By...
- In Vivo Imaging of Cell Proliferation Enables the Detection of the Extent of Experimental Rheumatoid Arthritis by 3'-Deoxy-3'-18F-Fluorothymidine and Small-Animal PET
- Arsenic trioxide synergizes with everolimus (Rad001) to induce cytotoxicity of ovarian cancer cells through increased autophagy and apoptosis
- [18F]FLT-PET Imaging Does Not Always "Light Up" Proliferating Tumor Cells
- mTOR Signaling, Function, Novel Inhibitors, and Therapeutic Targets
- Can Evaluation of Targeted Therapy in Oncology Be Improved by Means of 18F-FLT?