


Abstract
Recently introduced PET systems using silicon photomultipliers with digital readout (dPET) have an improved timing and spatial resolution, aiming at a better image quality than conventional PET (cPET) systems. We prospectively evaluated the performance of a dPET system in patients with cancer, as compared with high-resolution (HR) cPET imaging. Methods: After a single 18F-FDG injection, 66 patients underwent dPET and cPET imaging in randomized order. We used HR reconstructions (2 × 2 × 2 mm voxels) for both scanners and determined SUVmax, SUVmean, lesion-to-background ratio (LBR), metabolic tumor volume (MTV), and lesion diameter in up to 5 18F-FDG–positive lesions per patient. Furthermore, we counted the number of visible and measurable lesions on each PET scan. Two nuclear medicine specialists determined, in a masked manner, the TNM score from both image sets in 30 patients referred for initial staging. For all 66 patients, these specialists separately evaluated image quality (4-point scale) and determined the scan preference. Results: We included 238 lesions that were visible and measurable on both PET scans. For 27 patients, we found 37 additional lesions on dPET (41%) that were unmeasurable (n = 14) or invisible (n = 23) on cPET. Mean (±SD) SUVmean, SUVmax, LBR, and MTV on cPET were 5.2 ± 3.9, 6.9 ± 5.6, 5.0 ± 3.6, and 2,991 ± 13,251 mm3, respectively. On dPET, SUVmean, SUVmax, and LBR increased by 24%, 23%, and 27%, respectively (P < 0.001) whereas MTV decreased by 13% (P < 0.001), compared with cPET. Visual analysis showed TNM upstaging with dPET in 13% of the patients (4/30). dPET images also had higher scores for quality (P = 0.003) and were visually preferred in most cases (65%). Conclusion: dPET improved the detection of small lesions, upstaged the disease, and produced images that were visually preferred to those from HR cPET. More studies are necessary to confirm the superior diagnostic performance of dPET.
Keywords: digital PET; conventional PET; FDG PET; lesion detection; cancer imaging
PET combined with CT, using 18F-FDG, is increasingly important for cancer management (1,2). However, 2 major limitations of PET scanners are the limited system sensitivity, resulting in a low signal-to-noise ratio, and the low spatial resolution (3), which introduces the partial-volume effect (4). This partial-volume effect hampers the detection of small lesions (<20 mm) because they appear blurred in the PET image, resulting in an underestimation of lesion 18F-FDG uptake combined with an overestimation of lesion size (5).
A recent development in PET technology is the introduction of silicon photomultipliers with digital readout (6), replacing the conventional photomultipliers. It has been shown that PET systems with digital silicon photomultipliers (dPET) have an improved spatial and timing resolution, potentially resulting in a better image quality with higher SUVs than can be obtained with conventional PET (cPET) systems (6–8).
Previous studies compared cPET and dPET scans in patients with cancer using a prototype dPET system (9) and clinically available dPET systems (10–12). In general, these studies compared dPET using high-resolution (HR) reconstructions with cPET using standard-resolution reconstructions. It has been shown that moving from standard-resolution to HR reconstructions in cPET scans, such as by using smaller voxels, significantly improves image quality and already results in typically 25% higher SUVs and signal-to-noise ratios (13,14). It is unclear which part of the previously reported improvements was the result of the dPET system and which part was due to the difference in image reconstruction (15). Therefore, we prospectively evaluated the performance of a dPET scanner as compared with a cPET scanner in patients with various types of cancer, now using HR reconstructions for both systems. We performed semiquantitative and visual assessments and investigated the effect of dPET on lesion detection capabilities, as well as the impact on the TNM disease stage.
MATERIALS AND METHODS
Patient Population
We prospectively included 66 patients with proven cancer who were referred for whole-body 18F-FDG PET/CT for disease staging or restaging purposes, as part of an ongoing prospective single-center side-by-side PET comparison study. The Medical Ethical Committee of our institute approved the study protocol (NL52329.075.15), and the study was registered at clinicaltrials.gov with identifier NCT03457506. Written informed consent was obtained from all participants included in this study.
PET/CT Acquisition
Patients fasted for at least 6 h before the start of the first PET scan. The 18F-FDG activity administered to patients was based on  , where A is the administered activity (MBq), w the patient’s body weight (kg), and t the acquisition time per bed position (s).
Whole-body PET/CT scans from head to groin were acquired on supine patients using a state-of-the-art time-of-flight cPET PET/CT scanner (Ingenuity TF; Philips Healthcare) and a time-of-flight dPET scanner (Vereos; Philips Healthcare). PET system specifications can be found elsewhere (4). The PET scanning order was randomized per patient. Twenty-seven patients were first scanned on dPET followed by cPET (dPET-first), and 39 patients were first scanned on cPET and then on dPET (dPET-second). For each patient, we noted the ΔTcPET and the ΔTdPET, defined as the time between 18F-FDG administration and the start of the cPET scan and the dPET scan, respectively.
PET acquisition times for the first scan were 72 s and 144 s per bed position for patients with a body weight of 80 kg or less and a body weight of more than 80 kg, respectively. For the second scan, we used the acquisition time of the first scan plus a compensation for 18F decay between the 2 scans. The average administered 18F-FDG activity was 397 MBq (range, 212–660 MBq). Before each PET scan, a CT scan was acquired for attenuation correction. The CT scan parameters were 120 kV, 64 mAs (average across patients), 64 × 0.625-mm slice collimation, pitch of 0.83, and rotation time of 0.5 s.
PET Reconstruction
For cPET, we applied an ordered-subset expectation maximization time-of-flight PET HR reconstruction with 2 × 2 × 2 mm voxels, a relaxation parameter of 0.6, 3 iterations, and 43 subsets, without point-spread-function modeling. For dPET, we performed an ordered-subset expectation maximization time-of-flight PET HR reconstruction with 2 × 2 × 2 mm voxels, 3 iterations, and 17 subsets, without postsmoothing or point-spread-function modeling, as previously described (16). These settings led to similar noise properties in the cPET and dPET images for a fixed dose and scan time per bed position, as we concluded from background measurements in a National Electrical Manufacturers Association image-quality phantom filled with 18F-FDG.
Semiquantitative Evaluation
We performed background measurements in the reconstructed PET images by drawing 2 regions of interest of 1,000 mm2 in 3 axial slices containing healthy liver tissue. The average noise level in the liver was determined as the ratio between the SD and the average SUV.
We also evaluated lesion detection capabilities for both PET scanners. An experienced PET reader counted the number of lesions with increased 18F-FDG uptake on both PET scans in a masked fashion. We defined lesions as unmeasurable or invisible on one or both PET scans as follows. A lesion was regarded as unmeasurable if it was not possible to define a 70% isocontour volume of interest based on the maximum pixel value without contaminating the lesion volume of interest with background tissue. This situation can occur when there is a relatively low lesion-to-background contrast or heterogeneous uptake of 18F-FDG (17). Furthermore, a lesion was regarded as invisible if it was visible on only one of the PET scans.
For each patient, a maximum of 5 18F-FDG–positive lesions was included in the semiquantitative evaluation to prevent bias from patients with many lesions. If a patient had more than 5 eligible lesions, we selected the 5 lesions with the smallest diameter on the CT scan that were measurable on both PET scans. For all measurable lesions on both scans, a volume of interest was drawn around the lesion, and thresholding was applied at 70% of the maximum pixel value, using IntelliSpace Portal (version 9; Philips Healthcare) (17). From the resulting volume, we measured SUVmean and SUVmax and the metabolic tumor volume (MTV), in cubic millimeters. Moreover, we calculated the lesion-to-background ratio (LBR) by dividing the lesion SUVmax by the SUVmean in the background directly surrounding the lesion, using a method that we described previously (14). Finally, we measured the short-axis diameter of each lesion on the axial CT slice.
TNM Scoring
Two experienced nuclear medicine specialists, who were masked to scanner type, together determined the TNM score on both image sets for 30 patients who were referred for initial disease staging, excluding the 5 patients with initial staging for lymphoma. Next, TNM score differences between the 2 scans were collected per patient. We used the latest published version of the TNM system for each type of cancer, as available in August 2019.
Visual Analysis and Preferences
Both nuclear medicine specialists separately compared both PET scans side by side, while unaware of the scanner type. With a 4-point score, they rated the image quality of each PET scan as poor (1), moderate (2), good (3), or excellent (4) and the diagnostic confidence per scan as uncertain (1), moderate certainty (2), good certainty (3), or high certainty (4). Furthermore, they determined their preference (scan 1, scan 2, or no preference) for all 66 patients, again while masked to scanner type. In cases of discrepancy between the 2 nuclear medicine specialists, a third expert reader performed an additional read.
Statistical Analysis
Semiquantitative data are presented as mean ± SD. Data distribution normality was evaluated using the Shapiro–Wilk test. For data that were not normally distributed, the median is included as well. We performed an independent-samples t test to compare patient and scan characteristics (age, body weight, administered 18F-FDG activity, ΔT, and lesion size) between patients in the 2 scanning groups. The average SUVmean, SUVmax, LBR, and MTV as measured on cPET and dPET were compared using the Wilcoxon signed-rank test. The noise in the liver as measured with both scanners was compared using a paired-samples t test. Furthermore, for all semiquantitative lesion parameters (SUVmean, SUVmax, LBR, and MTV), we calculated the relative difference Δx between cPET and dPET using Equation 1: Eq. 1
Eq. 1
We used the independent-samples Mann–Whitney U test to compare Δx between lesions in the dPET-first group and the dPET-second group. Furthermore, we performed the F test and calculated Pearson correlation coefficients between ΔTdPET and Δx. Finally, a χ2 test was performed to compare image quality and diagnostic confidence scores between cPET and dPET. A P value of less than 0.05 was considered to indicate statistical significance.
RESULTS
Patient and scan characteristics are shown in Table 1. We included 238 18F-FDG–positive lesions with an average size of 12 ± 12 mm (median, 9 mm; range, 4–90 mm) in 66 patients. The average lesion size was similar in both scanning groups, with 12 ± 9 mm in the dPET-first group and 13 ± 13 mm in the dPET-second group (P = 0.80).
Patient and Scan Characteristics
Lesion Detection Capabilities
In 27 of 66 patients (41%), we found on the dPET images 37 additional 18F-FDG–positive lesions that were unmeasurable (n = 14) or invisible (n = 23) on the cPET images. Eight of these lesions were detected on the dPET-first scan (4 unmeasurable, 4 invisible). The remaining 29 lesions (10 unmeasurable, 19 invisible) appeared on the dPET-second scan, that is, after a prolonged 18F-FDG uptake time. No additional lesions were found on the cPET images.
Semiquantitative Results
The average SUVmean, SUVmax, LBR, and MTV across 238 lesions as measured on cPET and dPET images are shown in Table 2. With dPET, we found average increases of 24%, 23%, and 27% in SUVmean, SUVmax, and LBR compared with cPET, respectively (P < 0.001), whereas the average MTV decreased by 13% on dPET. This decrease in MTV is also visible in Figure 1, showing a histogram with the number of lesions in the MTV subgroups as measured on cPET and dPET. With MTV measurements performed on dPET, there were more lesions with a volume smaller than 200 mm3.
Semiquantitative Values as Measured on Both Scanners Across All Lesions (n = 238) and Relative Differences Between cPET and dPET
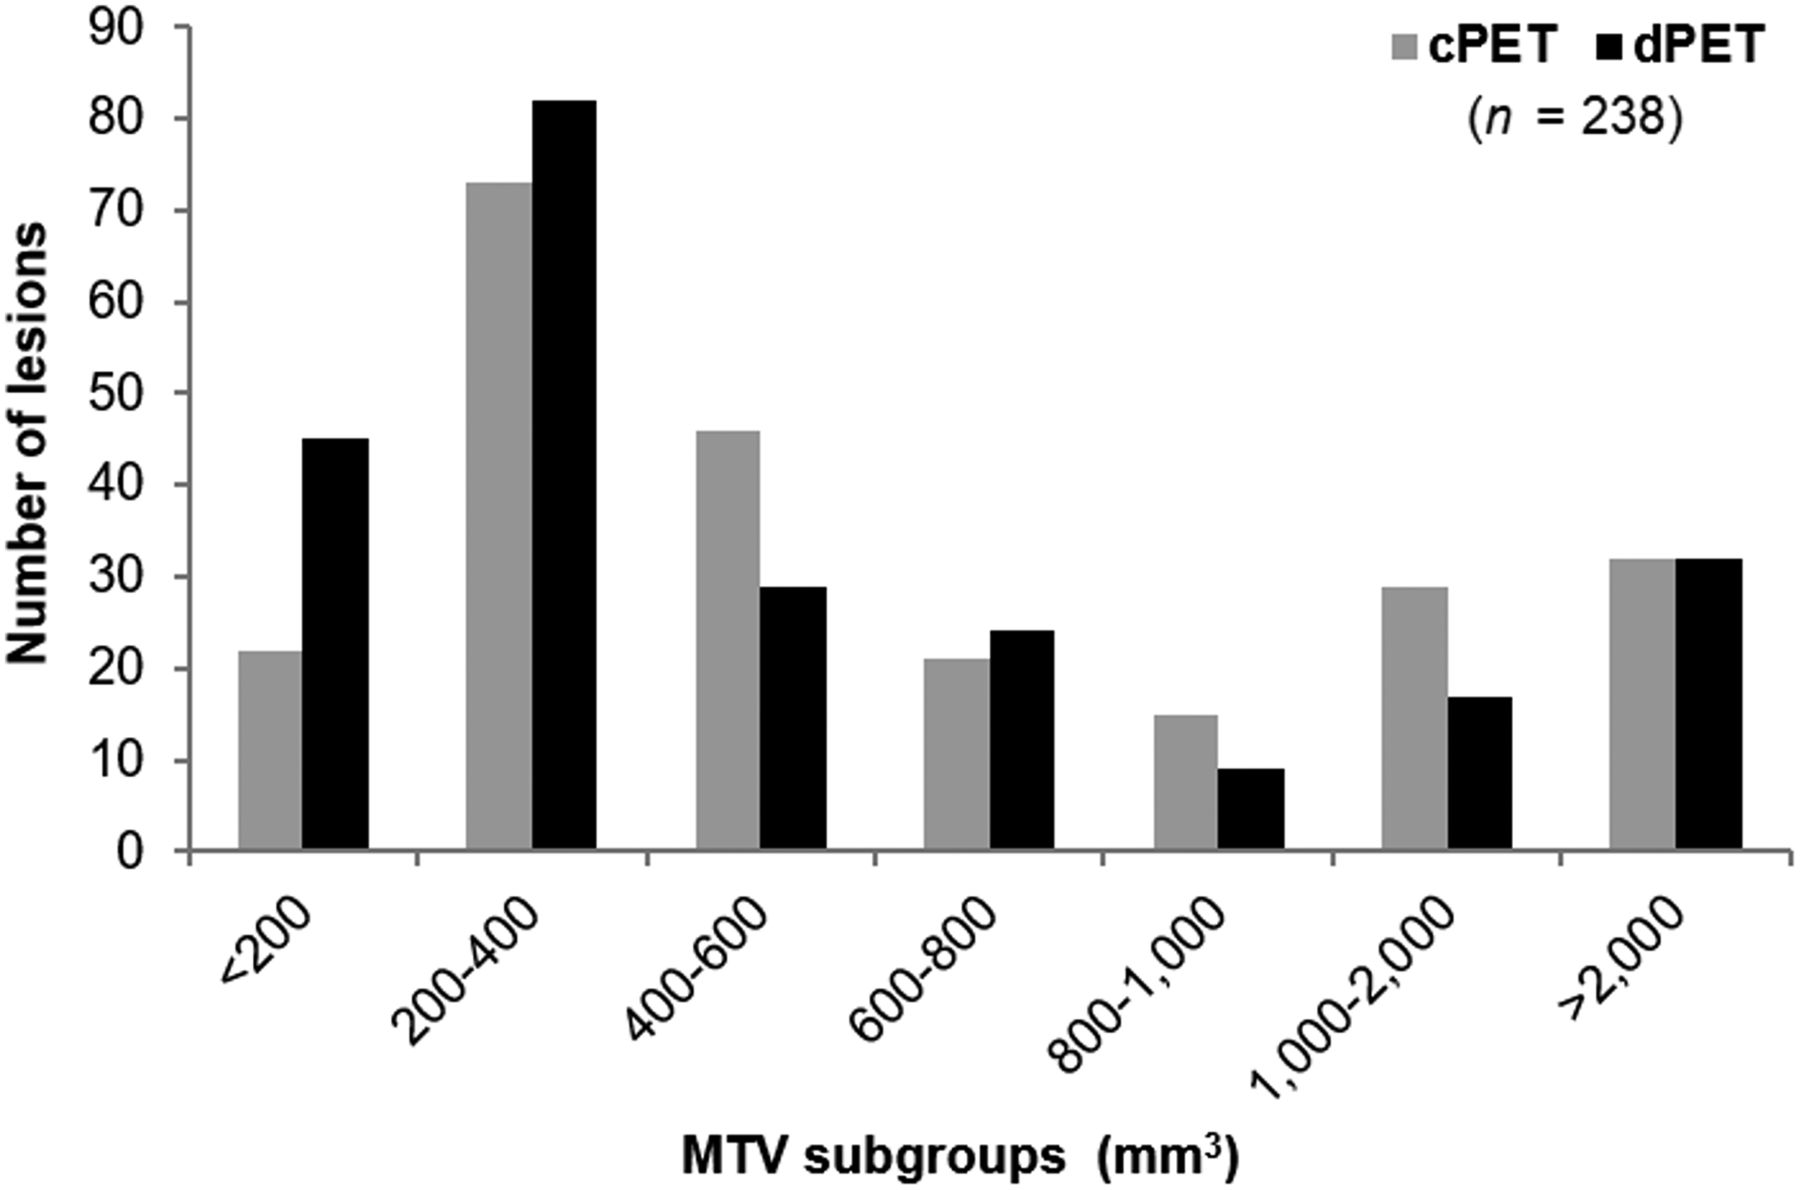
Histogram showing decrease in MTV on dPET images as compared with cPET, especially for lesions < 200 mm3.
The image noise in the liver was slightly higher on dPET (14.7% ± 1.9%) than on cPET (13.3% ± 1.8%) (P < 0.001).
The relative difference per lesion parameter between cPET and dPET is presented in Table 3 for both scanning groups. ΔSUVmean, ΔSUVmax, and ΔLBR were significantly higher for lesions in the dPET-second group than for lesions in the dPET-first group (P < 0.001), whereas ΔMTV was similar in both scanning groups (P = 0.18). In particular, in the dPET-first group we found an average increase of 9% for both ΔSUVmean and ΔSUVmax on dPET, whereas for lesions in the dPET-second group we found average increases of 35% and 34%, respectively, on dPET.
Relative Differences in Semiquantitative Parameters Between cPET and dPET per Scanning Group
In Figure 2, the relative change from cPET to dPET for all lesion parameters is compared with ΔTdPET across all lesions. It shows that ΔSUVmean, ΔSUVmax, and ΔLBR further increased at a prolonged ΔTdPET (P < 0.001), with correlation coefficients of 0.53, 0.52, and 0.50, respectively. ΔMTV was not correlated with ΔTdPET (P = 0.14, correlation coefficient of −0.09).

Scatterplots comparing ΔSUVmean (A), ΔSUVmax (B), ΔLBR (C), and ΔMTV (D) with ΔTdPET for lesions in dPET-first and dPET-second groups. Relative change in SUVmean, SUVmax, and LBR increased with prolonged ΔTdPET (P < 0.001), whereas we found no correlation between ΔMTV and ΔTdPET (P = 0.14).
TNM Staging
We found TNM upstaging with dPET in 4 of 30 patients (13%). Clinical information about these 4 patients is presented in Table 4. In 3 of them, the dPET scan was acquired after the cPET scan (dPET-second). No TNM upstaging was found with cPET.
Description of 4 Patients with TNM Upstaging on dPET
18F-FDG PET images from a patient with breast cancer with TNM upstaging on dPET are shown in Figure 3. The TNM score on the cPET scan was T4N0M0, but the dPET scan showed a 18F-FDG–positive internal mammary lymph node (SUVmean, 3.2; SUVmax, 4.0; MTV, 264 mm3) that was not visible on cPET, revealing N3 disease. After surgery, pathology findings confirmed that this lymph node was malignant.

18F-FDG PET/CT images from patient with breast cancer with upstaging from T4N0M0 on cPET (ΔT = 54 min) (A) to T4N3M0 on dPET (ΔT = 106 min) (B). dPET images revealed 18F-FDG–positive internal mammary lymph node (arrow) with diameter of 7 mm. During surgery, sentinel node procedure was performed, and pathology confirmed that this lymph node was malignant
Visual Analysis and Preferences
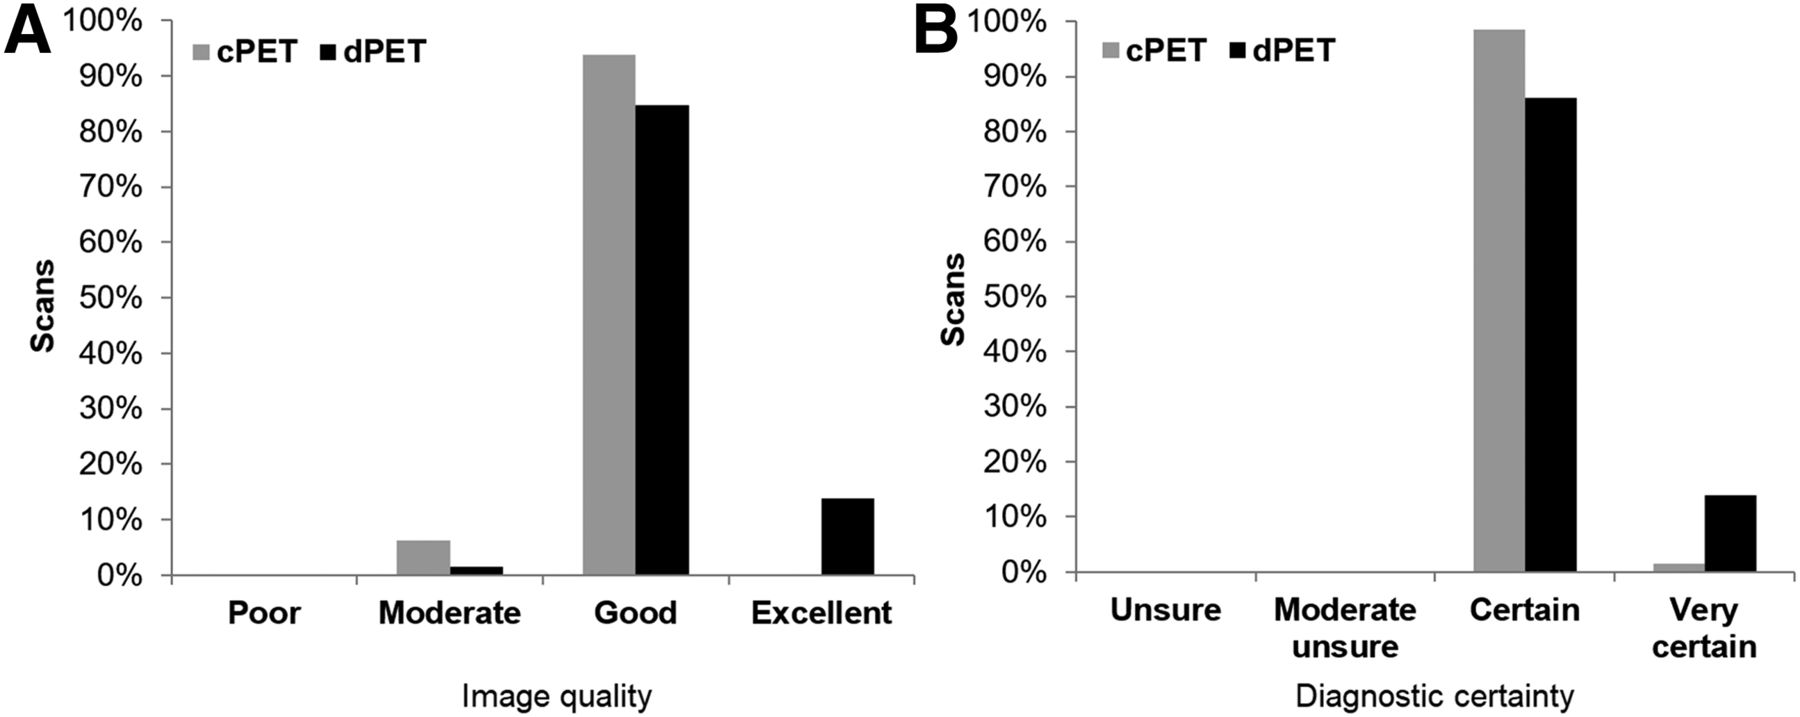
dPET resulted in better image quality scores than cPET (P = 0.003), whereas the diagnostic certainty of both scans was comparable (P = 0.69) (Fig. 4). Most of the PET scans resulted in good image quality (94% for cPET, 83% for dPET), and 15% of the dPET scans were regarded to have excellent image quality. The remaining 6% (cPET) and 2% (dPET) of the scans were scored as having moderate image quality.

Bar plots showing image quality (A) and diagnostic certainty scores (B) of cPET and dPET scans. Higher image-quality scores were found for dPET scans (P = 0.003), whereas diagnostic certainty was comparable between cPET and dPET scans (P = 0.68)
The dPET scan was preferred in 65% of the cases, whereas the remaining 35% included both a cPET scan preference (11%) and no preference (24%) (Fig. 5). Furthermore, the scan acquired after prolonged 18F-FDG uptake (scan 2) was preferred in 61% of the cases whereas the first scan was preferred in only 15% of the cases. In the dPET-second group, the dPET scan was preferred in 85% of the cases, whereas in the dPET-first group, the preferences scores were more widely distributed, with a 37% preference for scan 1 (being dPET), a 26% preference for scan 2 (being cPET), and no preference for 37% of the scans.

Bar plots showing scanner type preferences (A), scan order preferences (B), and scan order preferences per scanning group (C). Overall, dPET scan and second scan were preferred in most cases (65% and 61%, respectively). Moreover, dPET scan was preferred in 85% of cases when it was acquired after cPET scan.
DISCUSSION
We performed a prospective study that, to our knowledge, was the first to compare HR cPET with HR dPET in a relatively large cohort of 66 patients. We observed significantly higher semiquantitative values with dPET than with cPET. Furthermore, in 27 of 66 patients (41%), we found additional lesions on dPET, and in 4 patients (13%), we observed TNM upstaging on dPET. Moreover, dPET images were of better quality and were visually preferred by the nuclear medicine specialists.
This study showed that dPET provides an improved lesion detection capability. We detected 37 additional lesions with dPET that were unmeasurable or invisible on cPET images. Most of these lesions (78%) were found on the dPET scan that was acquired after the cPET scan and, thus, with a prolonged 18F-FDG uptake time, albeit we also detected 8 additional lesions (22%) on the dPET scan that was acquired before the cPET scan. We did not find additional lesions on cPET. At least 3 other studies previously observed additional lesions on dPET as compared with cPET. Nguyen et al. (9) reported 8 additional lesions in 21 patients, whereas Baratto et al. (10) found 37 additional lesions with focal 18F-FDG uptake in 50 patients. However, in these studies all dPET scans were acquired after the cPET acquisition, thus potentially introducing a bias due to prolonged 18F-FDG uptake (18). Another study, by López-Mora et al. (12), reported 22 additional small (<10 mm) lesions on dPET images in 100 patients. However, the investigators compared standard-resolution cPET with HR dPET and did not describe whether the additional lesions were detected on the dPET-first or the dPET-second scan.
Our semiquantitative analysis showed average increases of 24% (SUVmean), 23% (SUVmax), and 27% (LBR) across 238 18F-FDG–positive lesions when using HR dPET instead of HR cPET. The corresponding SDs of 23%, 24%, and 33% demonstrate that there was a wide distribution in relative changes between lesions (Fig. 2). This variation was partly caused by methodologic aspects such as the impact of prolonged 18F-FDG uptake time (18) and test–retest variations (19,20) between 2 PET scans.
Nevertheless, the average semiquantitative increases with dPET in our study were lower than findings from earlier cPET–dPET comparisons. For example, Baratto et al. (10) reported an average SUV increase of 53% with dPET across 107 lesions. This increase is more than twice the ΔSUV in our study. A partial explanation is the difference in scanning order, because in their study, all dPET scans were acquired after the cPET scans—a factor that could result in ΔSUV overestimations assigned to the dPET system (18). Moreover, the fact that were also some differences between their cPET and dPET reconstruction protocols may have further caused their larger SUV difference between the 2 PET systems. Another study, by Fuentes-Ocampo et al. (11), recently reported an average SUV increase of 35% across 87 lesions in 87 oncologic patients, but these investigators compared standard-resolution cPET with HR dPET. This difference in reconstruction approach makes their comparison invalid (15). As we previously demonstrated, the use of a HR cPET reconstruction already results in SUV increases of typically 25% as compared with standard-resolution cPET (13,14).
Furthermore, we observed a 13% decrease in lesion MTV with dPET, using 70% SUVmax thresholds. Nguyen et al. (9) also compared tumor volumes of 24 lesions on cPET and dPET. Using 35% and 50% SUVmax thresholds for delineation, they reported tumor volume decreases of 31% and 19%, respectively. These decreases in MTV are likely caused by a decrease in partial-volume effect due to the higher resolution of the dPET system.
The impact of prolonged 18F-FDG uptake time is significant and makes PET system comparisons after a single 18F-FDG injection difficult. Between the 2 scanning groups in our study, we observed significant differences in ΔSUVmean, ΔSUVmax, and ΔLBR. For example, the average ΔSUVmean in the dPET-first group was only 9%, whereas the average ΔSUVmean in dPET-second group was 35%. On the basis of these averages, we expect that about [35%–9%]/2 = 13% of the higher SUVs on the second scan can be attributed to the prolonged scan time, which was on average 32 min in our study. For certain tumor types, these time-dependent SUV increases can be even higher (18,21). Overall, higher average ΔSUVmean in the dPET-second group demonstrates that in 18F-FDG PET comparison studies in which the scan on the newer system is always acquired after the scan on the older system (9,10,22), an overestimation of the added value of the newer PET system is likely.
The present study had some limitations. Our randomization led to 27 patients with dPET-first scans and 39 patients with dPET-second scans, which is not perfectly balanced. This difference may cause a slight SUV overestimation, although we demonstrated that general patient characteristics and lesion sizes between the 2 groups were similar. Moreover, we aimed to perform a comparison of cPET and dPET using HR reconstructions for small-lesion detection in order to determine solely the impact of new dPET technology. However, the image reconstructions were not exactly similar, as we did not have the same software possibilities available on the 2 different scanners. To minimize the impact of these differences, we selected reconstruction settings that led to similar noise levels in phantom images. Another limitation of our study was that we did not evaluate the diagnostic performance of dPET in terms of sensitivity, specificity, and accuracy because of limited verification data. Further studies are required for this purpose.
CONCLUSION
In this prospective head-to-head evaluation, dPET improved the detection of small lesions over HR cPET. dPET scans were visually preferred by experienced readers, additional lesions were detected in 41% of the patients, and the disease was upstaged in 13%. More studies are necessary to confirm the superior diagnostic performance of dPET.
DISCLOSURE
The Department of Nuclear Medicine, Isala, has established a research cooperation with Philips Healthcare regarding new PET technologies. The content of this article was solely the responsibility of the authors. No other potential conflict of interest relevant to this article was reported.
KEY POINTS
QUESTION: How does the performance of a dPET system compare with that of an HR cPET system in terms of lesion detection, image quality, and disease staging in patients with cancer?
PERTINENT FINDINGS: With dPET, we found 37 additional lesions in 27 patients (41%), a 25% increase in lesion SUVs, and TNM upstaging in 13% of the patients. Furthermore, dPET images were of better quality and were visually preferred in most cases (65%).
IMPLICATIONS FOR PATIENT CARE: With improved small-lesion detection and upstaging in some patients, dPET may provide a more accurate diagnosis than cPET, and this improved accuracy might influence patient treatment and prognosis.
Acknowledgments
We gratefully acknowledge Tessa Gerritse and Ellis Simons-Winters for their assistance in patient inclusion, and we thank the staff from Isala, Zwolle, and the Technical Medicine Centre, University of Twente, Enschede, for their overall support and kind collaboration.
Footnotes
Published online Feb. 14, 2020.
- © 2020 by the Society of Nuclear Medicine and Molecular Imaging.
REFERENCES
- Received for publication October 10, 2019.
- Accepted for publication February 3, 2020.


