


Abstract
In 18F-FDG PET, tumors are often characterized by their metabolically active volume and standardized uptake value (SUV). However, many approaches have been proposed to estimate tumor volume and SUV from 18F-FDG PET images, none of them being widely agreed upon. We assessed the accuracy and robustness of 5 methods for tumor volume estimates and of 10 methods for SUV estimates in a large variety of configurations. Methods: PET acquisitions of an anthropomorphic phantom containing 17 spheres (volumes between 0.43 and 97 mL, sphere-to-surrounding-activity concentration ratios between 2 and 68) were used. Forty-one nonspheric tumors (volumes between 0.6 and 92 mL, SUV of 2, 4, and 8) were also simulated and inserted in a real patient 18F-FDG PET scan. Four threshold-based methods (including one, Tbgd, accounting for background activity) and a model-based method (Fit) described in the literature were used for tumor volume measurements. The mean SUV in the resulting volumes were calculated, without and with partial-volume effect (PVE) correction, as well as the maximum SUV (SUVmax). The parameters involved in the tumor segmentation and SUV estimation methods were optimized using 3 approaches, corresponding to getting the best of each method or testing each method in more realistic situations in which the parameters cannot be perfectly optimized. Results: In the phantom and simulated data, the Tbgd and Fit methods yielded the most accurate volume estimates, with mean errors of 2% ± 11% and −8% ± 21% in the most realistic situations. Considering the simulated data, all SUV not corrected for PVE had a mean bias between −31% and −46%, much larger than the bias observed with SUVmax (−11% ± 23%) or with the PVE-corrected SUV based on Tbgd and Fit (−2% ± 10% and 3% ± 24%). Conclusion: The method used to estimate tumor volume and SUV greatly affects the reliability of the estimates. The Tbgd and Fit methods yielded low errors in volume estimates in a broad range of situations. The PVE-corrected SUV based on Tbgd and Fit were more accurate and reproducible than SUVmax.
Automatic tumor delineation in 18F-FDG PET images is highly desirable for improved quantification, objective patient monitoring, and refinement of CT-based treatment planning in radiotherapy. However, the tumor segmentation task is challenging given the modest spatial resolution and the relatively high noise level in PET images. A large number of approaches have been proposed to segment tumors in PET images. Many assume that voxels belonging to the tumor have an uptake greater than a certain threshold. This threshold can be set as a percentage of the maximum voxel value in the tumor (1), possibly accounting for surrounding activity (2). Alternatively, the threshold can be calibrated as a function of the mean activity in a growing region around the tumor (3), adjusted using iterative approaches (4–7), or even applied to images of the glucose metabolic rate derived from dynamic PET (8). Apart from threshold-based approaches, gradient-based segmentation relying on morphologic information or on active contours has been proposed (9–11). Methods including various statistical models have also been described (12,13).
To date, there is no consensus on which methods should be preferred for tumor segmentation, because of the difficulty in assessing tumor volumes in vivo (14). Although the performance of the different segmentation methods has been studied in specific configurations, a comprehensive comparison of various segmentation approaches for a broad range of cases has not been reported. Comparative studies considering patient tumors in the context of radiotherapy planning have underlined the great variability of the volumes defined from the PET images as a function of the segmentation method (2,15,16) but have not investigated accuracy in tumor volume estimates. It has also been shown that the standardized uptake values (SUV in g/cm3, units will not be specified hereafter) strongly depended on the methods used to define the tumor volume (17,18).
The purpose of this study was to assess the accuracy, precision, and robustness of 5 volume estimation methods (1–3,6,19). Using these segmentation methods, 10 SUV estimates were also compared. The comparisons were performed using phantom data and simulations of patient PET scans. A detailed analysis of the performance of the methods depending on whether the parameters they involved were perfectly optimized was also included.
MATERIALS AND METHODS
Phantom Data
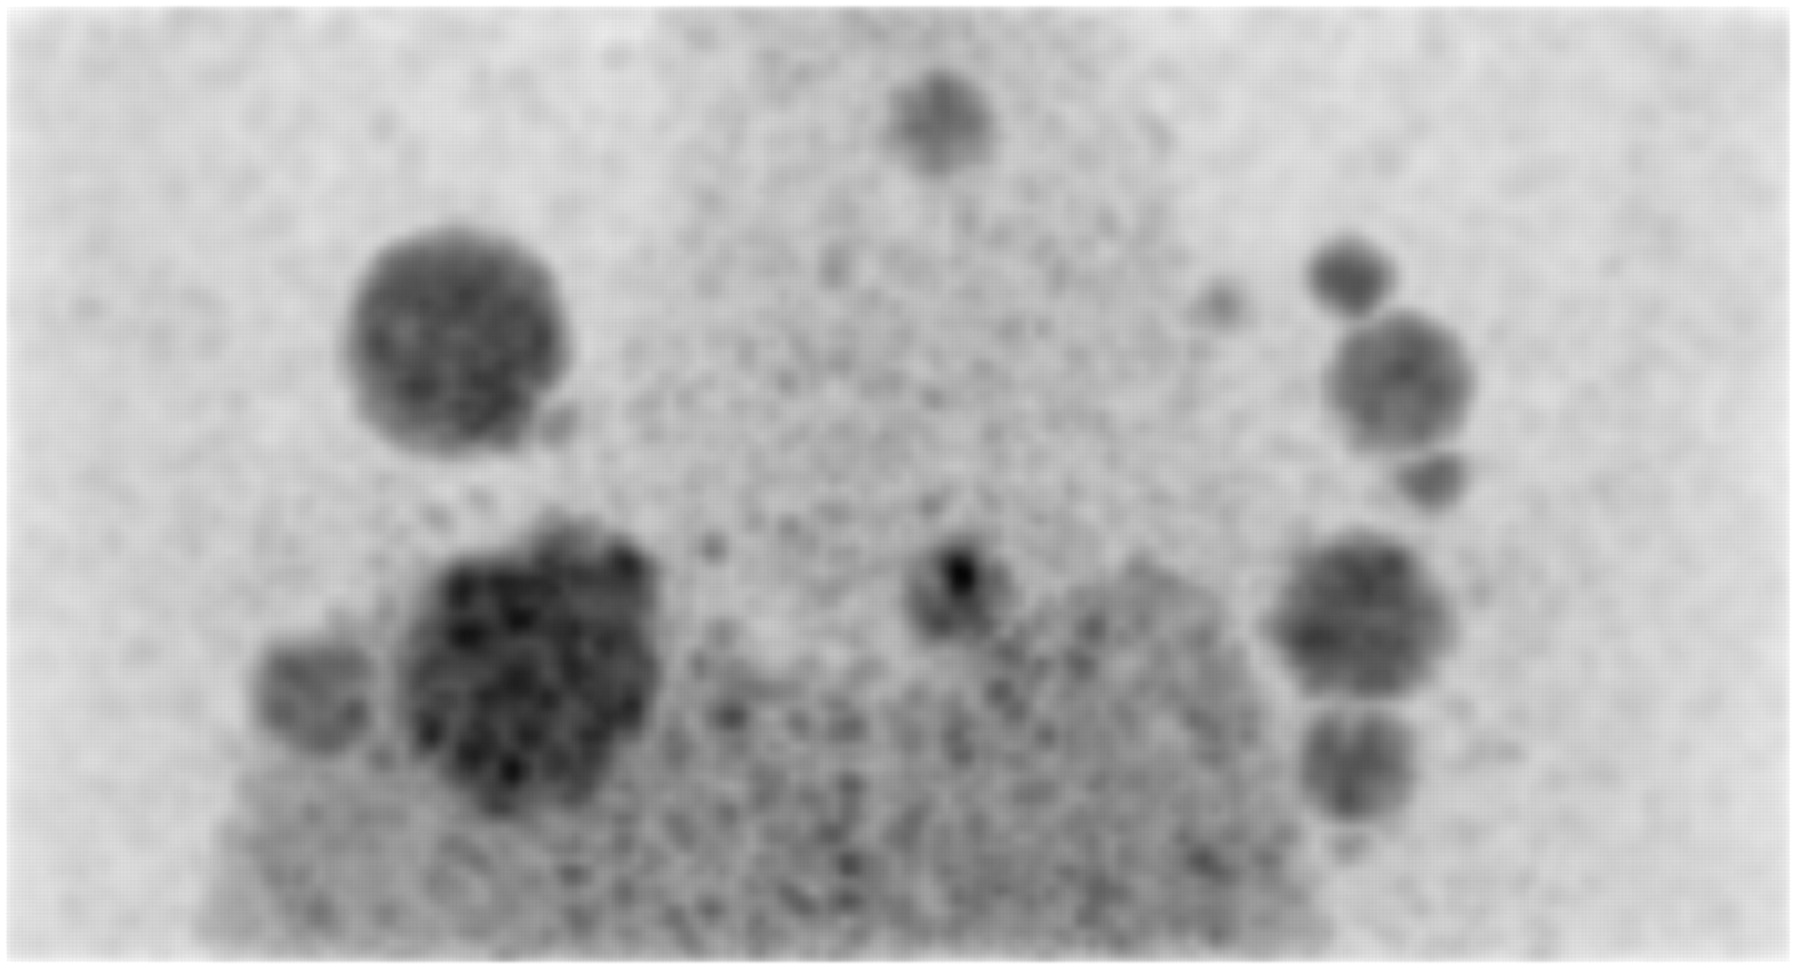
Seventeen spheres (Table 1) were inserted in the Data Spectrum model ECT/TOR/P torso phantom (volume of 10.3 L), containing a liver insert (1.2 L) and 2 lung inserts (0.9 and 1.1 L) (Fig. 1). Five phantom configurations were considered, with activity concentration ratios between the spheres and the background compartment of 10.1, 8.3, 6.5, 4.8, and 2.9. This yielded a 1.2–67.9 range of sphere-to-surrounding-activity concentration ratios, depending on the location of the sphere (Table 2). For each phantom configuration, a 3-min acquisition was performed on a Siemens Biograph PET/CT scanner. Images were reconstructed using ordered-subsets expectation maximization (6 iterations, 8 subsets), corrected for attenuation using a CT-derived map, for random coincidences using delayed coincidences, and for scatter using a model-based correction (20). The voxel size was 2 × 2 × 2 mm. The reconstructed images were postfiltered with a 3-dimensional (3D) gaussian function of 5 mm in full width at half maximum (FWHM). Among the 85 spheres (17 spheres × 5 acquisitions), 7 (the 5 smallest spheres and 2 spheres located in the liver insert in acquisition 5; Table 2) could not be visually detected and were excluded from further analysis, resulting in 78 spheres in this dataset.

Maximum intensity projection of phantom containing 17 spheres.
Volumes and Locations of the 17 Spheres in the Phantom
Activity Concentrations in Lung and Liver Inserts and in Background of Phantom for Each Acquisition and Corresponding Sphere-to-Surrounding-Activity Concentration Ratios
Simulated Data
The GATE Monte Carlo simulation software (21) was used to simulate PET data as acquired from the Philips Gemini GXL PET scanner. A cylindric water phantom (22 cm in diameter and 19 cm in height) including 6 spheres of 1.1, 2.1, 3.6, 8.6, 16.8, and 28.7 mL was first simulated. The spheres were in the central transaxial plane of the cylinder, the center of each sphere being equidistant and 5.5 cm from the axis. The activity in the phantom background was 3.4 kBq/mL, and 4 acquisitions were simulated with sphere-to-background-activity ratios of 2, 4, 8, and 12. These simulations were used for calibration of the segmentation methods applied to the patient simulations.
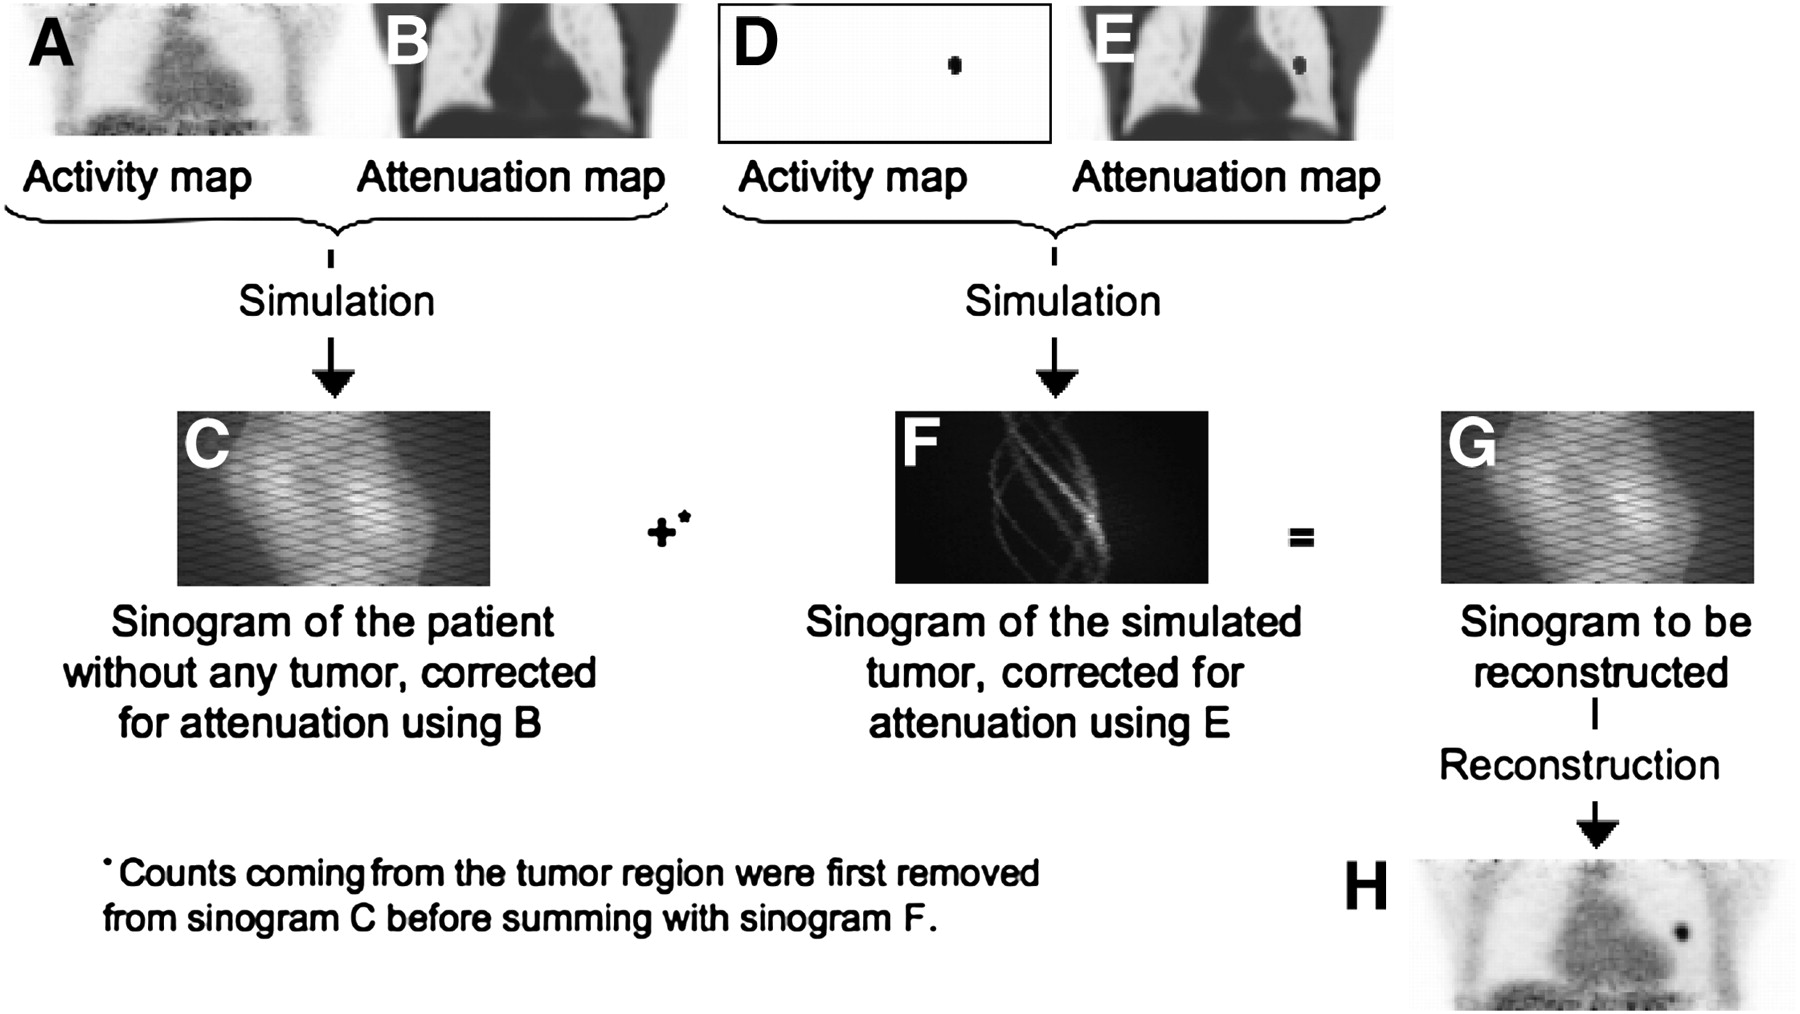
GATE was also used to simulate realistic tumors within the PET scan of a patient (66 y old; 70 kg) with no tumor in the lungs (Fig. 2) (22). The PET “tumor-free” sinogram of the patient was first simulated based on his actual Philips Gemini GXL PET/CT scan by estimating the activity distribution from the reconstructed PET images and the propagation medium from the CT scan. Tumors were then placed in the healthy lungs, and a PET sinogram of the tumors only was simulated using the patient CT as the propagation medium, in which the attenuation of the tumor (considered as soft tissues) had been added. The 3D contours of the simulated tumors were derived from a nuclear physician's manual delineation of 41 lung tumors in fourteen 18F-FDG PET scans of patients with non–small cell lung cancer. The tumor volumes ranged from 0.6 to 91.8 mL (mean = 13.01 ± 19.5 mL). Each of the 41 tumors was simulated with SUV of 2, 4, and 8 to yield 123 simulated tumors with various activities and volumes. The simulated “tumor-free” sinogram and the “tumor-only” sinogram were corrected for attenuation using the appropriate attenuation maps and were added after all counts originating from the tumor locations had been removed from the “tumor-free” sinogram. The summed sinograms were finally reconstructed.

Simulation of realistic patient data with lung tumor: activity distribution in patient with no tumor shown on actual PET image (A) is first simulated using attenuation map derived from patient CT scan (B). Resulting sinogram (C) is added to “tumor-only” sinogram F obtained by simulating only tumor (D) within attenuation map of patient in which tumor attenuation had been inserted (E). This sum resulted in sinogram G, which produced image H after reconstruction.
All simulated sinograms corresponded to 2-min scans and covered an 18-cm axial field of view. Because sinograms containing only true coincidences were considered, images did not require random and scatter corrections. Images were reconstructed using 3D ordered-subsets expectation maximization (5 iterations and 5 subsets) and postfiltered with a 5-mm FWHM 3D gaussian function. The voxel size was 4 × 4 × 4 mm. The whole simulated activity in the patients with tumors was between 39.8 and 43.0 MBq.
Volume Estimates
Five methods for tumor delineation were considered. All were applied to large manually defined volumes of interest (VOI) containing the spheres or simulated tumors and including at least 80% of background voxels.
Four methods, denoted Tmax, Treg, Tmean, and Tbgd, considered that all connected voxels with an intensity greater than a given threshold belonged to the tumor.
In Tmax, the threshold was defined as a percentage of the SUVmax in the VOI.
In Treg (6), the threshold was estimated iteratively using Eq. 1where β and γ were calibration factors.
In this approach, the tumor volume was first delineated using Tmax with α = 0.4 and the mean SUV (SUVmean) in this volume was deduced. The corresponding threshold Treg was derived from Equation 1 and a new mean SUV in the corresponding tumor region was calculated. This procedure was repeated until the segmented region differed by less than 1 voxel between 2 iterations.
In Tmean, the threshold was defined as a percentage δ of the mean SUV in a growing region Rgrow (3). The algorithm was initialized with Rgrow corresponding to a single voxel in the tumor. If voxels connected to Rgrow had an intensity of at least δ × mean SUV, they were included in Rgrow. Mean SUV was updated and the process was repeated until no additional voxel could be included in Rgrow.
In Tbgd, the threshold depended on the activity Ibgd surrounding the tumor and on the mean activity I0.7 in the volume defined by the voxels with an intensity higher than 0.7 × Imax (2): Eq. 2
Eq. 2
In our implementation, Ibgd was determined automatically. As the original VOIs included about 80% of background voxels, the histogram in this VOI had a gaussian shape roughly centered on the mean background value. The mean background value was deduced by fitting the histogram with a gaussian.
The fifth method, Fit, was derived from a previously published method (23). It assumed that the tumor image could be modeled as the convolution of the actual tumor volume of uniform activity with a 3D gaussian function describing the local spatial resolution ζ in the reconstructed image. In our implementation (19), the tumor volume was initialized using the Tbgd method with ε = 0.25. Assuming that this volume was always larger than the true tumor volume, this volume was eroded using a 1-voxel structuring element. The 3 model parameters (number of erosions, activities in the tumor, and activities outside the tumor) that best fit the observed tumor image in the least-square sense were identified. The tumor image modeling and erosion were performed after resampling the tumor model images to a 1 × 1 × 1 mm voxel size with a piecewise cubic Hermite interpolating polynomial interpolation (24), whereas the comparison of the model image with the original PET images was performed in the original PET sampling.
SUV Estimates
For each tumor segmented using Tmax, Treg, Tmean, and Tbgd, the mean SUV in the segmented volumes was calculated. Each of these 4 mean SUV was also corrected for partial-volume effect (PVE) using a recovery coefficient (RC). The RC was deduced from the segmented volume by convolving the binary mask corresponding to this volume with the 3D gaussian function of FWHM θ modeling the spatial resolution effect in the reconstructed images (25). The PVE correction also accounted for surrounding activity (25), which was estimated as Ibgd in the Tbgd method previously described.
The mean SUV in the tumor volume estimated using the Fit method was intrinsically corrected for PVE as the sampling and resolution effects were modeled.
The maximum SUV (SUVmax) in the tumor VOI was also systematically calculated.
In summary, for each tumor, 5 volume estimates (from Tmax, Treg, Tmean,Tbgd, and Fit) and 10 SUV estimates (from Tmax, Treg, Tmean, Tbgd without and with PVE correction, Fit, and SUVmax) were available. The SUV estimates were denoted SUVTreg, SUVTregRC, SUVTmean, SUVTmeanRC, SUVTmax, SUVTmaxRC, SUVTbgd, SUVTbgdRC, SUVFit, and SUVmax.
Comparison Protocols
Optimization of the Segmentation Methods
All segmentation methods involved 1 or 2 parameters. To ensure a fair comparison of the methods, these parameters have to be optimized for each type of scanner, acquisition, and processing protocol.
Using the phantom acquisitions and the cylindric phantom simulation, for each sphere we calculated the optimal parameters minimizing the absolute value of the error in sphere volume estimate for each method. We also determined the corresponding FWHM θ giving the smallest absolute value of the error in SUV corrected for PVE with the RC.
Given these optimal parameters (1 or 2 per sphere and per segmentation method), the segmentation methods were first assessed on the real phantom data using a leave-one-out procedure (26): for each segmentation method, the parameters used to segment a given sphere were the average of the 77 optimal parameter values obtained for all other spheres. Similarly, the θ value used to calculate the RC used for PVE correction was taken as the average of the 77 optimal θ obtained for all other spheres.
As this leave-one-out procedure assessed the optimal performance of the methods that cannot be achieved in real situations, we also used a hold-out procedure. The phantom dataset of 78 spheres was randomly split into 2 groups of 39 spheres. The first group was used to optimize the segmentation and resolution parameters for each sphere. The means over all spheres of these optimized parameters were then used for segmenting the spheres of the other group. The validation and test groups were identical for all segmentation methods.
For the simulated patient data, a realistic approach was used for optimizing the segmentation parameters. It consisted of optimizing the parameters for each of the 24 spheres (6 spheres × 4 acquisitions) of the simulated cylindric phantom. The averaged parameter values were considered when applying the segmentation methods to the simulated patient data.
Figures of Merit and Statistical Analysis
For each segmentation method and each sphere or simulated tumor, the percentage error in volume estimate was calculated: Eq. 3The absolute value |Evolume| was also used to compare the segmentation methods.
Similarly, the percentage error in SUV estimates was calculated: Eq. 4
Eq. 4
The mean error and associated SD were calculated for each estimation method and optimization procedure.
Sign tests were performed to test if the median of the Evolume or ESUV distribution was significantly different from zero, using a Bonferroni adjustment to account for multiple comparisons (27). A Friedman test based on ranks and appropriate for multiple comparisons on paired data was used to test whether several distributions of |Evolume| or |ESUV| were identical. A Tukey procedure appropriate for the multiple comparisons of dispersions (28) was used to rank the estimation methods as a function of the variability of the errors. All tests were performed with α = 0.05.
RESULTS
Volume Estimates
We distinguished the results obtained for all the spheres or simulated tumors and the results obtained for spheres or tumors with a volume of 2 mL or more, as it has been suggested that no accurate volume estimate could be achieved for tumor volumes less than 2 mL (29). In the phantom data, Tmean and Treg did not converge in 2 of 78 spheres (0.43- and 0.99-mL spheres with a contrast of 20 and 3, respectively) and in 11 of 123 simulated tumors (volumes from 0.64 to 2.4 mL with an SUV of 2). These spheres and tumors were excluded from further analysis.
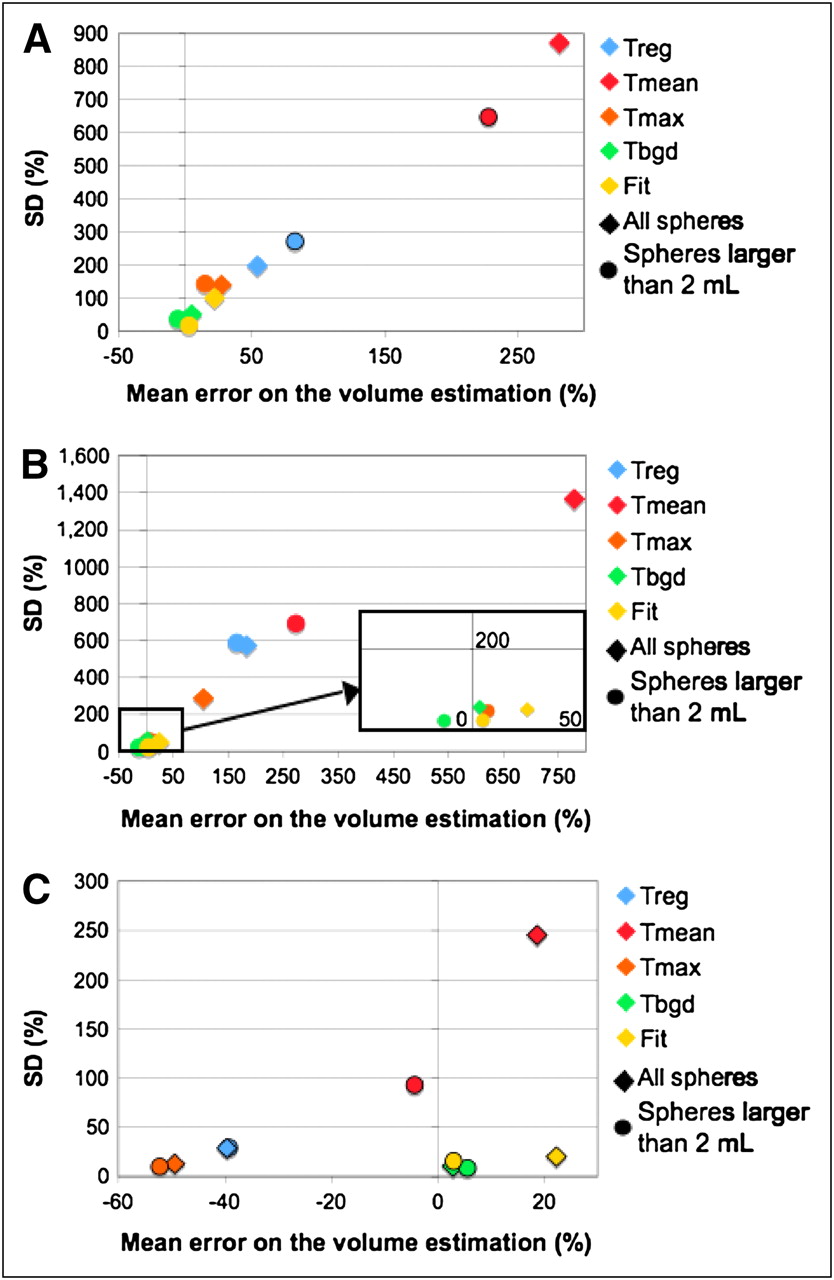
Figure 3 shows the tradeoff between the mean percentage errors in volume estimate and the variability of the error as measured by the SD of Evolume, for the 5 segmentation methods and the 3 datasets (phantom data and leave-one-out optimization, phantom data and hold-out optimization, simulated patient data). These plots suggest that for all datasets, the 2 segmentation methods performing the best (lowest bias and smallest variability) are Tbgd and Fit. Tmean suffers from a large variability for all datasets. Tmax and Treg had variable performance depending on the dataset.

SD of volume percentage error as function of mean of volume percentage error Evolume for all spheres and tumors (diamonds) and for spheres and tumors > 2 mL (circles) using 5 segmentation methods: leave-one-out phantom data (A), hold-out phantom data (B), and simulated patient data (C). Black-edged symbols show cases in which Evolume was significantly different from zero.
Evolume was significantly different from zero only for Tmax and Tmean and spheres larger than 2 mL for the leave-one-out dataset. For the simulated data, all the error distributions had a significant bias.
Figure 4 shows the mean rank of |Evolume| for the 5 volume estimation methods (Friedman test), when one is considering all spheres and tumors of the leave-one-out phantom data, hold-out phantom data, and simulated data. The smallest rank corresponds to the smallest |Evolume|. Fit and Tbgd were significantly less biased than Tmax for the leave-one-out phantom data (Fig. 4A, red line). These 2 methods had the smallest ranks for the 3 datasets, consistent with their lowest bias in tumor volume estimates seen in Figure 3. Fit and Tbgd had nonsignificantly different accuracy, except in the simulated data, where Tbgd was significantly less biased than Fit.

Comparison of mean rank of |Evolume| for the 5 volume estimates: leave-one-out phantom data (A), hold-out phantom data (B), and simulated patient data (C). Colored lines highlight significant differences between methods.
For the 2 phantom datasets, Tmean led, on average, to the largest error in volume estimate, and the differences with the 4 other methods were systematically significant (green and brown lines in Figs. 4A and 4B). However in the simulated data, the mean rank of Tmean was significantly smaller than the mean rank of Tmax (Fig. 4C, purple line).
When only the spheres and tumors with volumes larger than 2 mL were considered (results not shown), identical trends were found.
When the variability of the errors in volume estimates were compared for all datasets (y-axis in Fig. 3), the 2 methods yielding the most variable errors were Tmean and Treg, with Tmean being systematically more variable than Treg.
For the phantom data, the smallest variability of the error was systematically observed for Tbgd and Fit, with no consistent difference between them in terms of variability. For the simulated data, Tbgd had the smallest variability, but this variability was not significantly lower than that of Tmax. Fit had a significantly larger variability than Tbgd and Tmax for the simulated tumors.
SUV Estimates
The performance of the 10 SUV estimation methods was assessed for the 76 spheres and 112 simulated tumors for which the segmentation methods converged.
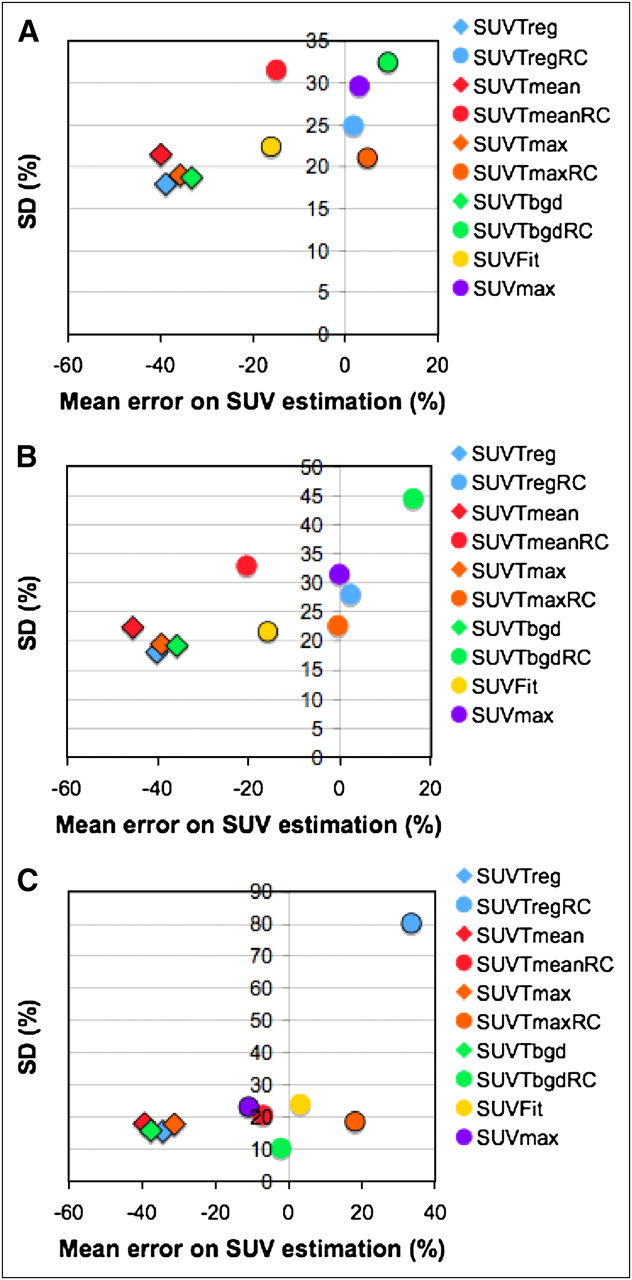
Figure 5 shows the SD of the SUV percentage errors as a function of the mean percentage errors in SUV estimates for the 3 datasets and for the 10 SUV estimation methods. The mean SUV not corrected for PVE clearly showed a negative bias. Focusing on the 6 methods including a PVE correction (y-axis in Fig. 5), the SDs of the error were consistent between datasets, between 19% and 31% for SUVFit, SUVmax, and SUVTmaxRC. The variability of the errors as a function of the dataset was greater for SUVTmeanRC, SUVTregRC, and SUVTbgdRC. However, the variability of the errors in SUV was less different between methods than the variability of the errors in tumor volume (compare y-axes of Figs. 3 and 5), except for SUVTregRC, which had the significantly largest variability for the simulated data.

SD of SUV percentage error as function of mean of SUV percentage errors: leave-one-out phantom data (A), hold-out phantom data (B), and simulated patient data (C). SUV corrected for PVE and maximum value are shown using circles, whereas SUV not corrected for PVE are shown using diamonds. Black-edged symbols show cases in which mean error was significantly different from zero.
The hypothesis that the median of the SUV error distribution was equal to zero was always rejected except for SUVTregRC, SUVTmeanRC, and SUVmax for the leave-one-out sphere data. It was never rejected for the methods corrected for PVE, except for Fit in the hold-out sphere data.
For noncorrected mean SUV, this hypothesis was rejected for all datasets. For the simulated tumors, the median bias was always significantly different from zero except for SUVTmeanRC, SUVTbgdRC, and SUVFit.
Figure 6 shows the mean rank of |ESUV| for the 10 SUV estimates when all spheres and tumors of the leave-one-out phantom data, hold-out phantom data, and simulated data are considered. The smaller the rank, the more accurate the SUV estimate. The mean SUV not corrected for PVE was significantly different from the SUV corrected for PVE and from SUVmax for the leave-one-out and hold-out data (blue line in Fig. 6A and orange line in Fig. 6B). Comparing SUVmax with the SUV corrected for PVE, the only significant differences were between SUVmax and SUVTmaxRC and between SUVmax and SUVTregRC for the leave-one-out data (red line in Fig. 6A).

Comparison of mean rank of |ESUV| for 10 SUV estimation methods: leave-one-out phantom data (A), hold-out phantom data (B), and simulated patient data (C). Colored lines highlight significant differences between methods.
For the phantom data and simulated data, the mean SUV not corrected for PVE had the largest ranks. However, SUVTmaxRC was not significantly different from SUVTmax for simulated data. SUVTbgdRC had a significantly smaller rank, compared with all other methods (purple line in Fig. 6C). SUVFit and SUVTmeanRC were significantly less biased than SUVmax (green line in Fig. 6C).
DISCUSSION
Although many methods have been proposed for tumor delineation in 18F-FDG PET images (1–13), it is not clear yet which method should be preferred. Comparing the performance of these methods from the data published in the literature is almost impossible given the variety of situations in which evaluation studies have been conducted. In addition, the performance of each method depends on the proper optimization of its parameters. It is thus extremely important to consider the robustness of any method with respect to the setting of its parameters, given that the optimal parameters can never be identified in clinical configurations. The same observations are true for SUV estimates.
Our study compared several methods for estimating the tumor volumes or SUV, using 2 datasets and different optimization strategies for setting their parameters. We first considered a phantom including spheres as often used to characterize the performance of tumor segmentation methods (1,5,7,29) or SUV estimation methods (17,30). However, tumors are rarely spheric, and the activity distribution in tissues is far more complex in patients than in phantoms. We thus considered highly realistic Monte Carlo simulations of patient PET scans, based on real patient PET/CT scans. Such simulations were more representative of clinical situations than the phantom datasets in 2 respects: first, the background activity distribution reflected heterogeneities observed in a real patient (Fig. 2). Second, the tumors had shapes observed in real patients.
Three strategies were considered for setting the parameters of each method. The leave-one-out strategy ensures the best operating conditions for each method. Although the associated performance could not be achieved in practical situations, this strategy allowed us to characterize the potential of each method. The hold-out procedure relying on training and test dataset is conventionally used to assess the performance of estimation methods but remains unrealistic for patient data. The realistic optimization strategy when dealing with patient data consists of optimizing the parameters using phantom data acquired and reconstructed under the same conditions as the patient data. We thus also considered this third optimization strategy.
Volume Estimates
We first compared the accuracy in volume estimates for the 5 tumor segmentation methods (Figs. 3 and 4). Whatever the dataset and optimization strategy, the Tbgd and Fit methods offered the best trade-off between bias and variability in volume estimates. As expected, the errors and SD were systematically larger for the hold-out optimization than for the leave-one-out strategy when the phantom data were considered (Fig. 3). However, the ranking of the 5 estimation methods was consistent (Fig. 4), although 2 differences (Tbgd and Fit vs. Tmax) found significant with the leave-one-out optimization were no more significant with the hold-out data. The ranking of the methods with the simulated data was different from that with the phantom data (Fig. 4). Tbgd and Fit still yielded the most accurate volume estimates. Unlike in the phantom data, Tbgd was significantly better than Fit, and Tmax performed the worst. These differences might be due to the shapes of the “tumors,” the different background patterns, or the different optimization strategies. To determine whether the optimization strategy used for the simulated data explained the significant difference between Tbgd and Fit, we also optimized the Tbgd and Fit parameters using a leave-one-out procedure for the simulated data (results not shown), but the resulting parameters were not significantly different from the parameters derived from the simulated phantom. The poorest performance of Fit, compared with Tbgd, for the simulated data was actually due to the inability of Fit to properly recover the shape of the simulated tumors using the erosion strategy. Tbgd might thus be more accurate than Fit for highly nonspheric tumors.
The better performance of Tmean for the simulated data, compared with the phantom data, could be due to the smaller range of “tumor”-to-background activity ratio in the simulated tumors (from 8 to 32) than in the phantom spheres (from 1.9 to 67.9). In particular, for spheres with a sphere-to-background ratio smaller than 8 (34/76), Tmean often led to severe volume overestimates, with a mean percentage error of 800% on these spheres, much poorer than previously reported (3). Tmean thus does not appear to be a good option when the processed images can include a large variety of tumor-to-background activity ratios.
Tmax accuracy also depends on the tumor-to-background activity ratio (31). For the simulated data, Tmax parameters were optimized using data with sphere-to-background-activity ratios between 1 and 12, which did not match those in the simulated tumors (8–32), yielding a systematic underestimation of the volumes of the simulated tumors. The optimization of the Tmax parameter using a leave-one-out procedure for the simulated data (results not shown) actually led to parameters significantly different from those derived from the simulated phantom (P < 0.001). Similar to Tmean, the performance of Tmax is thus highly dependent on whether its parameter has been optimized considering tumor-to-background-activity ratios similar to those observed in the images subsequently processed.
SUV Estimates
Overall, the comparison of SUV estimation methods showed a systematic underestimation of SUV with the methods that did not include any PVE correction, except for SUVmax (Fig. 5), which often minimizes PVE (25).
Similar to what was observed for the volume estimates, the ranking of the SUV estimation methods was identical whatever the optimization strategy when the phantom data were considered (Figs. 6A and 6B), but differences (SUVTregRC and SUVTmaxRC vs. SUVmax) that were found significant with the leave-one-out optimization were no more significant with the hold-out optimization.
SUVTbgdRC was not significantly different from the other PVE-corrected SUV in the phantom data and significantly less biased than all other SUV estimates in the simulated data. This latter result is consistent with the ranking of Tbgd for volume estimates.
SUVFit is corrected for PVE but has a negative bias in the phantom data, compared with SUVmax, SUVTmaxRC, and SUVTbgdRC. This is because the Fit method uses only 1 parameter for both volume and SUV estimations. This parameter has been optimized for volume recovery rather than for activity recovery on phantoms, making the method more accurate in estimating volumes than activity. In the simulations, SUVFit has the second smallest mean bias (3% against −2% for SUVTbgdRC), which suggests that the optimization of a single parameter for Fit still makes it robust enough to properly assess volume and SUV in a variety of situations. The observed systematic negative bias of Tmax in the simulated data leads to a systematic positive bias in SUVTmaxRC.
The variability in the SUV estimation error is related to the variability in the volume estimates: for instance, Tmean had variable errors in volume and also in SUV estimates. Moreover, the relationship between the error in volume estimate and in SUV corrected for PVE is nonlinear (32). Small underestimation in small-volume estimates can lead to high overestimation of PVE corrected activity. Most methods overestimated the small volumes, but Tbgd underestimated volumes less than 2 mL in 41% of the cases (14% for Treg, 4% for Tmean, and 14% for Tmax) in the leave-one-out phantom data. This yielded outliers in SUVTbgdRC error distribution and explained its positive bias and higher dispersion in the phantom data, compared with other methods.
Robustness of the Estimation Methods
Some methods were more sensitive than others to the proper setting of the parameters they involved. For the volume estimates, Tmax, Tmean, and Treg had very different biases for the simulated data, compared with the phantom data, whereas Tbgd and Fit had a more constant bias across the datasets and optimization strategies. This finding suggests that Tbgd and Fit are more robust than the other methods with respect to the setting of the parameters.
For the SUV estimates, SUVTbgdRC and SUVFit did not have the smallest rank for the phantom data (Fig. 6) but were not significantly less accurate than SUVTregRC and SUVTmaxRC. For the simulated data, they yielded the most accurate SUV estimates (SUVTbgdRC rank being significantly smaller than SUVFit rank), although training and evaluation datasets had different characteristics. SUVTbgdRC and SUVFit thus seemed to yield the most robust SUV estimates. They were also significantly more accurate than SUVmax for all the datasets.
Limitations to the Current Study
The evaluation based on the simulated data was supposed to be closer to real clinical situations than is the phantom. However, our simulations remained too simple in at least 2 regards: neither respiratory motion nor heterogeneity in tumor uptake was modeled. Our results might still be representative of the performance to be expected for images compensated for respiratory motion, such as respiratory-gated images with appropriate signal-to-noise ratios (33). Respiratory motion compensation (e.g., based on gated PET/CT) before tumor volume or SUV estimates is certainly more appropriate than optimizing tumor segmentation methods for data corrupted by motion, given the large variability of the motion blur in patients, as a function of the respiratory amplitude or tumor location, for instance. Further studies regarding the reliability of tumor volume estimates and SUV estimates for heterogeneous tumors are still needed. For heterogeneous tumors, however, the very concept of tumor volume and tumor SUV might have to be reconsidered, and approaches such as activity–volume histograms might appear more relevant for describing tumors (34) than is a single volume or SUV per tumor.
CONCLUSION
A comprehensive evaluation of 5 volume and 10 SUV estimation methods demonstrated that 2 segmentation methods (Tbgd and Fit) and 2 SUV indices corrected for PVE (SUVTbgdRC and SUVFit) yielded the most accurate tumor volume and SUV estimates.
Acknowledgments
We thank Dr. Michelle Dusart from the Citadelle Hospital of Liège (Belgium) for the delineation of PET tumors in patients and the GDR Stic Santé for supporting the collaboration between the IMNC and LITIS laboratories.
Footnotes
-
COPYRIGHT © 2010 by the Society of Nuclear Medicine, Inc.
References
- Received for publication May 18, 2009.
- Accepted for publication July 13, 2009.


Jump to section
Related Articles
Cited By...
- Time to Prepare for Risk Adaptation in Lymphoma by Standardizing Measurement of Metabolic Tumor Burden
- Baseline Total Metabolic Tumor Volume Measured with Fixed or Different Adaptive Thresholding Methods Equally Predicts Outcome in Peripheral T Cell Lymphoma
- 18F-FDG PET/CT to Predict Response to Neoadjuvant Chemotherapy and Prognosis in Inflammatory Breast Cancer
- Subcentimeter Tumor Lesion Delineation for High-Resolution 18F-FDG PET Images: Optimizing Correction for Partial-Volume Effects
- Reference Range for Intrapatient Variability in Blood-Pool and Liver SUV for 18F-FDG PET
- 18F-FDG PET/CT Metabolic Tumor Volume and Total Lesion Glycolysis Predict Outcome in Oropharyngeal Squamous Cell Carcinoma
- Prognostic PET 18F-FDG Uptake Imaging Features Are Associated with Major Oncogenomic Alterations in Patients with Resected Non-Small Cell Lung Cancer
- Kinetic Analysis of 18F-FLT PET in Lung Tumors
- Nonlaxative PET/CT Colonography: Feasibility, Acceptability, and Pilot Performance in Patients at Higher Risk of Colonic Neoplasia
- SUV: From Silly Useless Value to Smart Uptake Value