


Abstract
Increased tumor burden is associated with inferior outcomes in many lymphoma subtypes. Surrogates of tumor burden that are easy to measure, such as the maximum tumor dimension of the bulkiest lesion on CT, have been used as prognostic indices for many years. Recently, total metabolic tumor volume (MTV) and tumor lesion glycolysis have emerged as promising and robust biomarkers of outcome in various lymphomas. The median MTV and the optimal cutoffs to separate patients into risk groups in a study population are, however, highly dependent on the population characteristics and the delineation method used to outline tumor on the PET image. This issue has precluded the use of MTV for risk stratification in trials and clinical practice. Standardization of the methodology is timely to allow the potential for risk adaptation to be explored in addition to response adaptation using PET. Meetings between representatives from research groups active in the field were held under the auspices of the PET International Lymphoma and Myeloma Workshop. A summary of those discussions, which included a review of the literature and a practical assessment of methods used for outlining, including various software options, is presented. Finally, a proposal is made to perform a technical validation of MTV measurement enabling benchmark reference ranges to be derived for published delineation approaches used for outlining with various software. This process would require collation of representative imaging data sets of the most common lymphoma subtypes; agreement on pragmatic criteria for the selection of lesions; generation of a range of MTVs, with consensus to be reached on final contours in a training set; and development of automated software solutions with a set of minimum functionalities to reduce measurement variability. Methods developed in the above training exercise could then be applied to another data set, with a final set of contours and values generated. This final data set would provide a benchmark against which end-users could test their ability to measure MTVs that are consistent with expected values. The data set and automated software solutions could be shared with manufacturers with the aim of including these in standard workflows to allow standardization of MTV measurement across the world.
See an invited perspective on this article on page 1094.
The association of tumor burden with resistance to treatment and inferior patient outcomes in Hodgkin lymphoma has been recognized since 1988 (1). At that time, tumor volume was assessed using clinical examination, chest radiography, and lymphography (1), later replaced by CT (2). These studies demonstrated that tumor burden was the single most important prognostic factor at the time of diagnosis for the prediction of treatment failure and disease relapse. The MabThera International Trial demonstrated the survival benefits of combining rituximab with chemotherapy in young patients with good-prognosis diffuse large B-cell lymphoma (3). In this landmark study, the presence of bulky disease was the only independent clinical risk factor associated with overall survival with a linear effect observed, using cutoffs from 6 to 10 cm for maximum tumor dimension. In a further trial in young patients with diffuse large B-cell lymphoma, with an age-adjusted International Prognostic Index of 1, a maximum tumor dimension of at least 10 cm was the only factor associated with overall survival (4). Similar findings were reported around the same time for follicular lymphoma, for which the longest diameter of the largest involved node was identified as an independent predictor of progression-free survival, with an optimal cutoff of 6 cm (5).
The time involved and the complexity of measuring the entire tumor volume in individual patients on CT scans have meant that surrogates for the total tumor burden have been relied on as predictive factors. Disease stage, number of involved nodes, involvement of extranodal sites, and the presence of bulk have been included in prognostic indices that are commonly used in Hodgkin and non-Hodgkin lymphoma (5–9). These prognostic indices, however, are not very effective in classifying patients at high risk of treatment failure. Tumor volumes on PET and CT are routinely assessed for the purpose of radiotherapy planning, but this assessment is generally limited to one or a few sites rather than the total tumor burden.
The introduction of PET has made measurement of the total metabolically active volume of tumor more feasible. Tumor locations that accumulate 18F-FDG can be outlined and summed to calculate the total metabolic tumor volume (MTV). Tumor lesion glycolysis (TLG) can also be assessed, which is the MTV multiplied by the SUVmean in the entire volume and takes into account both the extent and the intensity of tracer uptake. Multiple reports from large studies performed on retrospective cohorts or retrospective analyses of prospective trials have demonstrated that MTV and/or TLG is associated with progression-free survival, and sometimes with overall survival, in subtypes including Hodgkin lymphoma, diffuse large B-cell lymphoma, follicular lymphoma, and primary mediastinal B-cell and T-cell lymphomas (10–18). Highly effective PET-adapted treatment may have contributed to the inability to show an association with overall survival in some studies. MTV appears to be a robust prognosticator irrespective of the method used for measurement. However, the median MTV or optimal cutoff that separates high- from low-risk groups varies according to the patient population and the method of analysis. This variation has, to date, precluded the use of metabolic volumes for risk stratification in clinical trials on hematologic malignancies.
Standardization of the methodology for the assessment of metabolic tumor burden is required to validate this promising biomarker and enable inclusion in patient management. Standardization of response assessment with 18F-FDG PET has previously been successful using the Deauville criteria (19), which are widely applied (20) and used for PET-response–adapted treatment (21). This standardization was undertaken as a sequential process. First, simple rules were agreed upon for reporting and measuring concordance rates among reviewers, using international cohorts of patients with Hodgkin lymphoma and non-Hodgkin lymphoma (technical validation) (22,23). Second, the criteria were evaluated against patient outcomes in retrospective cohorts (24–27) and prospectively validated in clinical trials (21,28,29). A similar approach to standardize the measurement of metabolic tumor burden is now proposed to enable testing of PET risk-adapted and response-adapted strategies.
Meetings were convened with representatives from research groups active in the field under the auspices of the PET International Lymphoma and Myeloma Workshop (https://www.lymphomapet.com/). A review of the literature and studies in progress was undertaken, with presentations and face-to-face meetings in Paris on February 1, 2018, and Menton on October 4, 2018. A proposal was developed to perform a benchmarking exercise for the technical validation of MTV and TLG on 18F-FDG PET/CT images.
The group acknowledged uncertainties regarding which structures to include, which delineation methods to apply, and which software packages to use to outline tumor.
The following sections summarize the results of discussions and potential ways forward. The term cutoff is used to mean the MTV cutoff that separates patients into different risk groups. Threshold is used to mean the threshold applied in the segmentation method to delineate tumor.
WHAT SHOULD BE INCLUDED IN THE ASSESSMENT OF MTV?
Measurement begins with visual assessment of the scan, as occurs in routine clinical practice, noting the location of abnormal focal uptake in nodal and extranodal sites and ensuring that all relevant areas are imaged. Images should be scaled to a fixed SUV display and color table (20). Lymphomatous uptake can be distinguished from physiologic uptake and disease unrelated to lymphoma according to the distribution and CT characteristics with knowledge of the lymphoma subtype by a trained observer (20).
A pragmatic approach is required for measurement of MTV and TLG to be feasible in clinical practice, with the intention of capturing the main areas of tumor bulk. It may not be possible or desirable to include every small involved node or areas that are difficult to measure, such as diffuse disease in the bone marrow. A minimum volume, perhaps 2 or 3 cm3 at baseline, is suggested to avoid including multiple small regions that may be time-consuming to measure when a manual method is used but do not contribute much to the overall volume (30,31). Smaller volumes may, however, need to be measured at the point of response assessment, as tumor residuals may be small. Acknowledging the uncertainties of this approach, technical validation could include measurement of the volume within compartments (e.g., nodal, splenic, and bone marrow compartments) as well as the total volume.
It is proposed to include, in the assessment of MTV and TLG, viable areas in lymph nodes with increased 18F-FDG uptake above a specified threshold; focal uptake in the spleen, irrespective of splenic size; diffuse increased uptake in the spleen, in the absence of reactive changes in bone marrow, greater than the hepatic uptake (i.e., when there is a reversed hepatosplenic ratio); and focal uptake in the bone marrow. It is uncertain exactly how to classify an abnormal hepatosplenic ratio. Splenic uptake greater than 1.5 times the hepatic uptake has been used previously but has not been validated (10,32,33). It is our experience that reactive changes in the bone marrow are often accompanied by similar changes in the spleen, and it is suggested that diffuse uptake in the spleen should not be included in the volume in this situation.
Diffuse uptake in the bone marrow occurs in approximately 1 in 5 patients with Hodgkin lymphoma (34) and is almost always due to reactive change; it was considered that such uptake should not be included in the MTV. In diffuse large B-cell lymphoma, diffuse uptake is more likely to indicate reactive change than lymphomatous involvement in the bone marrow compartment. However, when diffuse uptake is due to bone marrow involvement, the uptake usually reflects diffuse low-volume, and sometimes discordant, cellular infiltration (35–37), which probably has less of an impact on prognosis (38,39) than areas of tumor bulk. In follicular lymphoma, diffuse cellular infiltration of the bone marrow is commonly missed by 18F-FDG PET (40). Patients with follicular lymphoma who are referred for PET scanning typically have a high tumor burden and are being considered for immunochemotherapy; for such patients, inclusion of bone marrow with diffuse cellular infiltration may be less important. For these reasons, it is suggested that in the computation of MTV, focal uptake be included only for the 3 most common lymphoma subtypes: Hodgkin lymphoma, diffuse large B-cell lymphoma, and follicular lymphoma. In occasional cases of diffuse large B-cell lymphoma, there may be mainly marrow-based disease, with abnormally intense, diffuse 18F-FDG uptake confirmed on biopsy to represent bone marrow involvement; then, diffuse marrow uptake should be included in the measurement (Fig. 1).
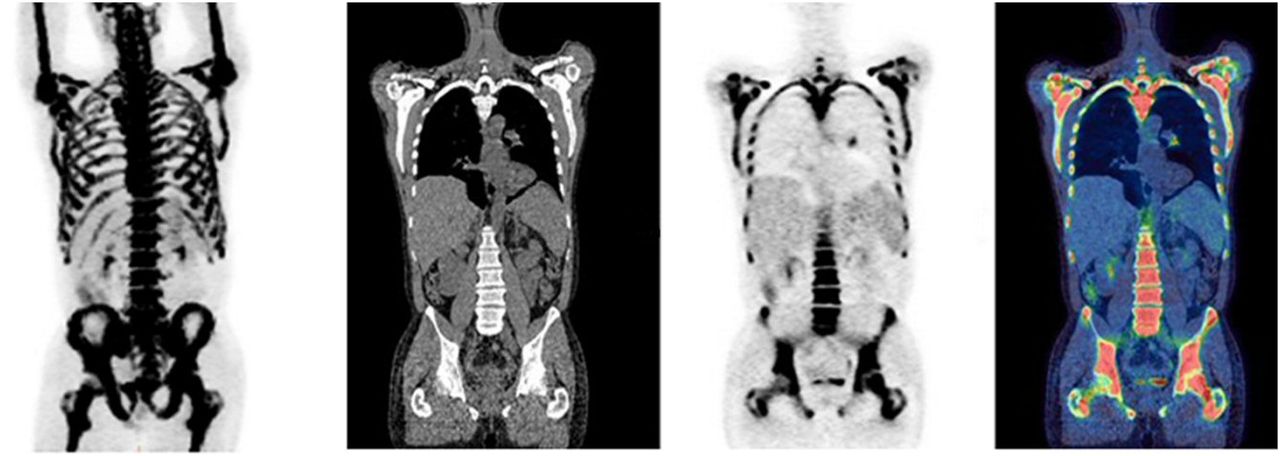
Maximum-intensity projection (left) CT, PET, and fused coronal images of patient with diffuse large B-cell lymphoma who had abnormally intense, diffuse uptake in bone marrow and minimal nodal involvement at left lung hilum. In this case, bone marrow involvement, which was confirmed on bone marrow biopsy, would seem appropriate to include in measurement of MTV.
WHICH THRESHOLDS SHOULD BE APPLIED TO SEGMENT MTV?
Satisfactory image quality and accurate quantification are key to ensuring reliable measurement of metabolic tumor burden. Solutions to deal with uncertainties in technical and biologic factors (41) are included in international guidance (42) and are commonly applied in trials and clinical practice for tumor imaging.
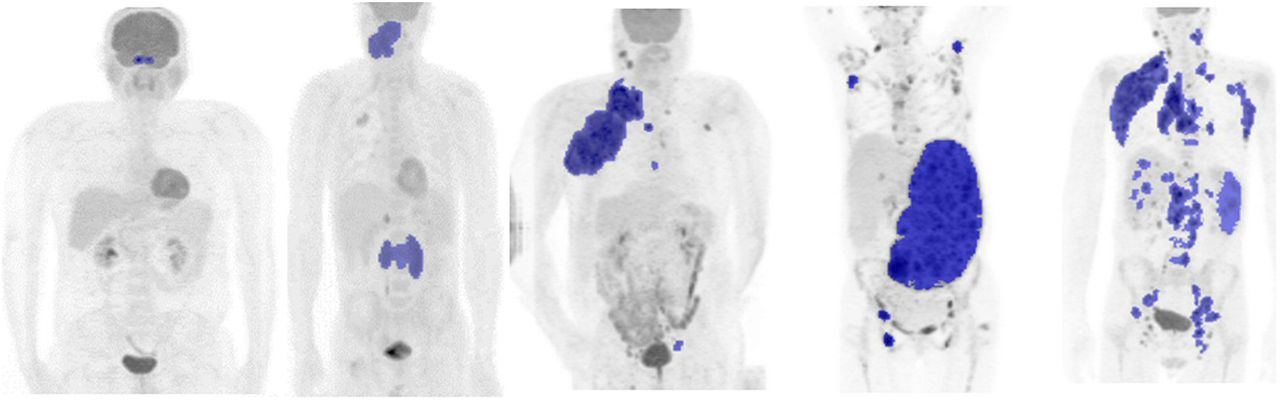
The segmentation of tumor is considerably more complex in patients with lymphoma than in those with solid tumors. There may be multiple sites of involvement in nodes and different extranodal sites, with large variability in lesion size and lesion shape, as well as heterogeneity of uptake and number (Fig. 2). Various contouring thresholds have been applied to outline tumor in lymphoma patients, perhaps because of this complexity. Results have been reported using absolute SUV thresholds applied to the entire image. The threshold may be fixed: for example, SUV equal to or greater than 2.5 (13,16,43,44), SUV equal to or greater than 4.0 (45), or SUV relative to a reference region such as the liver or mediastinum (46,47) as suggested in PERCIST (48). Results using percentage thresholds have also been reported: for example, outlining 41% (49–51) or 25% of the SUVmax in individual lesions and then summing them to calculate MTV (14,15). More complex image-processing methods, including gradient thresholds based on changes in the intensity of uptake at the edges of lesions (52); source-to-background–corrected contours (53); and statistical methods such as clustering (54), fuzzy locally adaptive Bayesian (55), and others, have been proposed but not applied much in lymphoma and possibly have no clinical advantage over simpler methods (56).

Examples of different sizes and distributions of tumor in 5 patients with diffuse large B-cell lymphoma.
The success of any delineation method will be influenced by tumor and imaging characteristics. The minimum SUV and SUVmax in the tumor and the spatial distribution will affect quantification (53,57). Significant underestimation of visible tumor may occur with absolute thresholds if many voxels in a tumor mass have low uptake that is less than the threshold (Fig. 3), and conversely, overestimation of visible tumor may occur if tumor lies adjacent to areas of high physiologic uptake with spillover of counts into normal tissues (47). Underestimation occurs with percentage thresholds when there is a high SUVmax and heterogeneity of uptake and many voxels have uptake that is lower than the threshold (Fig. 3); conversely, overestimation occurs when the SUVmax in the tumor is low but significant (e.g., an SUVmax of 4) and many voxels in the surrounding background are included in the contour.
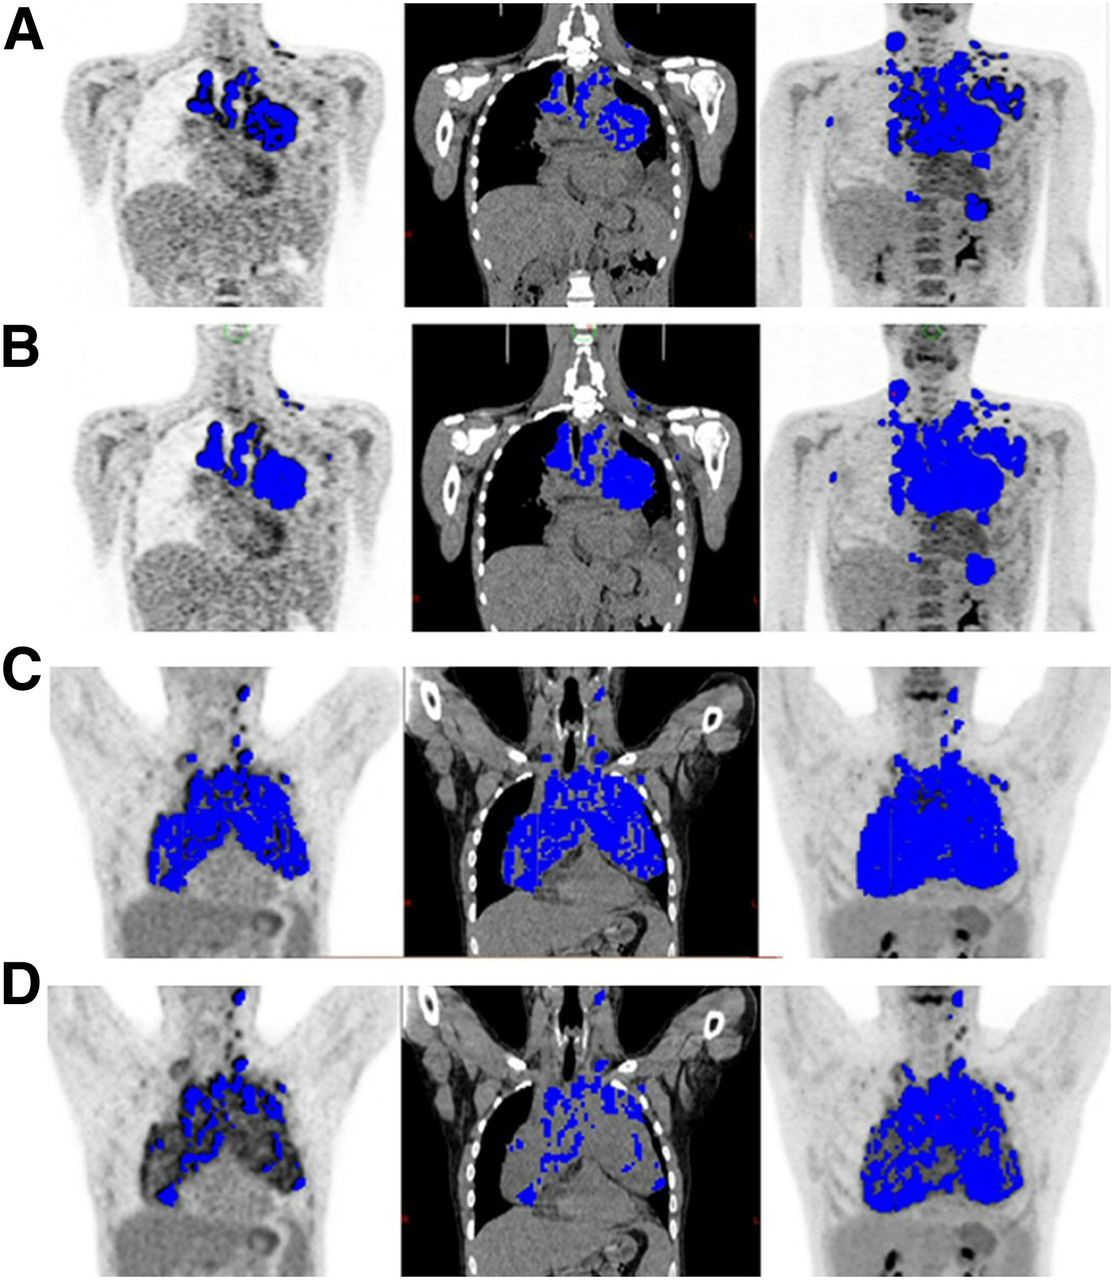
Representative PET (left), CT (middle), and maximum-intensity projection coronal images (right) for 2 patients. (A and B) Visible tumor is underestimated in one patient using percentage threshold (A) compared with absolute threshold (B). (C and D) In another patient, visible tumor is adequately assessed using percentage threshold (C) but underestimated using absolute threshold (D). Same absolute threshold (SUV of 4) and percentage threshold (41% of SUVmax) were used for both patients.
Image noise, the matrix size, image resolution, and reconstruction will also affect SUVs (58,59), although the impact of varying these parameters will be relatively more important in patients with smaller tumor volumes than in patients with advanced disease and large tumor volumes (53). MTV and TLG are much less sensitive to these influences than baseline metrics such as SUVmax and SUVpeak, and MTV is less affected by these imaging characteristics than TLG (which is the product of MTV and the SUVmean in the entire volume).
Irrespective of these challenges and the various thresholding methods applied to outline tumor in lymphoma, MTV and TLG remain strong prognostic indicators of patient outcomes (47). The different thresholds also appear to have good reproducibility between observers (47). Importantly, however, the use of different thresholds leads to different median values in study populations and, consequently, to different optimal cutoffs to separate patients into high- and low-risk groups (Table 1). The characteristics of the study population, including the range of volumes and the efficacy of treatment, also influence the cutoffs (60). The optimal cutoffs for prediction of risk using MTV and TLG may be unique to the particular patient characteristics, lymphoma subtype, and treatment and need to be derived for specific situations.
Characteristics Contributing to Different Medians and Optimal Cutoffs for Separating Patients into Risk Groups
Each thresholding method clearly has limitations, and it currently may not be possible to decide on a single best method. It may be worthwhile to investigate approaches proposed in radiation oncology to reduce interobserver variation, whereby more than one threshold is combined using semiautomated contouring to outline tumors. These methods include the STAPLE algorithm (Simultaneous Truth and Performance Level Estimation) and the majority vote, for which only voxels selected using most segmentation methods are included in the final outline (61). Artificial intelligence methods also appear promising, with selection of imaging features used as the basis for choosing one of several segmentation methods in an individual patient (e.g., ATLAAS algorithm) (62). The rationale is that no single thresholding method will perform optimally in every patient but that the best-performing method in the majority of patients will be obtained by combining the voxels included in the tumor outline by more than one delineation method. Evaluation of absolute and percentage thresholds is likely to be required in a benchmarking exercise for the technical validation of MTV.
WHICH SOFTWARE PACKAGES SHOULD BE USED, AND ARE MANUAL OR AUTOMATIC APPROACHES BETTER?
Given that all thresholds appear to perform in a similar way to predict patient outcomes, the most important requirements for a suitable measurement method are high success rates for segmenting visible tumor, ease of use, and provision of quick, consistent results suitable for testing in multicenter trials and, ultimately, clinical application.
Various software options exist for measuring MTV and TLG, and some work better than others using different thresholds. Broadly speaking, most use some form of automatic segmentation that can then be adjusted manually. Such options may comprise the observer point-picking areas of tumor while avoiding areas of physiologic uptake or, in contrast, fully automated selection of regions of uptake applying one or more thresholds, with subsequent removal of physiologic uptake by the observer.
The former, using seed-growing algorithms for point-picking, is often easier when there are few areas of tumor present and they are well separated from areas of high uptake such as the brain, heart, or urinary system (Figs. 2C and 2D). In this scenario, the total MTV can be measured rapidly without the need for further editing, but the method is more observer-dependent and time-consuming than fully automatic segmentation when there is multifocal tumor.
Fully automated segmentation is easier with multiple tumor regions (Fig. 2E) but always requires removal of physiologic uptake. Cropping to avoid slices at the top (e.g., including brain uptake) and bottom (e.g., bladder uptake) of the image may reduce the amount of editing required, if the tumor distribution allows, but this process is sometimes difficult, especially in follicular lymphoma.
The software that performs best will therefore vary by disease distribution and threshold chosen, and the 2 approaches should be combined in the same software package. Academic groups have developed shareware for research, recognizing that automation is highly desirable. These include LIFEx (https://www.lifexsoft.org) (63), FIJI (https://fiji.sc/), and ACCURATE (64). Ultimately, though, engagement with manufacturers is important for regulatory approval and for maintenance and development of the software for clinical use. Proprietary software solutions for measuring metabolic tumor burden using adaptive thresholding have been approved and, although useful for general reporting, are not widely applicable.
WHERE SHOULD WE GO FROM HERE?
It is proposed to collect representative baseline scans from patients with early and advanced Hodgkin lymphoma, early and advanced diffuse large B-cell lymphoma, and follicular lymphoma with high tumor burden. Scans could be collated from existing international published data sets (the number in each group to be decided) that are representative of the variation in 18F-FDG uptake and image quality seen in clinical practice using a range of available technologies (Fig. 4).
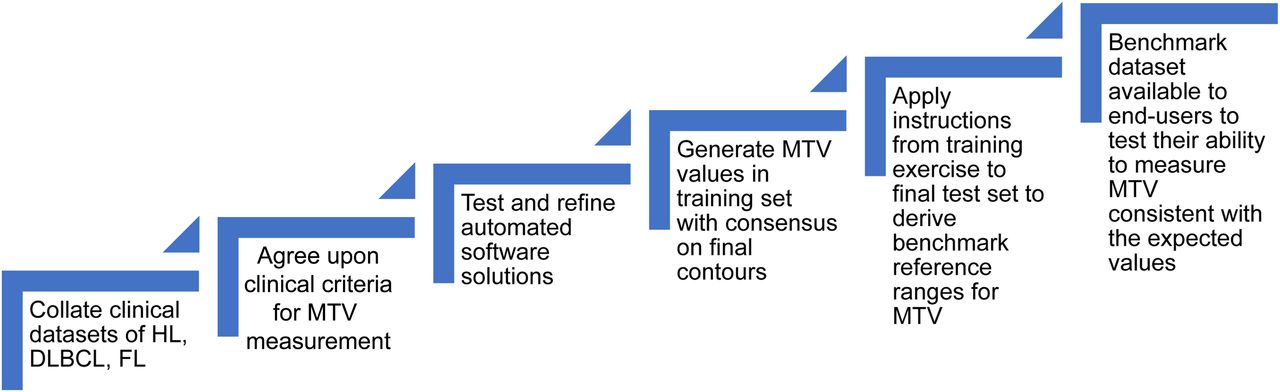
Road map for possible benchmarking exercise. DLBCL = diffuse large B-cell lymphoma; FL = follicular lymphoma; HL = Hodgkin lymphoma.
Consensus criteria for inclusion of lesions in MTV and TLG could be formulated, on the basis of pragmatic choices, as suggested in this article. Measurement could be undertaken using available automated software developed by academic groups or, alternatively, using a new consensus method with region preselection based on the commonly applied absolute and percentage thresholds, with minimum volumes to be agreed upon based on similar work in radiation oncology (61). Using consensus criteria and automated selection of regions, MTVs and ranges could be generated for a training data set using 2 or more thresholds by observers from international groups. The final consensus contours should be agreed upon by an expert panel. Detailed instructions based on this training data set will allow reference MTVs to be generated for a separate test data set. This data set could provide a benchmark against which end-users in trials and clinical practice could test their ability to measure MTVs that are consistent with the expected values.
Automated software solutions could be shared with manufacturers, with a set of minimum functionalities required to minimize MTV measurement variability. Manufacturers should be encouraged to include these tools in standard work packages. This technical validation is the first step needed before MTV and TLG are prospectively or retrospectively tested as prognostic markers in specific populations to define cutoffs for risk stratification of patients treated with standard or experimental therapy. Risk stratification using MTV will likely involve integration with other baseline parameters such as clinical prognostic scores (10,13,50), possibly as continuous variables and perhaps in combination with response assessment (13,65).
CONCLUSION
We believe that segmentation of MTV should require minimal observer interaction (although this is inevitable in some cases); should not be vendor-specific; should work in different software environments; should require commercial support and regulatory approval; should be ideally integrated into the clinical workflow of all platforms, without the requirement to purchase separate packages for volume measurement; and should comply with the proposed benchmark standard as suggested in this paper. If these requirements are fulfilled, different software programs implementing the same delineation methods and used with the same settings should give MTVs within an acceptable prespecified range everywhere in the world.
DISCLOSURE
Sally Barrington acknowledges support from the National Institute for Health Research (RP-2-16-07-001). King’s College London and UCL Comprehensive Cancer Imaging Centre are funded by the CRUK and EPSRC in association with the MRC and Department of Health and Social Care (England). Michel Meignan is the scientific coordinator of LYSA Imaging. LYSA is a cooperative group of hematologic centers involved in lymphoma care. It is a nonprofit organization supported by the French National Cancer Institute. The views expressed are those of the authors and not necessarily those of the NHS, the National Institute for Health Research, the Department of Health and Social Care (England) or LYSA. No other potential conflict of interest relevant to this article was reported.
Acknowledgments
We thank our colleagues who contributed to this article, including the experts who participated in the focus group meeting in Paris (Ronald Boellaard, Irene Buvat, Olivier Casasnovas, Stephane Chauvie, Anne-Ségolene Cottereau, Andrea Gallamini, Salim Kanoun, Carsten Kobe, N. George Mikhaeel, Lucy Pike, Romain Ricci, and Annibale Versari), the experts who presented data or chaired sessions about this topic during the main PET International Lymphoma and Myeloma (PILM) Workshop in Menton (Ash Alizadeh, Ronald Boellaard, Irene Buvat, Olivier Casasnovas, Corinne Haioun, Martin Hutchings, Salim Kanoun, Lale Kostakoglu, David Kurtz, N. George Mikhaeel, Alison Moskowitz, Judith Trotman, Luigi Rigacci, Heiko Schöder, Lawrence Schwartz, Sigrid Stroobants, Hervé Tilly, and Jan Zaucha), and other members of the scientific committee who contributed to the closed expert session about this topic at PILM (Marc Andre, Abraham Avigdor, Stephanie Becker, Alberto Biggi, Francoise Bodéré, Caroline Bodet-Milin, Luca Ceriani, Monica Coronado, Eldad Dann, Ulrich Dührsen, Veronique Edeline, Tarec El-Galaly, Massimo Federico, Rosa Fonti, María José Garcia Velloso, Christian Gisselbrecht, Michele Gregianin, Corinne Haioun, Ken Herrmann, Andreas Hüttmann, Regina Klüge, Andrew Lister, Stefano Luminari, Maurizio Martelli, Philippe Moreau, Cristina Nanni, Wim Oyen, Marco Picardi, Alina Riedinger, Jesús San Miguel, Sigrid Stroobants, Ilan Tal, Jean-Noel Talbot, Catherine Thieblemont, Hervé Tilly, Emelie Van Zele, Thierry Vander Borght, Elena Zamagni, Josée Zijlstra, and Emanuele Zucca). We also thank Ronald Boellaard, Irene Buvat, Stephane Chauvie, Carsten Kobe, and Annibale Versari for reviewing and appraising the manuscript.
Footnotes
Published online Apr. 6, 2019.
- © 2019 by the Society of Nuclear Medicine and Molecular Imaging.
REFERENCES
- Received for publication February 7, 2019.
- Accepted for publication March 28, 2019.


Jump to section
Related Articles
Cited By...
- No citing articles found.