


Abstract
Treatment of oropharyngeal squamous cell carcinoma with chemoradiotherapy can now accomplish excellent locoregional disease control, but patient overall survival (OS) remains limited by development of distant metastases (DM). We investigated the prognostic value of staging 18F-FDG PET/CT, beyond clinical risk factors, for predicting DM and OS in 176 patients after definitive chemoradiotherapy. Methods: The PET parameters maximum standardized uptake value (SUVmax), metabolic tumor volume (MTV), and total lesion glycolysis (TLG) were recorded. Univariate Cox regression was used to examine the prognostic value of these variables and clinical prognosticators for local treatment failure (LTF), OS, and DM. Multivariate analysis examined the effect of SUVmax, TLG, and MTV in the presence of other covariates. Kaplan–Meier curves were used to evaluate prognostic values of PET/CT parameters. Results: Primary tumors were distributed across all stages. Most patients underwent chemoradiotherapy only, and 11 also underwent tonsillectomy. On univariate analysis, primary tumor MTV was predictive of LTF (P = 0.005, hazard ratio [HR] = 2.4 for a doubling of MTV), DM and OS (P < 0.001 for both, HR = 1.9 and 1.8, respectively). The primary tumor TLG was associated with DM and OS (P < 0.001, HR = 1.6 and 1.7, respectively, for a doubling of TLG). The primary tumor SUVmax was associated with death (P = 0.029, HR = 1.1 for a 1-unit increase in standardized uptake value) but had no relationship with LTF or DM. In multivariate analysis, TLG and MTV remained associated with death after correcting for T stage (P = 0.0125 and 0.0324, respectively) whereas no relationship was seen between standardized uptake value and death after adjusting for T stage (P = 0.158). Conclusion: Parameters capturing the volume of 18F-FDG–positive disease (MTV or TLG) provide important prognostic information in oropharyngeal squamous cell carcinoma treated with chemoradiotherapy and should be considered for risk stratification in this disease.
Head and neck cancer continues to be a significant health care problem worldwide; in the United States, oropharyngeal squamous cell carcinoma (OPSCC) is the most common subtype (1). Most patients with OPSCC are now treated with intensity-modulated radiotherapy (IMRT) and concurrent chemotherapy. This regimen permits organ preservation, has less morbidity than surgical resection of the primary tumor (2), and achieves excellent locoregional control (3). In contrast, development of distant metastases (DM) remains a problem, portends a poor prognosis (4), and has in fact become the major factor in limiting patient survival. If patients at high risk for DM or death could be identified a priori, this might help in designing individualized treatment plans and follow-up regimens for these individuals.
Defining disease extent solely by clinical examination and structural imaging may not be adequate (5). 18F-FDG PET/CT is a useful test in detecting regional and distant disease from head and neck cancer at the time of initial staging (6,7); its prognostic value has also been investigated (8–11), but the inclusion criteria in these studies varied widely. We believe the value of PET should be assessed considering tumor location, histopathology, treatment modality, and separately in patients with primary versus recurrent disease. Moreover, most previous studies testing the prognostic value of 18F-FDG PET used only the metric of maximum standardized uptake value (SUVmax), which measures the 18F-FDG concentration in a single voxel of metabolically active tissue. We investigated whether 3-dimensional 18F-FDG PET/CT indices that capture tumor burden and aggressiveness provide better prognostic information than SUVmax and whether these indices have incremental prognostic value beyond widely accepted clinical factors for DM and death.
MATERIALS AND METHODS
Patient Population and Treatment Regimens
This retrospective analysis was approved by our Institutional Review Board; patient consent was not required. Our analysis was restricted to patients with 18F-FDG PET/CT results (rather than PET-only results) because combined PET/CT improves the anatomic localization of abnormalities and accuracy of scan interpretation (12). To ensure relative uniformity in technique and quality of scans, those patients having undergone 18F-FDG PET/CT elsewhere before referral to our institution were excluded. Patients with DM at presentation noted on conventional imaging or staging 18F-FDG PET/CT were also excluded.
All patients were uniformly treated with IMRT to 70 Gy (simultaneous integrated boost), and most received concurrent chemotherapy. Single-agent cisplatin was the primary choice of chemotherapeutic agent (2–3 cycles of a 100 mg/m2 dose of cisplatin on days 1, 22, and 43). Some individuals were treated with other regimens (Table 1). After completion of therapy, patients were assessed by clinical examination and PET/CT at approximately 10–12 wk. Thereafter, clinical examinations and CT or MRI of the neck were performed every 2–3 mo for the first 2 y and every 4–6 mo thereafter (3). The occurrences of local treatment failure (LTF), DM, and death were recorded from the medical records.
Patient Characteristics
18F-FDG PET/CT
In preparation for PET/CT, patients fasted for 6 h, but water intake was encouraged. After a blood glucose level of less than 200 mg/dL (median, 95 mg/dL; mean, 99 mg/dL; range, 55–198 mg/dL) was confirmed, 18F-FDG (425.5–573.5 MBq [11.5–15.5 mCi]) was injected intravenously, followed by a 72 ± 17 min uptake period, during which patients drank diluted oral contrast. Low-dose CT (120–140 kV, 80 mA) and PET scans were then obtained for the torso (3 min/bed position, thoracic inlet to upper thigh) with the arms up, followed by dedicated images of the head and neck (5 min/bed position) with the arms down. For radiotherapy planning scans, intravenous contrast was also administered. All images were reviewed on a workstation integrated with a PACS (Volume Viewer 2, AW Suite, version 2.0; GE Healthcare) that allowed multiplanar reformatting of images.
18F-FDG PET Image Analysis
Volumetric regions of interest were placed over areas of abnormal 18F-FDG uptake. Initially, SUVmax (maximum voxel intensity within the volumetric region) was recorded for the primary tumor and neck lymph nodes. Region-of-interest borders were set by manual adjustment in 3 planes to conform to nodal levels in the neck and to exclude adjacent 18F-FDG–avid structures. Nodal disease was recorded for each neck level (13). A threshold of 42% of the maximum signal intensity (14) was used to delineate the metabolic tumor volume (MTV). Total lesion glycolysis (TLG) was calculated as the product of lesion mean standardized uptake value (SUV) and MTV (15).
Statistical Analysis
Missing uptake data were imputed for 3 patients with no measurable 18F-FDG uptake in primary tumors (2 with tonsillectomy before PET/CT and 1 with unknown primary) using cold deck imputation with the mid-point method (16). Eighteen individuals without nodal disease on 18F-FDG PET/CT had values for nodal SUVmax, MTV, or TLG imputed analogously. For analysis of lymph nodes, we used the highest SUVmax (respectively, the highest MTV or TLG) in any neck level. In the cases with bilateral neck disease, only the highest SUVmax (respectively, the highest MTV or TLG) from either neck side was used. MTV and TLG were found to be right-skewed and were log-transformed to better fit a normal distribution. Descriptive statistics for PET/CT variables are based on the preimputation data. Outcomes recorded included time to death, DM, and LTF measured from the start of radiotherapy. Follow-up for LTF was censored at the time of DM or neck recurrence. We examined the association between SUVmax, MTV, and TLG for primary tumor and metastatic nodes and clinical variables (demographics, location of primary tumor, T and N stages, nodal spread beyond level 2) and patient outcome using univariate Cox proportional hazards regression. The effect of tobacco exposure was studied using both smoking status (current, former, and never) and pack-years (less than 20 and 20 or more; the latter is not included in final models because it was not significant on its own and did not alter the effect of smoking status). Lymph node PET parameters were not examined as predictors of LTF because an association seemed implausible. We further explored the relationship between PET/CT variables, DM, and overall survival (OS) using Kaplan–Meier curves stratified by quartiles of SUVmax, MTV, and TLG and the log-rank test.
The small number of events in this dataset limited the number of factors we could adjust for in multivariate modes. Because T stage is a strong prognostic variable and may hold some of the same information as the PET parameters, we built OS models with T stage and each PET parameter that satisfy the widely accepted criterion of requiring 10–15 events per variable in a multivariate model. To assess the ability of different models to discriminate between high- and low-risk individuals, the concordance probability estimate (CPE) method was used to estimate the concordance probability for various models (17). The optimal cutoff for primary tumor MTV as a predictor of survival was chosen using the maximally selected log-rank statistic (18). A 2-sided P value of less than 0.05 was considered significant. All analyses were performed in SAS 9.2 (SAS Institute Inc.) and R 2.11.1 (The R Foundation for Statistical Computing).
RESULTS
Patients and Treatment
An institutional database showed that 442 patients with OPSCC underwent chemoradiotherapy between September 1998 and May 2009. Of these, 266 patients were not considered eligible because 18F-FDG imaging had been performed as PET-only (rather than as PET/CT), or PET/CT had been performed at outside institutions. All of the remaining 176 patients underwent initial-staging 18F-FDG PET/CT and therapy at our institution in 2002 or later and form the basis for this study (Table 1). Eleven patients underwent tonsillectomy in addition to chemoradiotherapy (3 of them before PET/CT; in 2 cases, the subsequent PET/CT scan still showed abnormal uptake in the tonsillar fossa). Twenty-five patients underwent neck dissection after chemoradiotherapy for suspected residual disease; only 5 showed minimal residual disease on histopathology. The mean time interval between PET/CT and the start of therapy was 3 wk (median, 2.4 wk).
18F-FDG PET/CT Findings
The median (±SD) primary tumor SUVmax, MTV, and TLG were 13.6 ± 5.5 g/mL (range, 3.4–28.2 g/mL), 9.7 ± 12.9 cm3 (range, 1.2–113.0 cm3), and 81.4 ± 191.8 g (range, 5.4–1,964.4 g), respectively. The median (±SD) SUV, MTV, and TLG for all metastatic lymph nodes were 8.3 ± 4.6 g/mL (range, 2.4–33.3 g/mL), 5.0 ± 8.4 cm3 (range, 0.5–60.8 cm3), and 23.1 ± 70.9 g (range, 2.7–442.7 g), respectively. PET parameters for the various neck node levels are shown in Supplemental Table 1 (supplemental materials are available online only at http://jnm.snmjournals.org). TLG and MTV were highly correlated, and TLG and SUV were moderately correlated. Correlation between MTV and SUV was weak (Supplemental Table 2).
Patient Outcome
There were 137 survivors during the study period, of whom 125 (91%) were followed for more than a year and 99 (72%) were followed for more than 2 y. The median follow-up period was 41.0 mo (range, 6.5–80.9 mo) for surviving patients. Over the course of the study period, local failure occurred in 13 of 176 patients. Two of these 13 local failures were censored for analysis because of earlier regional or distant recurrences. The estimated 2-y local failure rate was 7.6% (95% confidence interval [CI], 4.2%–13.4%). DM occurred in 32 of 176 patients, and the estimated 2-y DM rate was 17.9% (95% CI, 12.7%–24.8%). In total, 39 patients died. Twenty-five patients had a documented DM at the time of death, 3 patients died of a second primary malignancy, 2 died from progressive locoregional disease, and the remainder died from cardiovascular, neurologic, or infectious diseases; the cause of death remained unclear in 3 patients. The estimated OS at 2 y was 83.9% (95% CI, 77.2%–88.8%).
Univariate Analysis
Univariate Cox analysis investigated the association between clinical parameters; 18F-FDG PET/CT variables; and LTF, OS, and DM. These results are shown in Table 2. Among clinical parameters, advanced T stage was associated with local failure (P = 0.014) and poor OS (P < 0.001), whereas advanced N stage was associated with poor OS (P = 0.032) and an increased hazard of DM (P = 0.014). In addition, age was associated with LTF. Smoking status was not associated with LTF, DM, or OS (all P > 0.20). Primary tumor MTV and TLG were found to be strong predictors of DM and OS (P < 0.001). A doubling of MTV resulted in a 1.8-fold increase in the hazard of death and a 1.9-fold increase in the hazard of DM. Similarly, a doubling of TLG resulted in a 1.7-fold increase in the hazard of death and a 1.6-fold increase in the hazard of DM. MTV and TLG were also associated with LTF, with hazard ratios (HRs) of 2.4 and 1.9, respectively, for doubling. Primary tumor SUVmax was associated with death (an HR of 1.1 for a 1-unit increase in SUVmax) but did not have an association with DM or LTF. A spread of metastatic disease beyond neck level 2 (defined as 18F-FDG–positive lymph node on PET/CT) resulted in a 2.2-fold increased hazard of death and a 2.5-fold increased hazard of DM.
Association Between PET Variables and OS, DM, and LTF from Univariate Cox Models
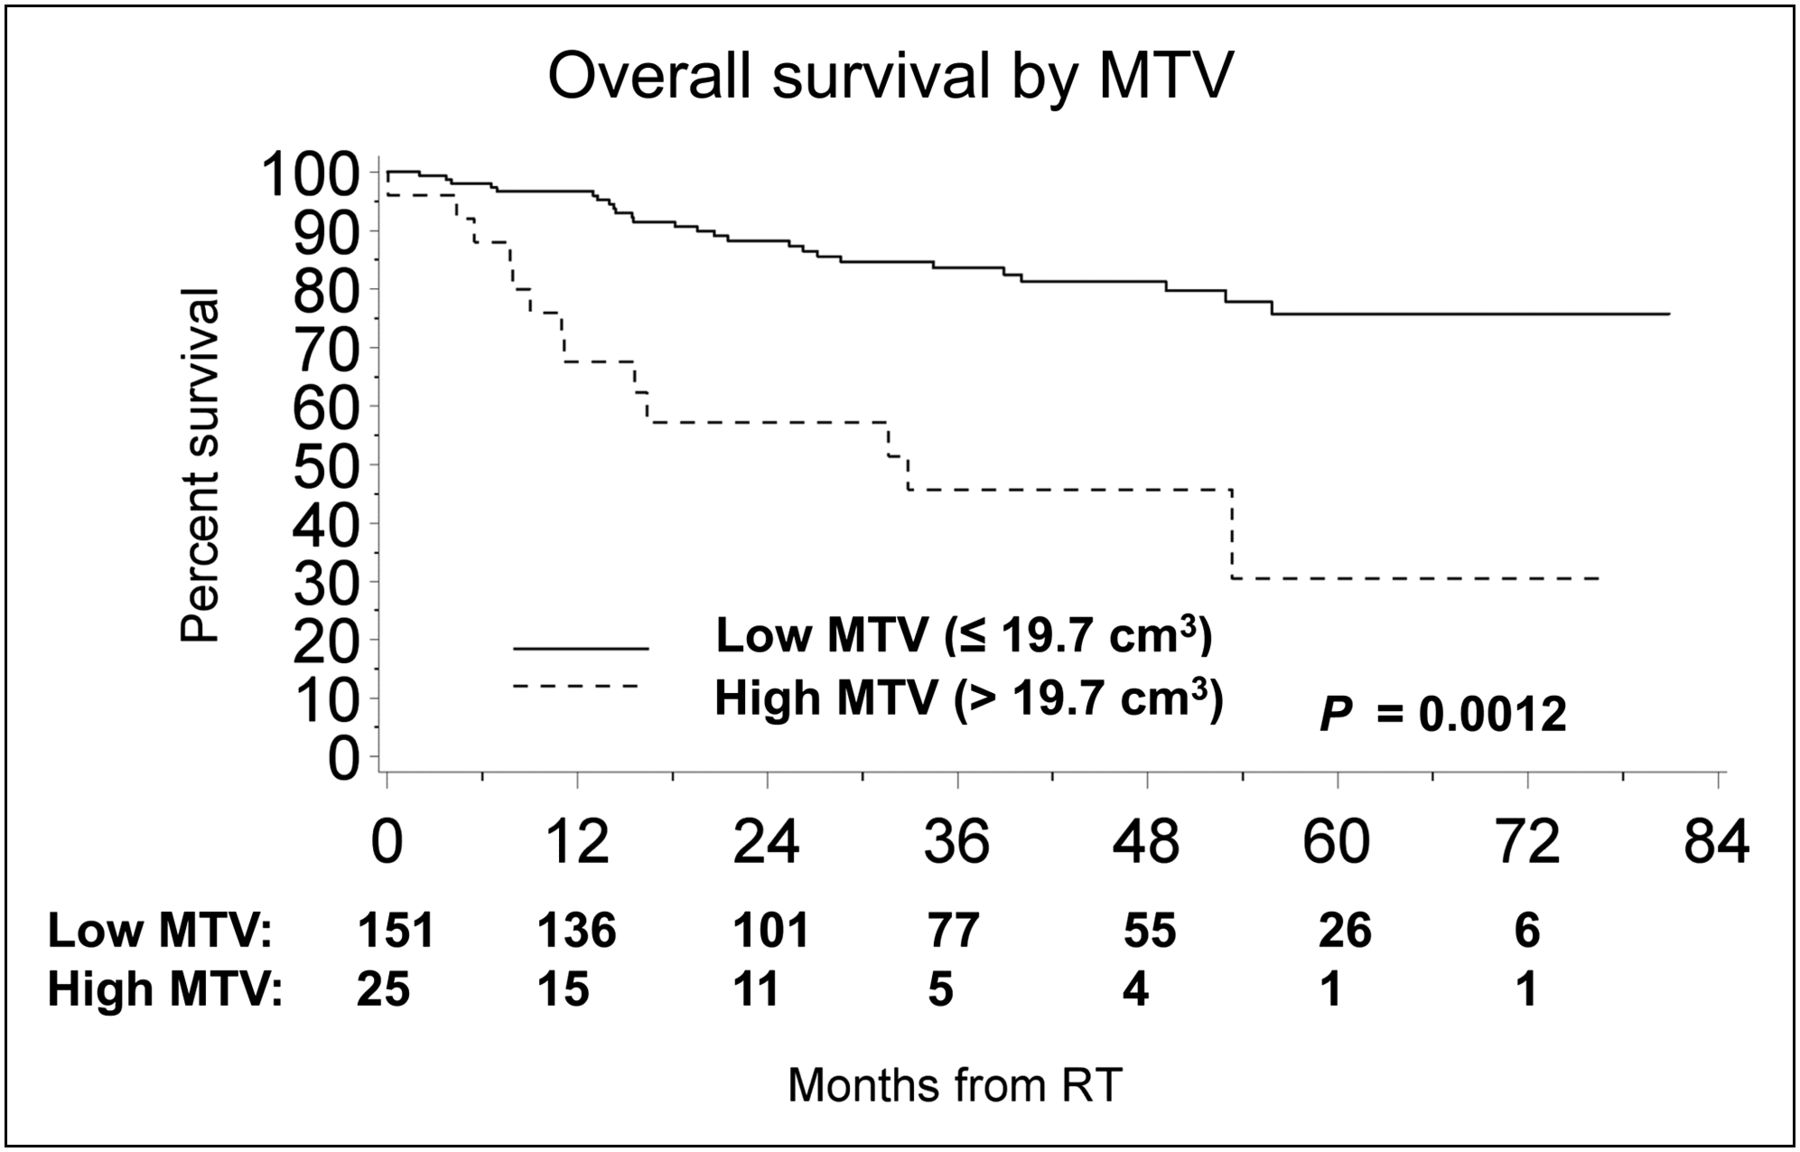
We next analyzed the relationship between PET/CT variables and DM and OS stratified by quartiles of each variable; Kaplan–Meier curves are shown in Figures 1 and 2 for MTV and TLG and in Supplemental Figure 1 for SUVmax. Results from the log-rank test comparing quartile groups were similar to those observed with Cox models. There was a weak trend toward worse survival with increasing SUVmax (log-rank P = 0.085); TLG quartile was associated with OS (P = 0.018); and MTV quartile was associated with both DM (P = 0.007) and OS (P = 0.027). Because patients in the highest quartile of MTV had notably worse survival than patients in the other 3 groups, we considered using MTV to define 2 groups rather than 4. To find the optimal MTV for separating patients with high hazard of death, we used a maximally selected log-rank statistic and identified an MTV cutoff of 19.7 cm3 (Fig. 3). The difference in OS between the 2 groups is significant (P = 0.001 after correcting for the selection procedure).
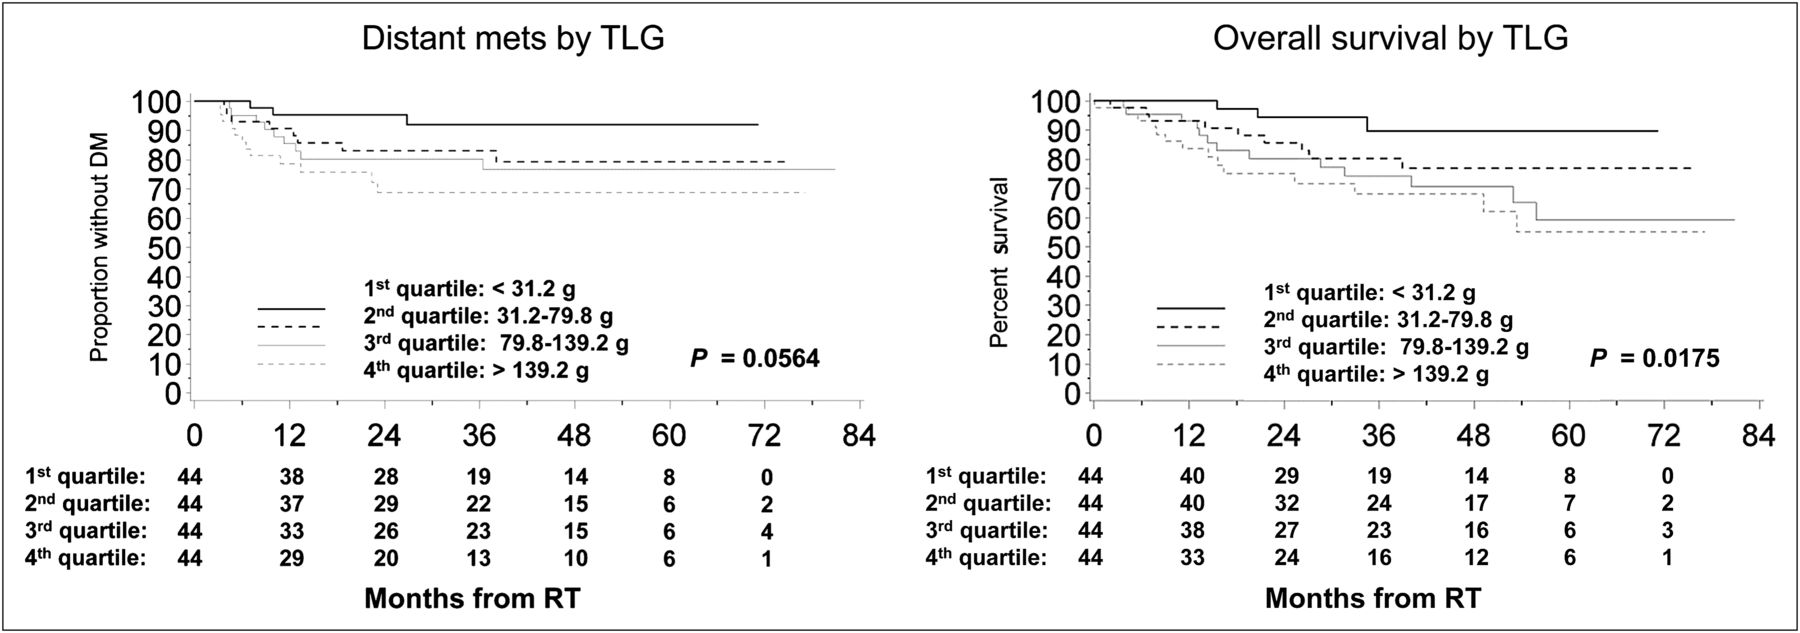
Kaplan–Meier curves for PET/CT variable TLG for developing DM or death are stratified by quartiles of each variable. mets = metastases.
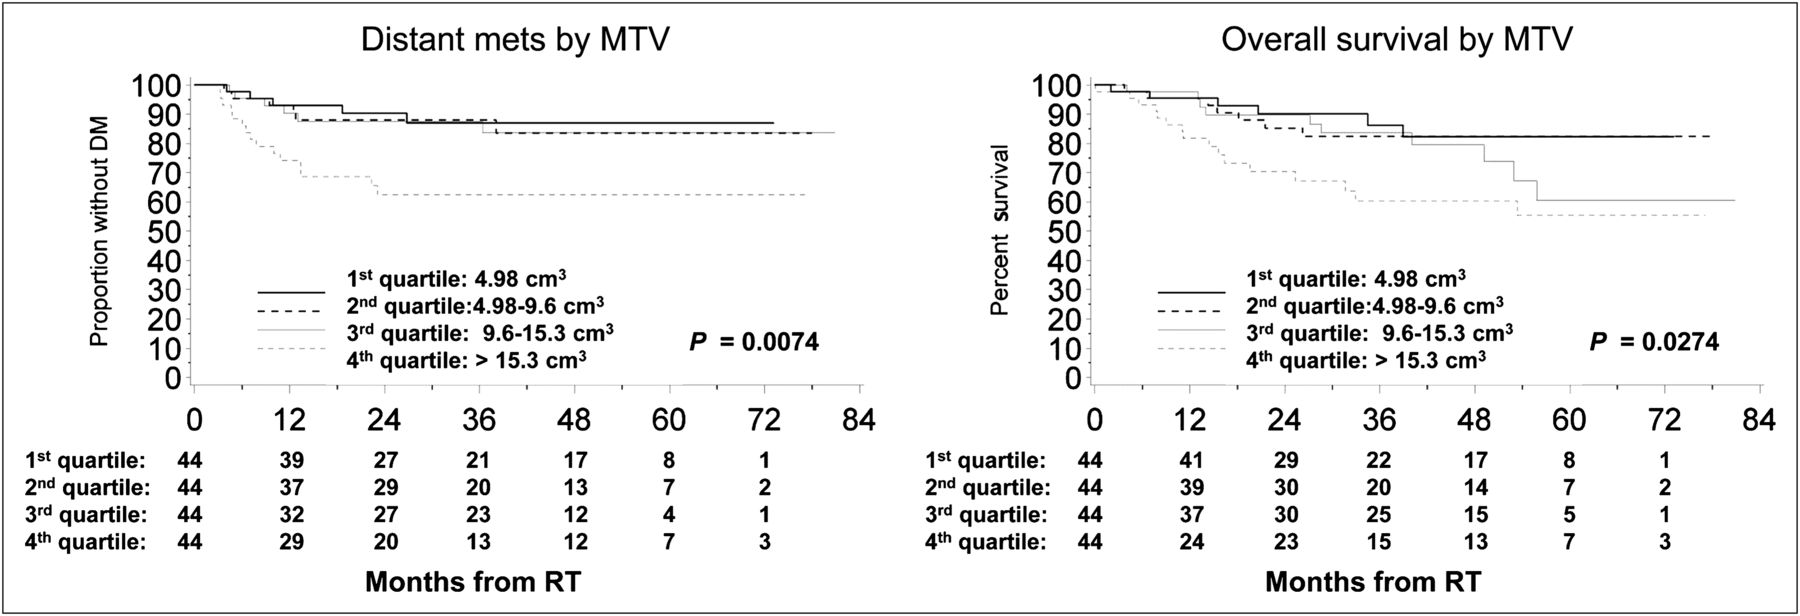
Kaplan–Meier curves for PET/CT variable MTV for developing DM or death are stratified by quartiles of each variable. mets = metastases.

Kaplan–Meier curve illustrating prognostic value of primary tumor MTV for OS. This optimal MTV for identifying patients at high hazard of death is 19.7 cm3. RT = radiotherapy.
To measure the discriminatory power of the PET parameters, we estimated the concordance of Cox models with each parameter using the CPE method. Concordance is the probability that a patient with higher model-predicted risk dies before another patient with lower risk; a higher concordance probability corresponds to a better risk model. For both outcomes, TLG and MTV performed better than SUVmax, although the differences were not significant. Estimated concordance for TLG were 0.69 (95% CI, 0.62–0.77) and 0.67 (95% CI, 0.59–0.76) for OS and DM, respectively; for MTV they were 0.67 (95% CI, 0.6–0.74) and 0.68 (95% CI, 0.61–0.76), and for SUVmax they were 0.59 (95% CI, 0.51–0.67) and 0.54 (95% CI, 0.45–0.64).
Multivariate Analysis
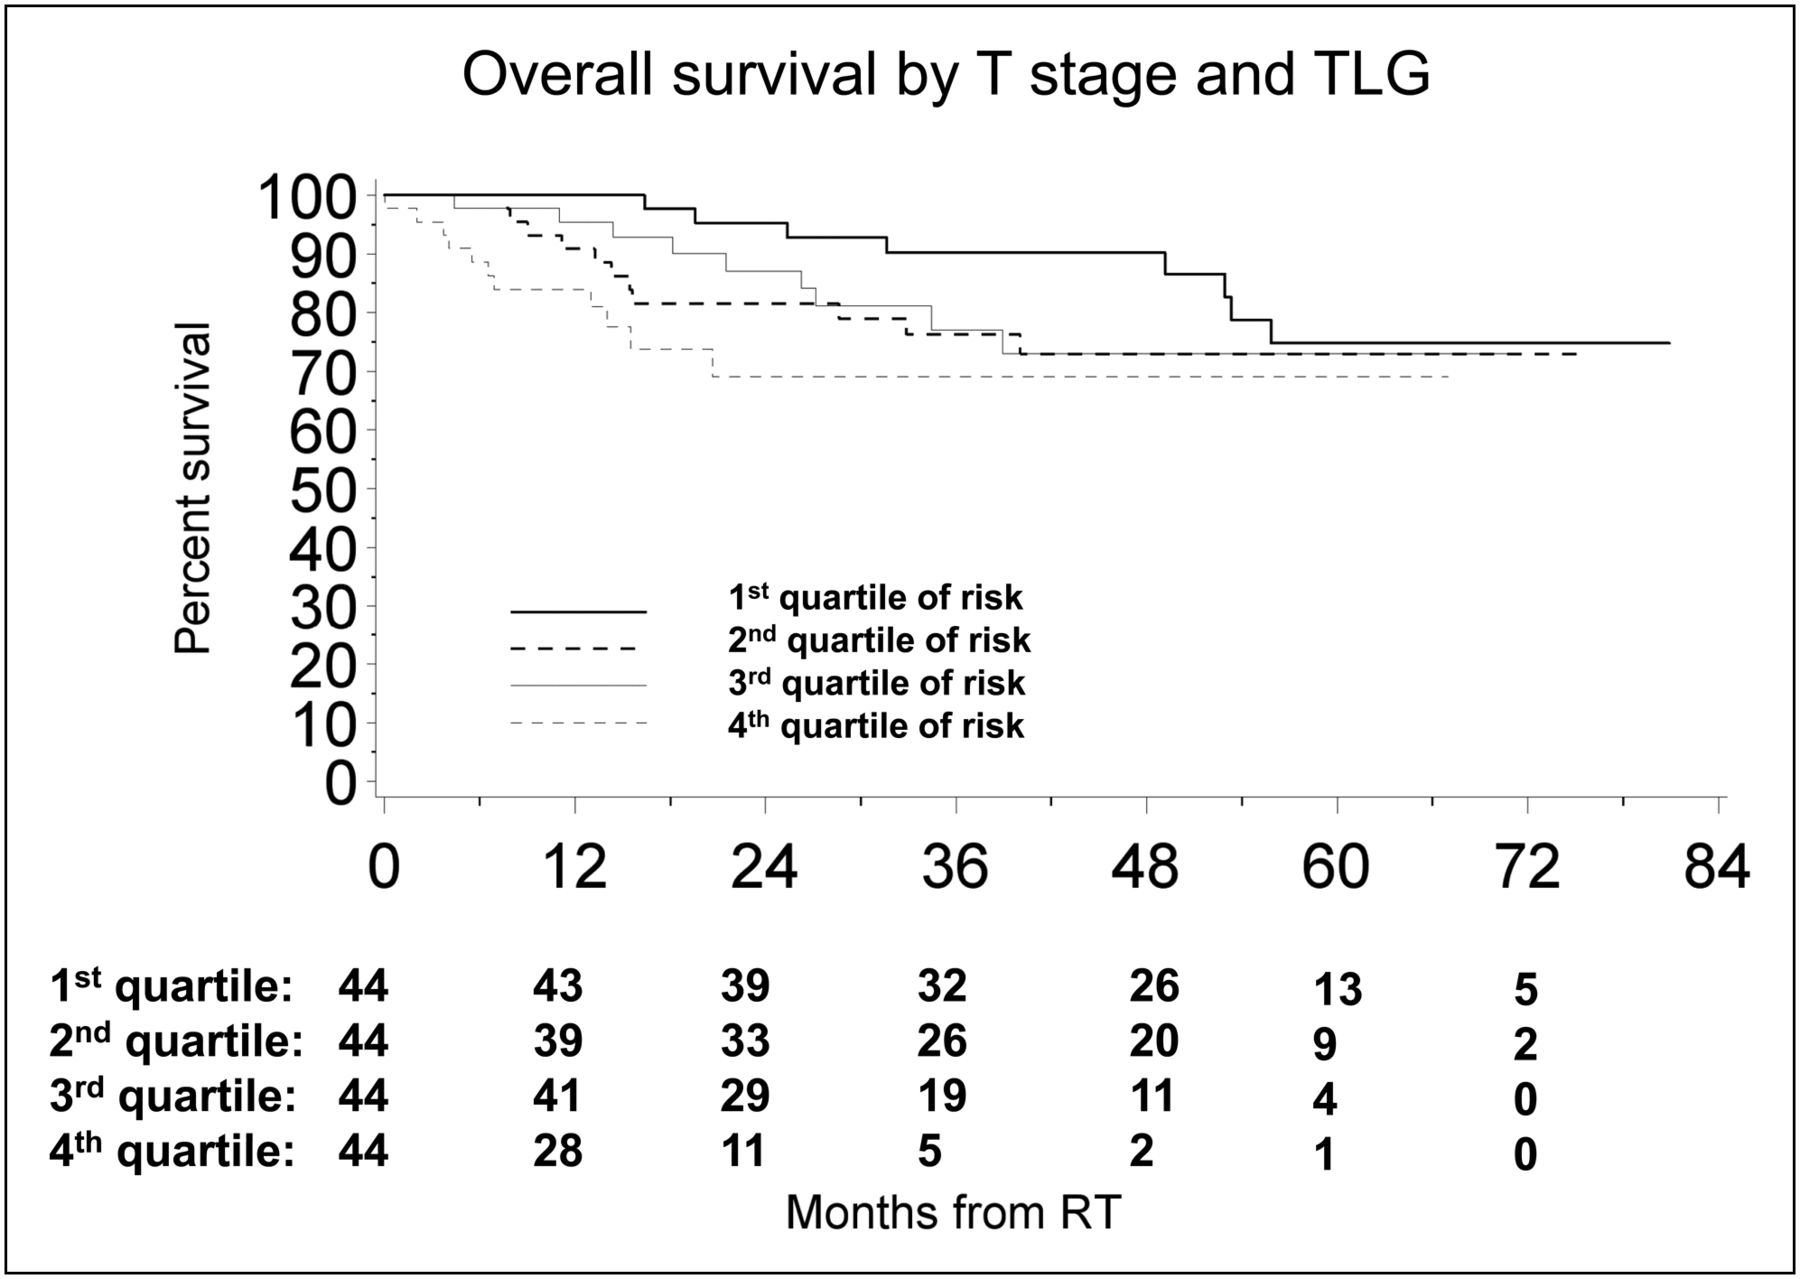
Multivariate analysis was performed to determine whether the PET/CT parameters were independently associated with OS after correcting for T stage (Table 3). After adjusting for T stage, primary tumor SUVmax was not associated with OS (P = 0.16). Primary tumor MTV and TLG, however, did remain significant after adjusting for T stage, with P values of 0.032 and 0.013, respectively, and HRs of 1.45 and 1.43, respectively, for a doubling in the covariate. To assess the incremental value of the PET parameters over T stage, we calculated the CPE. The model with T stage and TLG resulted in the highest discrimination, with a CPE of 0.7 (95% CI, 0.64–0.77), followed by T stage and MTV (CPE, 0.69; 95% CI, 0.62–0.75) and T stage and SUV (CPE, 0.67; 95% CI, 0.6–0.74), all compared with the model with T stage alone (CPE, 0.64; 95% CI, 0.58–0.69). A Kaplan–Meier curve stratified by quartiles of risk as predicted by the model containing T stage and TLG is shown in Figure 4.
Association Between PET Variables and OS Adjusted for T Stage

Kaplan–Meier curves illustrating prognostic value of Cox model with primary tumor TLG and T stage. Patients are divided into quartiles of TLG based on their model-assigned risk. RT = radiotherapy.
DISCUSSION
In the largest series to date, we show that 18F-FDG PET/CT indices of metabolic tumor burden (MTV, TLG) show a strong correlation with the development of DM or death in patients with OPSCC treated with IMRT and concurrent chemotherapy.
Prior studies evaluating the prognostic value of 18F-FDG PET in head and neck cancer mostly applied SUVmax, as the biomarker of choice, because it is commonly used in clinical practice; many of these studies noted a prognostic value of SUVmax (8,19–21). For instance, in a study of 120 patients, primary tumor SUVmax correlated strongly with poor local control and disease-free survival (8). However, in some other studies, SUVmax was not associated with short-term outcomes or disease-free survival (9) and did not predict recurrence (22). A major confounding factor in all of these studies was the inclusion of tumors from various head and neck sites, with different tumor biology; differing etiology, risk factors, and clinical presentation; and different overall prognosis (23). Moreover, the location of the primary tumor may mandate different treatment regimens. All of these factors may potentially skew the data analysis. Therefore, our study focused on a relatively large population of patients with primary OPSCC treated with IMRT and concurrent chemotherapy.
Our findings suggest that TLG may provide better prognostic information than SUVmax. This finding appears plausible because TLG considers the volume of metabolically active disease (in addition to the level of tumor glucose utilization). Although this is concordant with surgical data showing worse outcome with increasing primary tumor size and burden of nodal metastases, our comprehensive analysis circumvents the obvious limitations inherent to simple clinical size assessment or size measurements by imaging. First, traditionally T stage for oropharyngeal carcinoma takes into account only the greatest single dimension of the primary tumor (T1–T3) or infiltration of surrounding tissue (T4). In addition, neither clinical examination nor simple structural assessment can differentiate reliably between viable tumor, edema, and necrosis. In contrast, our data are based on the combined measurement of metabolically active tumor burden and glucose utilization in these lesions. Of note, studies in oral cavity and larynx cancer have shown that tumor volume derived from 18F-FDG PET/CT data correlates better with gross pathology volume than volumes measured on CT or MRI (24,25).
In our study, the estimated concordance probability for TLG and survival time was higher than the estimated concordance probability for SUVmax (0.69 vs. 0.59), and TLG similarly performed better for the DM outcome. In addition, in OS models adjusted for T stage, TLG yielded a higher estimated concordance probability than SUV. Although the differences did not reach significance, the notion that TLG appears to be a better prognostic marker than SUV alone is also supported by survival curves, which show stronger separation of patient groups when stratified by TLG quartile than by SUV quartile (Figs. 1 and 2).
We found that an MTV greater than 19.7 cm3 places patients at high risk of death. Some other studies suggested MTV as a prognostic parameter. Interestingly, the median MTV varies from 9.7 cm3 (this study) to 11.2 cm3 (the study by La et al. (26)), 23.5 cm3 (the study by Seol et al. (27)), and 39 cm3 (the study by Chung et al. (9)). In a study of 85 patients with pharyngeal squamous cell carcinoma (53% oropharynx, 26% nasopharynx), an MTV increase of 17.4 cm3 (the difference between the 75th and 25th centile) was prognostic for recurrence (composite of locoregional and distant disease) and death (26). In another study of 59 patients (64% larynx, 22% oropharynx, and 14% hypopharynx), an MTV of greater than 9.3 cm3 was associated with increased risk of recurrence and death (composite of progression free and OS) (27). Finally, in a study of 82 patients (77% nasopharynx, 16% oropharynx), patients with greater than median MTV had a worse disease-free survival (9). There are 2 possible explanations for the wide variation in median MTV. First, there appears to be a general trend toward lower MTV with increasing proportion of patients with OPSCC. For example, the study reporting a median MTV of 39 cm3 (9) included a large proportion of patients with nasopharynx cancers, which may be larger in size at detection than OPSCC by virtue of their location. Second, differences may also occur because of differences in threshold methods used for delineating MTV. We selected a threshold of 42% for volume definition, based on prior phantom studies (14), whereas other investigators used 50% of maximum intensity (26) or a predefined absolute SUV number (28). Regardless of the chosen threshold, however, all studies showed MTV as an indicator of poor outcome.
Advanced cervical nodal stage (29) and level of neck node involvement (30,31) are recognized risk factors for the development of DM. In our study, using PET/CT-based staging, we confirmed these earlier data from surgical series. Nearly 90% of our cohort demonstrated nodal involvement by PET, concurring with historic studies showing nodal metastases in neck dissection specimens in up to 84% of patients with OPSCC, mostly in levels 2–4 (30). We found that the hazard of DM and death increased significantly with higher N stage and more than doubled when 18F-FDG–positive nodes were seen beyond neck level 2, confirming advanced level of nodal involvement as an adverse prognostic factor (30–33).
Our study has some limitations. Although histopathology was available for all primary tumors, we did not have histologic confirmation for all lymph nodes but surmised that all 18F-FDG–positive nodes in typical distribution for OPSCC were indeed metastatic. We excluded a substantial proportion of patients whose pretreatment PET/CT was performed elsewhere because of the potential wide variability in scan techniques and quality. However, all patients who underwent PET/CT for staging and subsequent chemoradiotherapy at our institution since 2002 were included; there was no selection bias. Patients were imaged on several state-of-the-art PET/CT systems, which show a less than 1% error in SUV in large, homogeneous 18F-FDG phantoms. We also used comparable reconstruction parameters (subsets, number of iterations, and filters) for all scanners. We therefore believe that fluctuations in SUV derived from different scanners are well within the statistical error of SUV calculated from repeated measurements on the same scanner. The low rate of LTF limited our evaluation; however, we do not believe that LTF is an important driving force of survival, because most patients appear to die from DM. Additionally, because of the limited number of deaths observed, we were unable to perform risk stratification for each T stage separately. In OS models adjusted for T stage, TLG was the PET parameter that provided the best discrimination. However, when stratifying by quartiles of risk based on the model, the second and third quartiles did not differ significantly with regard to survival (Fig. 4). Therefore, whereas the model successfully identified a group of patients with a high risk of death and a group with low risk, it showed less discriminatory power among patients with intermediate risk, possibly related to sample size. A small number of patients in our study had a short follow-up period; however, because we used survival methods to account for follow-up time and the largest part of the cohort (72%) was followed beyond the 2-y high-risk window, these should not affect our results. Human papilloma virus (HPV) infection status may influence prognosis in OPSCC (34). Because HPV status was not routinely assessed in our institution during the study period, this factor could not be entered in the multivariate analysis. Instead, we applied smoking status as a surrogate marker because it appears inversely related to HPV tumor status (34). Of note, smoking status was not a significant parameter in multivariate analysis. Quantitative PET measurements depend on technical parameters of data acquisition and processing, including the segmentation algorithm and threshold chosen for MTV and TLG. Our choice of a 42% threshold was based on prior phantom and modeling studies (14,35). Although this threshold may not be optimal for all lesion sizes and target-to-background ratios, we believe that our results are valid: applying a nonoptimum threshold for a group of lesions with a given size range may result in uncertainty of the molecular target volume but would not be expected to cause a systematic reshuffling of data between the 4 groups (based on the lesion size) defined in the study. Finding an optimum PET threshold and method for data segmentation is the subject of ongoing research. This uncertainty does not undermine the concept that MTV has prognostic value. However, although we found a worse outcome for patients with a primary MTV greater than 19.7 cm3, this specific number and the chosen cut points for TLG require validation in future studies and may vary between institutions depending on the local PET protocol. Nevertheless, the general association of high MTV and TLG with poor outcome would still hold true. Finally, future studies will have to compare the prognostic value of MTV and TLG with that of 3-dimensional tumor volumetric measurements from CT or MRI. Although these data are currently not available, we expect that MTV and TLG will retain their prognostic significance, because they are not simple measurements of tumor size (albeit in 3 dimensions) but instead are based on glucose metabolism, an important hallmark of the malignant phenotype.
CONCLUSION
Metabolically active tumor volume, captured by PET indices of MTV or TLG, is an important prognostic factor in OPSCC, provides incremental prognostic information beyond clinical T stage, and should be considered for risk stratification in these patients.
DISCLOSURE STATEMENT
The costs of publication of this article were defrayed in part by the payment of page charges. Therefore, and solely to indicate this fact, this article is hereby marked “advertisement” in accordance with 18 USC section 1734.
Acknowledgments
No potential conflict of interest relevant to this article was reported.
Footnotes
Published online Aug. 14, 2012.
- © 2012 by the Society of Nuclear Medicine and Molecular Imaging, Inc.
REFERENCES
- Received for publication November 30, 2011.
- Accepted for publication May 2, 2012.


Jump to section
Related Articles
Cited By...
- Texture Feature Comparison Between Step-and-Shoot and Continuous-Bed-Motion 18F-FDG PET
- Role of 18F-FDG PET/CT in Posttreatment Evaluation of Anal Carcinoma
- Effects of Intratumoral Inflammatory Process on 18F-FDG Uptake: Pathologic and Comparative Study with 18F-Fluoro-{alpha}-Methyltyrosine PET/CT in Oral Squamous Cell Carcinoma
- Prognostic Value of Metabolic Tumor Volume and Total Lesion Glycolysis in Head and Neck Cancer: A Systematic Review and Meta-Analysis
- Prognosis Related to Metastatic Burden Measured by 18F-Fluorocholine PET/CT in Castration-Resistant Prostate Cancer
- Textural Features of Pretreatment 18F-FDG PET/CT Images: Prognostic Significance in Patients with Advanced T-Stage Oropharyngeal Squamous Cell Carcinoma
- Variability of Total Lesion Glycolysis by 18F-FDG-Positive Tissue Thresholding in Lung Cancer