


Abstract
Previous studies have shown that total lesion glycolysis (TLG) may serve as a prognostic indicator in oropharyngeal squamous cell carcinoma (OPSCC). We sought to investigate whether the textural features of pretreatment 18F-FDG PET/CT images can provide any additional prognostic information over TLG and clinical staging in patients with advanced T-stage OPSCC. Methods: We retrospectively analyzed the pretreatment 18F-FDG PET/CT images of 70 patients with advanced T-stage OPSCC who had completed concurrent chemoradiotherapy, bioradiotherapy, or radiotherapy with curative intent. All of the patients had data on human papillomavirus (HPV) infection and were followed up for at least 24 mo or until death. A standardized uptake value (SUV) of 2.5 was taken as a cutoff for tumor boundary. The textural features of pretreatment 18F-FDG PET/CT images were extracted from histogram analysis (SUV variance and SUV entropy), normalized gray-level cooccurrence matrix (uniformity, entropy, dissimilarity, contrast, homogeneity, inverse different moment, and correlation), and neighborhood gray-tone difference matrix (coarseness, contrast, busyness, complexity, and strength). Receiver-operating-characteristic curves were used to identify the optimal cutoff values for the textural features and TLG. Results: Thirteen patients were HPV-positive. Multivariate Cox regression analysis showed that age, tumor TLG, and uniformity were independently associated with progression-free survival (PFS) and disease-specific survival (DSS). TLG, uniformity, and HPV positivity were significantly associated with overall survival (OS). A prognostic scoring system based on TLG and uniformity was derived. Patients who presented with TLG > 121.9 g and uniformity ≤ 0.138 experienced significantly worse PFS, DSS, and OS rates than those without (P < 0.001, < 0.001, and 0.002, respectively). Patients with TLG > 121.9 g or uniformity ≤ 0.138 were further divided according to age, and different PFS and DSS were observed. Conclusion: Uniformity extracted from the normalized gray-level cooccurrence matrix represents an independent prognostic predictor in patients with advanced T-stage OPSCC. A scoring system was developed and may serve as a risk-stratification strategy for guiding therapy.
Oropharyngeal squamous cell carcinoma (OPSCC) is one of the most common forms of head and neck cancer worldwide. Human papillomavirus (HPV) and smoking are among the main risk factors for OPSCC (1,2), although HPV positivity portends a more favorable prognosis (3,4). In contrast, advanced T-stage tumors have been associated with worse survival rates (3,5). Unfortunately, the classification schemes currently in use for OPSCC, which are mainly based on the tumor extent, lymph node invasion, and staging, provide inadequate risk stratification (6).
Growing evidence suggests that total lesion glycolysis (TLG) may be a useful 18F-FDG PET index for predicting prognosis in OPSCC patients (7–9). However, most tumors, even those of the same histologic type and grade, are characterized by considerable biologic heterogeneity (10,11). Although their detailed biologic correlates remain unknown, textural features of pretreatment 18F-FDG PET/CT images have been used for delineating tumors (12), stratifying risk, and assessing tumor response to therapy in different malignancies, including head and neck cancer (13), esophageal cancer (13,14), and non–small cell lung cancer (15). However, the textural analysis of PET images may be limited by a relatively poor resolution in the presence of small tumor volumes (16). Moreover, various aspects of textural analysis (e.g., image acquisition mode, reconstruction parameters, type of texture matrix) need further investigation or research before validation and standardization (17).
In the present study, we sought to investigate whether the textural features of pretreatment 18F FDG PET/CT images can provide any additional prognostic information over TLG, HPV infection, and clinical staging in patients with advanced T-stage OPSCC. We hypothesized that the degree of metabolic heterogeneity within a primary OPSCC tumor could be quantified by 18F-FDG PET textural analyses and investigated its potential association with patient outcomes.
MATERIALS AND METHODS
Patients
In this retrospective study, we enrolled OPSCC patients with advanced T stage (T3 or T4) who had completed platinum-based concurrent chemoradiotherapy, cetuximab-based concurrent bioradiotherapy, or radiotherapy alone with curative intent. All of the patients were followed up for at least 24 mo or until death. The HPV status was available in all participants. Patients were excluded if they had metastatic disease at presentation (M1 stage), were previously treated for OPSCC at other institutions, had a positive history of malignancies, or achieved a complete remission for a previous tumor from less than 3 y. The study protocol was approved by the Hospital Ethics Committee, and a patient’s waiver of informed consent was obtained. The study participants were staged according to the American Joint Committee on Cancer (AJCC) staging system published in 2002 (sixth edition) (18). The interpretation of the posttherapy status was retrospectively performed by an expert radiologist masked to clinical data. The posttherapy status was analyzed using the Response Evaluation Criteria In Solid Tumors (RECIST) 1.1 (19) and classified as follows: complete response (CR), partial response (PR), stable disease, or progressive disease (PD). Patients who achieved either a CR or a PR were considered as responders. We retrospectively reviewed the medical records to collect the clinical characteristics of the study participants, their disease status, and the time of locoregional recurrence, distant recurrence, or death. Progression-free survival (PFS), disease-specific survival (DSS), and overall survival (OS) served as the main outcome measures. Survival intervals were defined as the time from diagnosis to the time of death related to OPSCC (DSS) or to time of death by any cause (OS). PFS was defined as the time to locoregional or systemic recurrence, cancer death, or unequivocal radiologic evidence of progression in patients who showed residual disease after primary therapy. The biopsy specimens of the primary tumors of patients who met the inclusion criteria were retrospectively tested for HPV infection as previously described (20–22).
18F-FDG PET/CT Acquisition
All OPSCC patients underwent pretreatment staging by 18F-FDG PET/CT. 18F-FDG PET/CT was performed after a median of 11 d (mean, 14.5 d; range, 1–146 d; 25th percentile, 6 d; 75th percentile, 16 d) from the pathologic diagnosis. Before the examination, the subjects were asked to fast for at least 6 h. Patients were injected intravenously with 370–555 MBq of 18F-FDG, depending on body weight, and images were acquired 50 min after the intravenous administration of the tracer. Whole-body PET emission scans were obtained from the base of the skull to the mid thigh without the patient having to change positions. 18F-FDG PET/CT was performed using a Discovery ST 16 scanner (GE Healthcare) in 61 patients, whereas the remaining 9 subjects were imaged on a Biograph mCT scanner (Siemens Medical Solutions). Low-dose CT images were used for attenuation correction of the PET data. The CT doses for a man weighting 75 kg were 11.02 and 8.50 mSv for the Discovery ST16 and the Biograph mCT scanners, respectively. PET images were reconstructed using CT-based attenuation correction by an ordered-subset expectation maximization iterative reconstruction algorithm (4 iterations and 10 subsets for the Discovery ST16; 2 iterations and 21 subsets for the Biograph mCT). The axial spatial resolutions of PET at the center of the gantry were 4.80 and 2.16 mm for the Discovery ST16 and Biograph mCT scanners, respectively, using these reconstruction parameters.
TLG Analysis
The metabolic tumor volume (MTV) was measured from the attenuation-corrected 18F-FDG PET/CT fusion images. The PMOD 3.3 software package (PMOD Technologies Ltd.) was used for tumor segmentation, and the volumes of interest (VOI) were recorded. The boundaries were drawn to include the primary tumor within the oropharynx on the axial 18F-FDG PET/CT images. The lesions were automatically contoured at a threshold standardized uptake value (SUV) of 2.5 (7,23), and the voxels presenting an SUV intensity > 2.5 within the contouring margin were incorporated to define the MTV. The TLG was calculated according to the following formula: TLG = mean SUV × MTV (24). The TLG values of the primary tumors (tumor TLG) were measured in all participants.
Textural Analysis
Distinct sets of textural features can be extracted from PET images using different matrices. In the present study, we used an SUV histogram analysis and normalized gray-level cooccurrence matrix (NGLCM) for the assessment of first- and second-order textural features, respectively. Because a neighborhood gray-tone difference matrix (NGTDM) has been previously used for tumor delineation in patients with head and neck cancer (12), this method was applied for the higher-order textural features. The computation of tumor textural features was a 2-step process. First, the voxel intensities were resampled within the segmented tumors to yield a limited range of values for reducing noise and normalizing images (14). The intensity of 18F-FDG uptake in the primary tumor was resampled to 4, 16, 32, and 64 different values. In the second step, the textural features were analyzed using histogram analysis, NGLCM, and NGTDM. The SUV histogram analysis was used to calculate SUV variance and SUV entropy. The 3-dimensional NGLCM was applied and set to be orientation-invariant for the calculation of uniformity, entropy, dissimilarity, contrast, homogeneity, inverse different moment, and correlation (25–27). The textural parameters of coarseness, contrast, busyness, complexity, and strength were calculated from the NGTDM (28). The computations of the textural features were performed using a homemade software package (Chang-Gung Image Texture Analysis toolbox) implemented under MATLAB 2012a (The MathWorks Inc.). Detailed information on the methods and techniques used for textural analysis is provided in the supplemental data (supplemental materials are available at http://jnm.snmjournals.org).
Statistical Analysis
Receiver-operating-characteristic (ROC) curves were used to identify the PET textural features of potential prognostic value for oropharyngeal cancer–related mortality. The parameters with an area under the curve significantly different from 0.5 were selected for further analyses. The optimal cutoff values were identified by determining the values where the sum of sensitivity and specificity was maximum. Differences in textural parameters, maximum SUV (SUVmax), and TLG were compared using the Student t test according to the general characteristics of the study participants. No correction for multiple comparisons was used in this study. Kaplan–Meier survival estimates were constructed and compared using the log-rank test. Univariate and multivariate Cox proportional hazards models were used to identify the independent predictors of PFS, DSS, and OS. Adjusted hazard ratios (HRs) and the corresponding 95% confidence intervals (CIs) were used to express the results of multivariate analysis. The Spearman correlation coefficient (ρ) was used to evaluate the associations between the textural characteristics, SUVmax, MTV, TLG, and the general characteristics of the study participants. All statistical analyses were performed using PASW Statistics 18 (SPSS Inc.) for Windows (Microsoft). Two-tailed P values of less than 0.05 were considered statistically significant.
RESULTS
Patient Characteristics
The general characteristics of the study participants are shown in Table 1. Between June 2006 and August 2010, 70 advanced T-stage OPSCC patients (4 women and 66 men; median age at diagnosis, 52 y) were included in the study. The median follow-up time for the entire study cohort was 27.0 mo (range, 5.23–74.10 mo). Most patients (n = 57, 81.4%) had a history of tobacco use, and most (n = 43, 61.4%) were in stage IVa according to the AJCC staging system. Sixty-four patients (91.4%) received concurrent chemoradiotherapy, 4 (5.7%) received bioradiotherapy, and the remaining 2 (2.9%) did not tolerate chemotherapy and received radiotherapy alone with curative intent. The median radiation dose was 72 Gy (range, 66–80 Gy). Thirteen patients (18.6%) tested positive for HPV infection. All of them were men. Of the 13 patients, 8 (11.4%) and 2 (2.9%) were HPV-16 and -18, respectively, with the remaining 3 patients each diagnosed with HPV-26, -35, and -58 infections. Among the HPV-positive patients, 9 (69.2%) were smokers and 4 (30.8%) had disease recurrence.
General Patient Characteristics and Univariate Analysis of DSS
Patient Outcomes
The RECIST response was based on contrast-enhanced CT data in 27 patients, whereas 42 were assessed on MR imaging. Forty-four patients (62.9%) were found to have CR after primary therapy. Eight (11.4%), 4 (5.7%), and 13 (18.6%) patients had PR, stable disease, and PD, respectively. One patient died from tumor bleeding after therapy but before scheduled imaging studies and was classified as not evaluable. Of the patients who did not obtain CR (n = 26), 5 achieved a complete remission after salvage surgery. At the end of the study, 44 patients (62.9%) died (died of cancer, n = 34; died of second primary cancers, n = 7; died of pneumonia, n = 2; died of cerebral vascular disease, n = 1) (Fig. 1). Thirteen patients (18.6%) showed disease recurrence (local tumor recurrence, n = 8; local tumor and nodal recurrence, n = 2; isolated distant metastases, n = 2; local tumor and distant recurrence, n = 1). Nine (12.9%) patients experienced metachronous second primary cancers (head and neck cancers, n = 6; esophageal cancer, n = 3).

Flow chart of patients with advanced T-stage OPSCC throughout study. One patient who achieved complete remission without disease recurrence developed infection of oropharyngeal wound and eventually died of massive bleeding. This patient was classified as died of disease. DOD = died of disease; second_ca = died of second primary cancer; NED = no evidence of disease; others = died from other events (1 patient died of cerebrovascular disease and 2 of pneumonia).
ROC Curve Analysis of 18F-FDG PET Textural Features
Nine textural features were found to be significantly associated with clinical outcomes according to ROC curve analysis. Specifically, the following parameters were significantly associated with death events from OPSCC cancer: SUV entropy (4, 32, and 64 bins) from histogram analysis, uniformity (4 and 64 bins), and entropy (32 and 64 bins) from NGLCM and coarseness (32 and 64 bins) from NGTDM. The optimal cutoff values and the areas under curve are shown in Supplemental Table 1. Uniformity and coarseness had a negative correlation with death from cancer, whereas the remaining textural features showed a positive association.
Correlation Between Clinicopathologic Characteristics, Textural Features, and Other PET Parameters
Some textural features are tumor volume–dependent. Histogram analysis showed a significant association of MTV with SUVmax (ρ = 0.441, P < 0.001), SUV variance (ρ = 0.438, P < 0.001), and SUV entropy of 32 and 64 bins (ρ = 0.317, P = 0.007; and ρ = 0.484, P < 0.001, respectively). However, all of the other NGLCM and NGTDM parameters were significantly correlated with MTV, the only exception being uniformity of 4, 16, and 32 bins and entropy of 16 bins. Uniformity (64 bins) was lower (0.0020 ± 0.001 vs. 0.0014 ± 0.0004, P = 0.011) and entropy (64 bins) was higher (6.87 ± 0.25 vs. 6.68 ± 0.41, P = 0.011) in HPV-positive patients. Other textural parameters did not differ significantly. We found no significant differences between the 2 scanners in terms of SUVmax, SUV variance, TLG, MTV, and the first-order textural features, for example, SUV entropy of 4, 16, 32, and 64 bins. With respect to second-order and higher-order features, only uniformity of 4, 16, 32, and 64 bins; entropy of 32 and 64 bins; and busyness of 4, 16, 32, and 64 bins were not significantly different between the 2 scanners. Of the 9 textural parameters associated with OPSCC related–death, coarseness (32 and 64 bins) derived from NGTDM was significantly lower in the Biograph mCT scanner (0.007 ± 0.005 vs. 0.019 ± 0.013 and 0.007 ± 0.005 vs. 0.017 ± 0.011, both P < 0.001, for 32 and 64 bins, respectively).
Response Prediction
Of the 9 textural features associated with OPSCC cancer death, RECIST responders (CR and PR) showed significantly higher uniformity (4 bins) (0.15 ± 0.03 vs. 0.14 ± 0.02, P = 0.022) and lower SUV entropy (4 bins) (1.10 ± 0.10 vs. 1.14 ± 0.05, P = 0.027) than nonresponders (stable disease or PD). Other textural features did not differ significantly nor did SUVmax, MTV, or TLG. All of the 13 HPV-positive patients were RECIST responders to primary therapy (12 CR and 1 PR). Compared with HPV-negative patients, those who were HPV-positive had a marginally significant higher likelihood of response to therapy (odds ratio = 11.96, P = 0.091). The areas under the ROC curves for the ability to predict the RECIST response were 0.662 for SUV entropy (4 bins) (95% CI = 0.528–0.796, P = 0.046) and 0.663 for uniformity (4 bins) (95% CI = 0.525–0.800, P = 0.045).
Survival Prediction
Kaplan–Meier estimates showed no significant associations between the clinicopathologic characteristics of the study participants (HPV infections, age, smoking, advanced T stage, N stage, and AJCC stage) and DSS (Supplemental Fig. 1). We then analyzed the association of 18F-FDG PET textural features with DSS. The results indicated that SUV entropy (4, 32, and 64 bins), uniformity (4 bins), entropy (64 bins), and coarseness (32 and 64 bins) were significantly associated with DSS (Supplemental Fig. 2).
Tumor TLG, SUV entropy (4, 32, and 64 bins), uniformity (4 bins), entropy (64 bins), and coarseness (32 and 64 bins) were found to be significant predictors of DSS in univariate Cox regression analysis (Table 1). Multivariate Cox regression analysis was then used to identify the independent predictors of DSS, OS, and PFS after adjustment for potential confounders. Because of the high degree of collinearity among the various PET textural features, each of them was entered separately in the multivariate Cox regression model. The other covariates included age (≥52 vs. <52 y), sex, tobacco usage, T stage (T3 vs. T4), N stage (N0-N2a vs. N2b-N3), AJCC stage (stage III vs. IVa vs. IVb), SUVmax (above and below 12.87), tumor TLG (above and below 122.9 g), and HPV status (positive vs. negative). Age of 52 y or more, tumor TLG, and uniformity (4 bins) were significant predictors of PFS and DSS (Table 2). However, only HPV infections, tumor TLG, and uniformity (4 bins) were independently related to OS. The associations of HPV infections with DSS and PFS were of borderline significance (Table 2). Kaplan–Meier estimates of PFS, DSS, and OS according to tumor TLG and uniformity (bins) are depicted in Figure 2.
Multivariate Analysis of PFS, DSS, and OS Rates
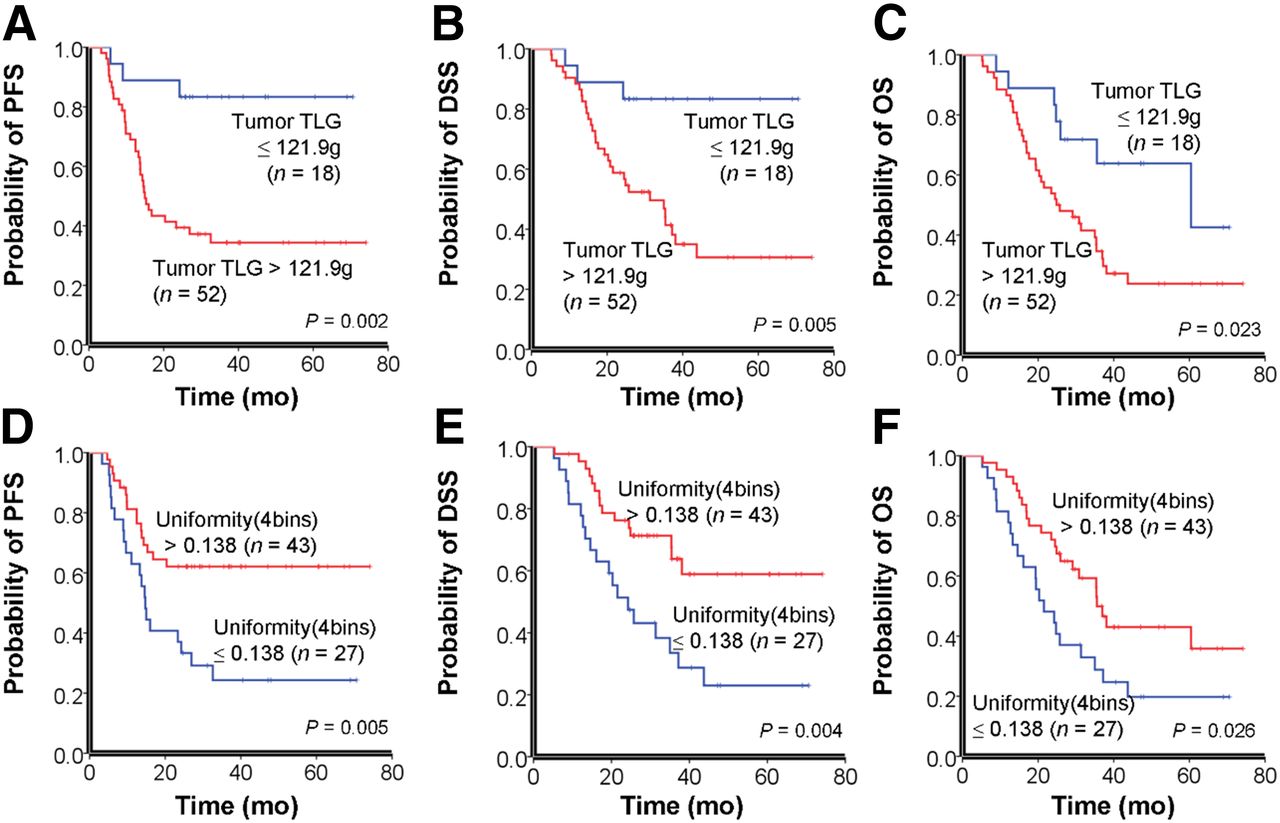
Kaplan–Meier estimates of PFS, DSS, and OS rates according to tumor TLG (A–C) and uniformity (D–F). P values according to log-rank test are reported in insets.
The uniformity of 4 bins was not associated with tumor TLG (ρ = 0.161, P = 0.184) or age (ρ = −0.118, P = 0.331). Patients with a greater uniformity (>0.138) showed a higher likelihood of responding to the primary treatment (odds ratio = 4.125, P = 0.016). In contrast, patients with lower uniformity values had a greater likelihood of disease failure (residual or recurrent disease) after the primary treatment (odds ratio = 3.00, P = 0.035). Patients with a tumor TLG > 121.9 g were at an increased risk of developing disease failure (odds ratio = 6.61, P = 0.003), but larger TLG had no significant effect on the response to the primary treatment (odds ratio = 3.33, P = 0.137).
Risk Stratification Model for DSS
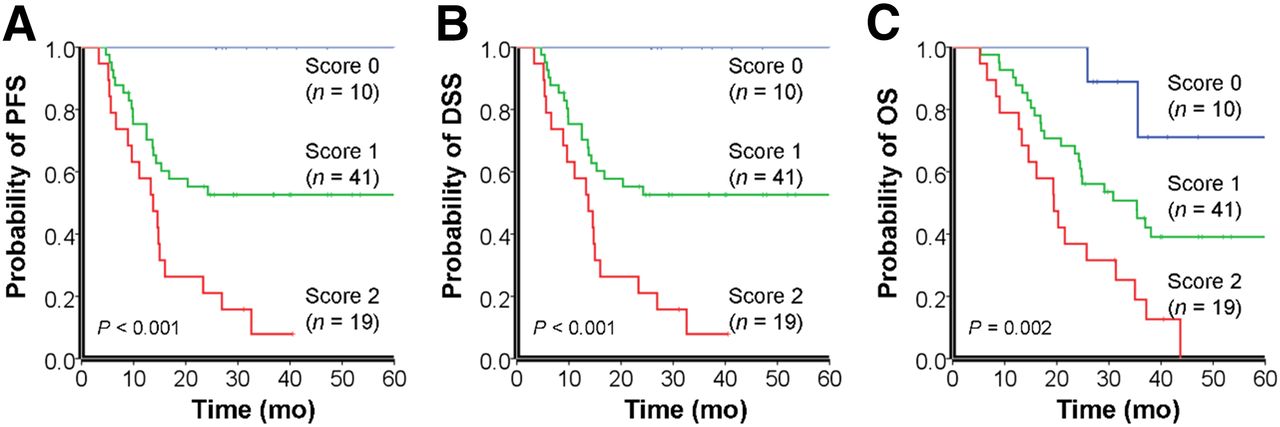
A prognostic scoring system was derived from the independent predictors of survival and applied to the entire cohort. Because TLG and tumor uniformity were the only independent predictors of PFS, DSS, and OS, patients were classified according to the presence of a uniformity ≤ 0.138 and a tumor TLG > 122.9 g. Equal weight was given to the 2 factors, resulting in a 3-point risk scale (score 0, no risk factor; score 1, 1 risk factor; and score 2, 2 risk factors). The 3 risk groups were significantly different in terms of DSS, PFS, and OS (Fig. 3). Patients with larger and less uniform tumors (score 2) showed significantly worse PFS, DSS, and OS rates than those with a score of 0 or 1. Because multivariate Cox regression identified age as an independent predictor of PFS and DSS, patients with a score of 1 were divided according to the age of 52 y. The subgroup of patients with an age ≥ 52 y was classified as 1.1, whereas those with an age < 52 y were termed 1.2. Patients in the 1.2 group had worse PFS and DSS rates than 1.1 patients, but no significant differences were seen in terms of OS (Fig. 4). Age was not associated with PFS, DSS, and OS in patients with a score of 0 or 2.

Risk stratification model for 5-y survival rates based on tumor TLG and uniformity. There were significant differences between prognostic scoring groups in terms of PFS (A), DSS (B), and OS (C). P values according to log-rank test are reported in insets.
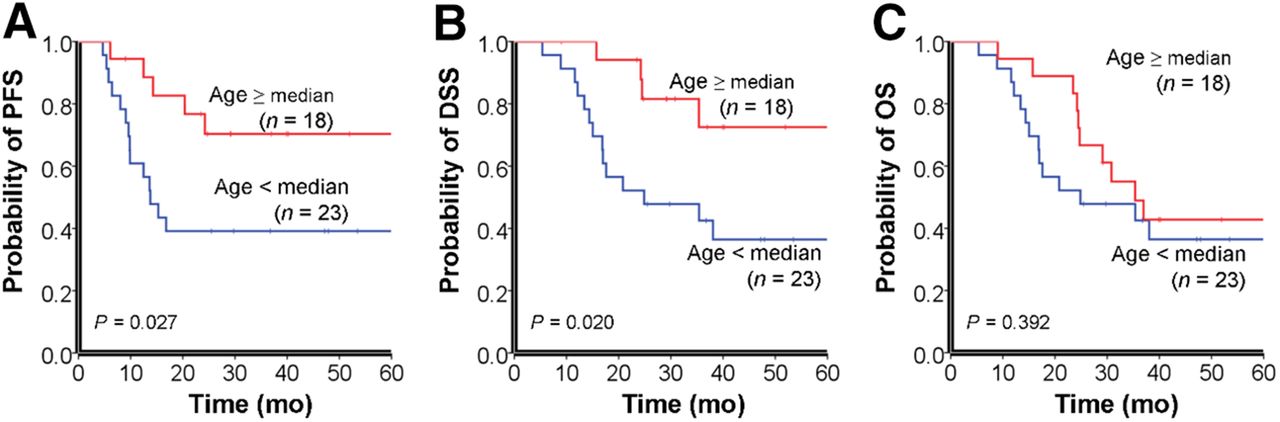
Survival rates of patients with a score of 1 after stratification for age. Stratification system was significantly associated with PFS (A) and DSS (B) but not with OS (C). P values according to log-rank test are reported in insets.
Of a total of 28 subjects with a score of 0 or 1.1, 4 died of OPSCC. Of the 42 patients with a score of 2 or 1.2, 30 died of OPSCC. Therefore, the risk of dying from OPSCC was markedly higher for patients with a score of 2 or 1.2 (odds ratio = 15.00, P < 0.001). In contrast, we observed an increased risk of dying from secondary primary cancers in patients with a score of 0 or 1.1; accordingly, 6 of the 28 patients died from second primary cancers, compared with only 1 patient among those who scored 2 or 1.2 (odds ratio = 11.18, P = 0.030).
DISCUSSION
There has recently been heightened interest within the scientific community toward the development of new imaging biomarkers through textural analysis of CT (29–32) and PET images (14,15). Our results indicate that uniformity extracted from the NGLCM and tumor TLG may improve risk stratification in patients with advanced T-stage OPSCC. In particular, uniformity was significantly associated with the survival outcomes and was able to differentiate responders from nonresponders. Uniformity, also called angular second moment, is a measure of image homogeneity. Low uniformity values are typically found in heterogeneous images without a dominant intensity. Although a decreased image uniformity may reflect tumor cellularity, proliferation, hypoxia, angiogenesis, and necrosis (14), the exact biologic correlates of uniformity remain unclear.
Previous studies have shown a markedly higher survival in OPSCC patients with HPV infections (1–5), which may be related to a higher sensitivity to radiotherapy (33). However, we observed only a marginally significant effect of HPV infections on CR and PR. It has been suggested that the protective effect of HPV may be disguised by the negative impact of the environmental exposure to tobacco (3,34). Accordingly, we observed a high prevalence (62.9%) of tobacco use in our HPV-positive patients, which could partially explain the nonsignificant findings. In addition, there are significant ethnic differences in the prevalence of HPV infection, with lower infection rates being reported in Chinese OPSCC patients (35,36).
We were able to replicate the previously reported prognostic value of tumor TLG. Interestingly, we also confirmed the reported association (5) of age with both PFS and DSS. Previous research (37) has shown that p16INK4A, a biomarker for senescence (38), is associated with a favorable outcome in OPSCC patients. Therefore, it can be hypothesized that the age-related increase in p16INK4A levels might explain the better prognosis observed in older patients. Further research is needed to clarify exactly how aging, p16INK4A, and the clinical outcomes are interrelated in OPSCC patients.
To allow a personalized clinical management based on textural analysis, we have developed a new scoring system for advanced T-stage OPSCC patients. Subjects with a score of 0 or 1.1 showed better outcomes and may undergo a regular follow-up aimed at an early detection of secondary primary cancers. In contrast, patients with a score of 1.2 or 2 had a worse prognosis and should receive aggressive multimodality treatment or salvage therapy to increase the response rates.
Our study has several limitations. Because of the retrospective nature and the inclusion of advanced T-stage OPSCC patients who had completed primary therapy, selection biases cannot be totally excluded. Moreover, 2 different PET/CT scanners were used, and significant differences were noted with regard to several parameters (including the coarseness derived from NGTDM). Coarseness has been likened to granularity within an image—that is, coarseness is higher in images of larger granularity and lower in those with a smaller granularity. The Biograph mCT scanner had a better resolution, which was associated with a finer granularity in PET images (resulting in smaller coarseness values). In any case, these results should be interpreted with caution and need to be validated in larger samples. Notably, we also found that the prognostic impact of the textural features was influenced by the resample values (bins). Therefore, the prognostic performances of textural features may be dependent on the noise, image resolution, and processing parameters used in PET imaging. In light of these caveats, further validation of our prognostic model is required.
CONCLUSION
The results of the present study indicate that uniformity extracted from the normalized gray-level cooccurrence matrix represents an independent prognostic predictor in patients with advanced T-stage OPSCC. This textural parameter derived from pretreatment PET can be useful for determining risk stratification and may serve as an important factor for guiding therapy.
DISCLOSURE
The costs of publication of this article were defrayed in part by the payment of page charges. Therefore, and solely to indicate this fact, this article is hereby marked “advertisement” in accordance with 18 USC section 1734. No potential conflict of interest relevant to this article was reported.
Footnotes
↵* Contributed equally to this work.
Published online Sep. 16, 2013.
- © 2013 by the Society of Nuclear Medicine and Molecular Imaging, Inc.
REFERENCES
- Received for publication January 4, 2013.
- Accepted for publication May 2, 2013.


Jump to section
Related Articles
Cited By...
- Association of Graph-based Spatial Features with Overall Survival Status of Glioblastoma Patients
- Metabolic heterogeneity on baseline 18FDG-PET/CT scan is a predictor of outcome in primary mediastinal B-cell lymphoma
- Texture Feature Ratios from Relative CBV Maps of Perfusion MRI Are Associated with Patient Survival in Glioblastoma
- Impact of Image Reconstruction Settings on Texture Features in 18F-FDG PET
- PET/CT Imaging and Human Papilloma Virus-Positive Oropharyngeal Squamous Cell Cancer: Evolving Clinical Imaging Paradigm