


Abstract
The purpose of this study was to compare in a large series of peripheral T cell lymphoma, as a model of diffuse disease, the prognostic value of baseline total metabolic tumor volume (TMTV) measured on 18F-FDG PET/CT with adaptive thresholding methods with TMTV measured with a fixed 41% SUVmax threshold method. Methods: One hundred six patients with peripheral T cell lymphoma, staged with PET/CT, were enrolled from 5 Lymphoma Study Association centers. In this series, TMTV computed with the 41% SUVmax threshold is a strong predictor of outcome. On a dedicated workstation, we measured the TMTV with 4 adaptive thresholding methods based on characteristic image parameters: Daisne (Da) modified, based on signal-to-background ratio; Nestle (Ns), based on tumor and background intensities; Fit, including a 3-dimensional geometric model based on spatial resolution (Fit); and Black (Bl), based on mean SUVmax. The TMTV values obtained with each adaptive method were compared with those obtained with the 41% SUVmax method. Their respective prognostic impacts on outcome prediction were compared using receiver-operating-characteristic (ROC) curve analysis and Kaplan–Meier survival curves. Results: The median value of TMTV41%, TMTVDa, TMTVNs, TMTVFit, and TMTVBl were, respectively, 231 cm3 (range, 5–3,824), 175 cm3 (range, 8–3,510), 198 cm3 (range, 3–3,934), 175 cm3 (range, 8–3,512), and 333 cm3 (range, 3–5,113). The intraclass correlation coefficients were excellent, from 0.972 to 0.988, for TMTVDa, TMTVFit, and TMTVNs, and less good for TMTVBl (0.856). The mean differences obtained from the Bland–Altman plots were 48.5, 47.2, 19.5, and −253.3 cm3, respectively. Except for Black, there was no significant difference within the methods between the ROC curves (P > 0.4) for progression-free survival and overall survival. Survival curves with the ROC optimal cutoff for each method separated the same groups of low-risk (volume ≤ cutoff) from high-risk patients (volume > cutoff), with similar 2-y progression-free survival (range, 66%–72% vs. 26%–29%; hazard ratio, 3.7–4.1) and 2-y overall survival (79%–83% vs. 50%–53%; hazard ratio, 3.0–3.5). Conclusion: The prognostic value of TMTV remained quite similar whatever the methods, adaptive or 41% SUVmax, supporting its use as a strong prognosticator in lymphoma. However, for implementation of TMTV in clinical trials 1 single method easily applicable in a multicentric PET review must be selected and kept all along the trial.
PET/CT with 18F-FDG has been recognized as the best imaging tool for staging and response assessment in FDG-avid lymphoma. The last International Conference on Malignant Lymphoma recommendations (1) encourage investigating the quantitative analysis of 18F-FDG PET/CT at staging. In this regard, the measurement of the total metabolic tumor volume (TMTV), which gives an estimation of the total tumor burden, has gained special interest. Indeed, several series have shown that TMTV was predictive of outcome in different lymphoma subtypes: diffuse large B cell lymphoma (2,3), Hodgkin lymphoma (4), peripheral T cell lymphoma (PTCL) (5), and follicular lymphoma (6). In these studies, different methods of TMTV measurement were used; all were based on a fixed thresholding principle to determine the metabolic volume of local tumors. The threshold can be absolute: an SUV of 2.5 was generally chosen (2). It can be relative, using a percentage of the maximum uptake. A threshold of 41% of the SUVmax within the lesion, recommended by the European Association of Nuclear Medicine for solid tumors (7), has been used in patients with Hodgkin lymphoma (4), diffuse large B cell lymphoma (3), and PTCL (5), with a good interobserver reproducibility. However, because lymphomas are heterogeneous disease with several tumor sites with a wide range of volumes, SUVs, and tumor background ratios, the adaptive segmentation methods might be of interest for TMTV measurement and could be proposed as an alternative to fixed thresholding methods. The principle of these adaptive methods developed for radiotherapy planning of solid tumors is to adapt the threshold following a fitting model according to 1 or 2 characteristic image parameters, such as the SUV or the contrast. In a previous study, we have demonstrated in a retrospective group of PTCL patients that TMTV measured with the 41% SUVmax threshold method was a good predictor of outcome (5). The aim of the present study was to compare in the same series, taken as a model of diffuse lymphoma, different adaptive thresholding methods with this fixed 41% method and to evaluate whether these adaptive thresholding methods were better predictors of outcome than a fixed relative threshold.
MATERIALS AND METHODS
Patients
A group of consecutive patients with PTCL newly diagnosed during 2006–2014, from 5 Lymphoma Study Association centers (Creteil, Dijon, Marseille, Rouen, and Liege), were included in this study. All were part of a previous study already published on the prognostic value of baseline TMTV (5). Patients underwent baseline PET/CT, with central data available for review. The median follow-up of this population was 23 mo. The 2-y progression-free survival (PFS) and overall survival (OS) of the population were 49% and 67%, respectively. The patient characteristics were a median age of 58 y; 91% of advanced stage, half of them with an international prognostic index greater than 2 and 45% with a prognostic index for PTCL greater than 1; and 80% treated with cyclophosphamide, doxorubicin, vincristine, prednisone (CHOP)/CHOP-like therapy and 20% with cyclophosphamide, doxorubicin, vindesine, bleomycin. The study was conducted in accordance with the precepts of the Helsinki Declaration and received approval by the Ethical Committee with a waiver of informed consent because of the retrospective nature of the study (5).
PET Acquisition
All the centers adhered to guidelines of the European Association of Nuclear Medicine for patient preparation and PET/CT acquisition. All patients were instructed to fast for at least 6 h before the injection of 4–5 MBq per kilogram of 18F FDG, to ensure that serum glucose and endogenous serum insulin levels were low. Non–contrast-enhanced CT images were acquired before PET data acquisition. Whole-body PET was acquired sequentially using a dedicated PET/CT system. For the PET imaging, the emission data were acquired from the base of the skull to the proximal thigh with 3–3.5 min of acquisition per bed position. A Biograph Sensation 16 Hi-Rez (Siemens Medical Solution) or Gemini GXL or Gemini TOF (Philips) scanner was used by the 5 centers. All the devices used in this study followed a quality control program ensuring that the data were quantitatively correct (quarterly SUV verification). Four centers had obtained European Association of Nuclear Medicine Research Ltd. accreditation at the time of the study, and 1 was accredited according to the RTEP (Radiotherapy and PET) trial procedure (8). The similarity of performances of the different equipment was confirmed with the analysis of the recovery curves obtained from their NEMA phantoms in terms of volume and contrast.
TMTV Measurement
The baseline 18F-FDG PET/CT was processed with a Planet Onco workstation (version 2.0; DOSISoft) located at the Henri Becquerel Center, Rouen.
TMTV was computed using the following steps. First, the volumetric regions of interest were placed around each lesion, avoiding physiologic uptake (urinary elimination, heart). The reproducibility of the region-of-interest setting has been evaluated, as previously published (5). Then the tumor volume was delineated with 5 thresholding methods: 1 fixed, 41% SUVmax considered thereafter as the reference (9), and 4 adaptive based on mathematic algorithms—Daisne modified by Vauclin et al. (TMTVDa), which iteratively adapts the threshold according to the local signal-to-background ratio (10); Fit (TMTVFit), which fits the sphere image using a 3-dimensional geometric model based on the spatial resolution in the reconstructed images and on a tumor shape derived from activity thresholding (11,12); Nestle (TMTVNs) according to tumor and background intensities (13); and Black (TMTVBl) according to the SUVmean (14). The tumor SUVmax and the liver SUVmax were also reported.
Statistical Analysis
Quantitative variables were expressed as median and ranges. The comparison of TMTV between methods was analyzed with the Friedman nonparametric test. When a significant difference was detected, a Wilcoxon signed-rank test was performed, with Bonferroni adjustment for multiple testing. The correlation between TMTV values from the 41% SUVmax method and those from adaptive methods (Daisne modified, Fitting, Nestle, and Black) was tested using Spearman coefficients. Agreement between methods were represented on Bland–Altman plots and quantified with the intraclass correlation coefficient (ICC) based on Shrout–Fleiss formulae.
For each method, receiver-operating-characteristic (ROC) curves were obtained to define the optimal TMTV cutoff for survival prediction. The prognostic relevance of each method to predict PFS and OS was pairwise comparison of these ROC curves. Survival functions were calculated with Kaplan–Meier estimates for each method using their optimal TMTV cutoff. The comparison between categories was made using the log-rank test and Cox proportional hazards models. The agreement between the dichotomization of patients in low- and high-TMTV groups obtained with the 41% SUVmax method and each adaptive method was tested with the Cohen κ-coefficient. Survival functions were also calculated for each method using the threshold of 230 cm3 determined with the 41% SUVmax method for PFS and OS (5).
Because PET/CT was performed in several institution and adaptive methods were optimized on a Dosisoft workstation for the Rouen equipment (Biograph Sensation 16 Hi-Rez), we verified that the Spearman coefficients as well as the ICC based on Shrout–Fleiss formulae existing between methods were similar between the Rouen subset and the whole population. Statistical analyses used SAS 9.2 (SAS Institute) and Med Calc (MedCalc Software).
RESULTS
One hundred six patients with PTCL newly diagnosed and for whom PET/CT could be retrieved for analysis on Dosisoft software were included in the present study. Characteristics of this group were similar to the initial population.
TMTV Measurement
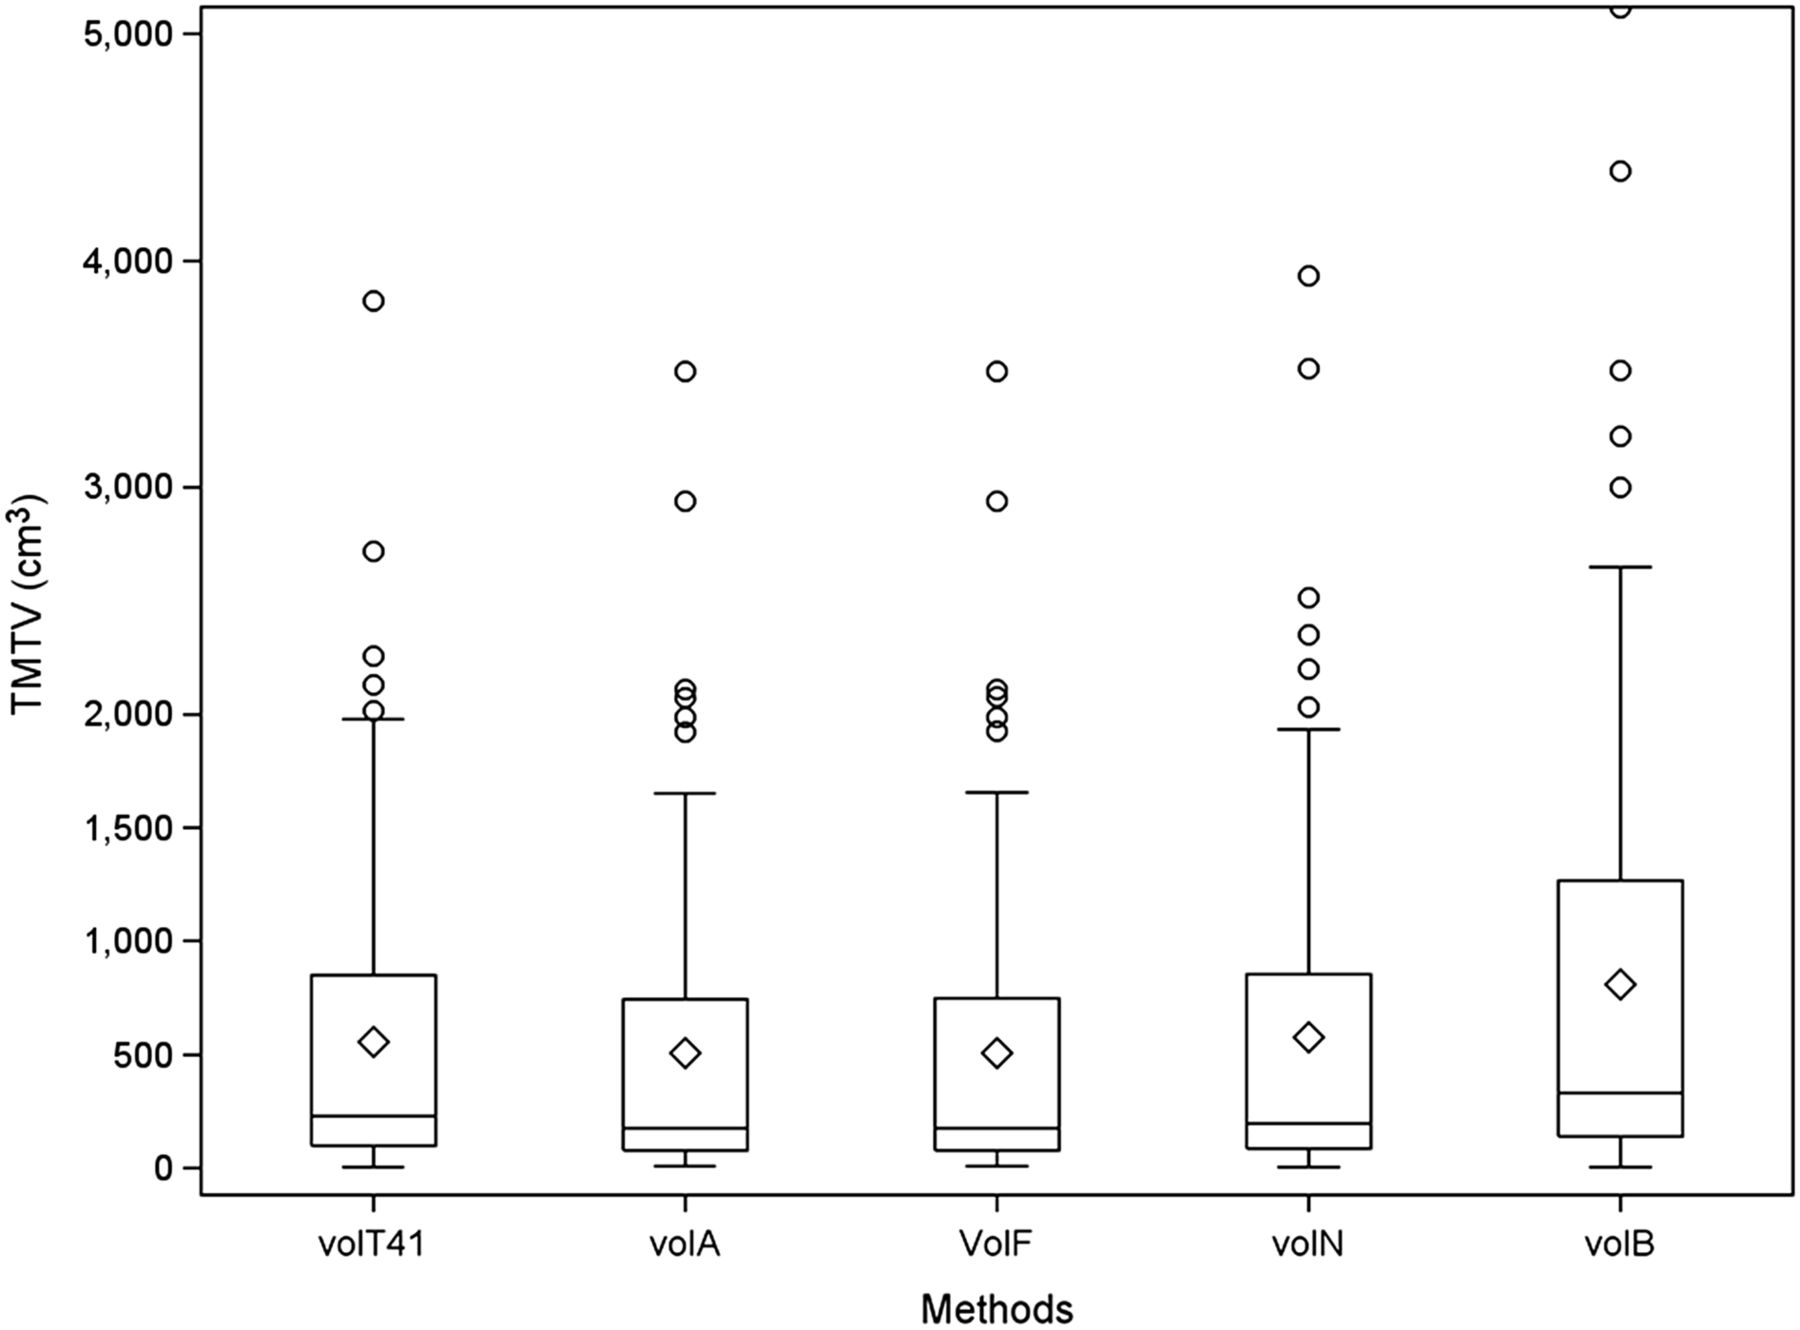
The median values of TMTV41%, TMTVDa, TMTVFit, TMTVNs, and TMTVBl were 231 cm3 (range, 5–3,824), 175 cm3 (range, 8–3,510), 175 cm3 (range, 8–3,512), 198 cm3 (range, 3–3,934), and 333 cm3 (range, 3–5,113), respectively (Fig. 1). We observed no significant difference between Nestle and 41% SUVmax methods (P = 0.7), but significant differences existed between the other adaptive methods and 41% SUVmax (P < 0.001): from 24% for Fit and Daisne to 44% for Black. The median tumor SUVmax was 14, with a wide range of values (3.4–39.0). The tumor SUVmax–to–liver SUVmax ratio, taken as an index of tumor-to-background ratio, ranged from 1 to 15. The reproducibility of volume-of-interest setting was excellent, with a Lin concordance correlation coefficient of ρ = 0.995 (95% confidence interval [CI], 0.992–0.997) (5).

TMTV distribution according to each methodology, with median and interquartile range (box), mean (diamond), and outliers (circle).
Comparison of TMTV Values Between 41% SUVmax Method and Adaptive Methods
The correlation between TMTV values from the 41% SUVmax method and those from adaptive methods was excellent, with a Spearman coefficient of 0.99, 0.99, 0.97, and 0.96 for TMTVDa, TMTVFit, TMTVNs, and TMTVBl, respectively.
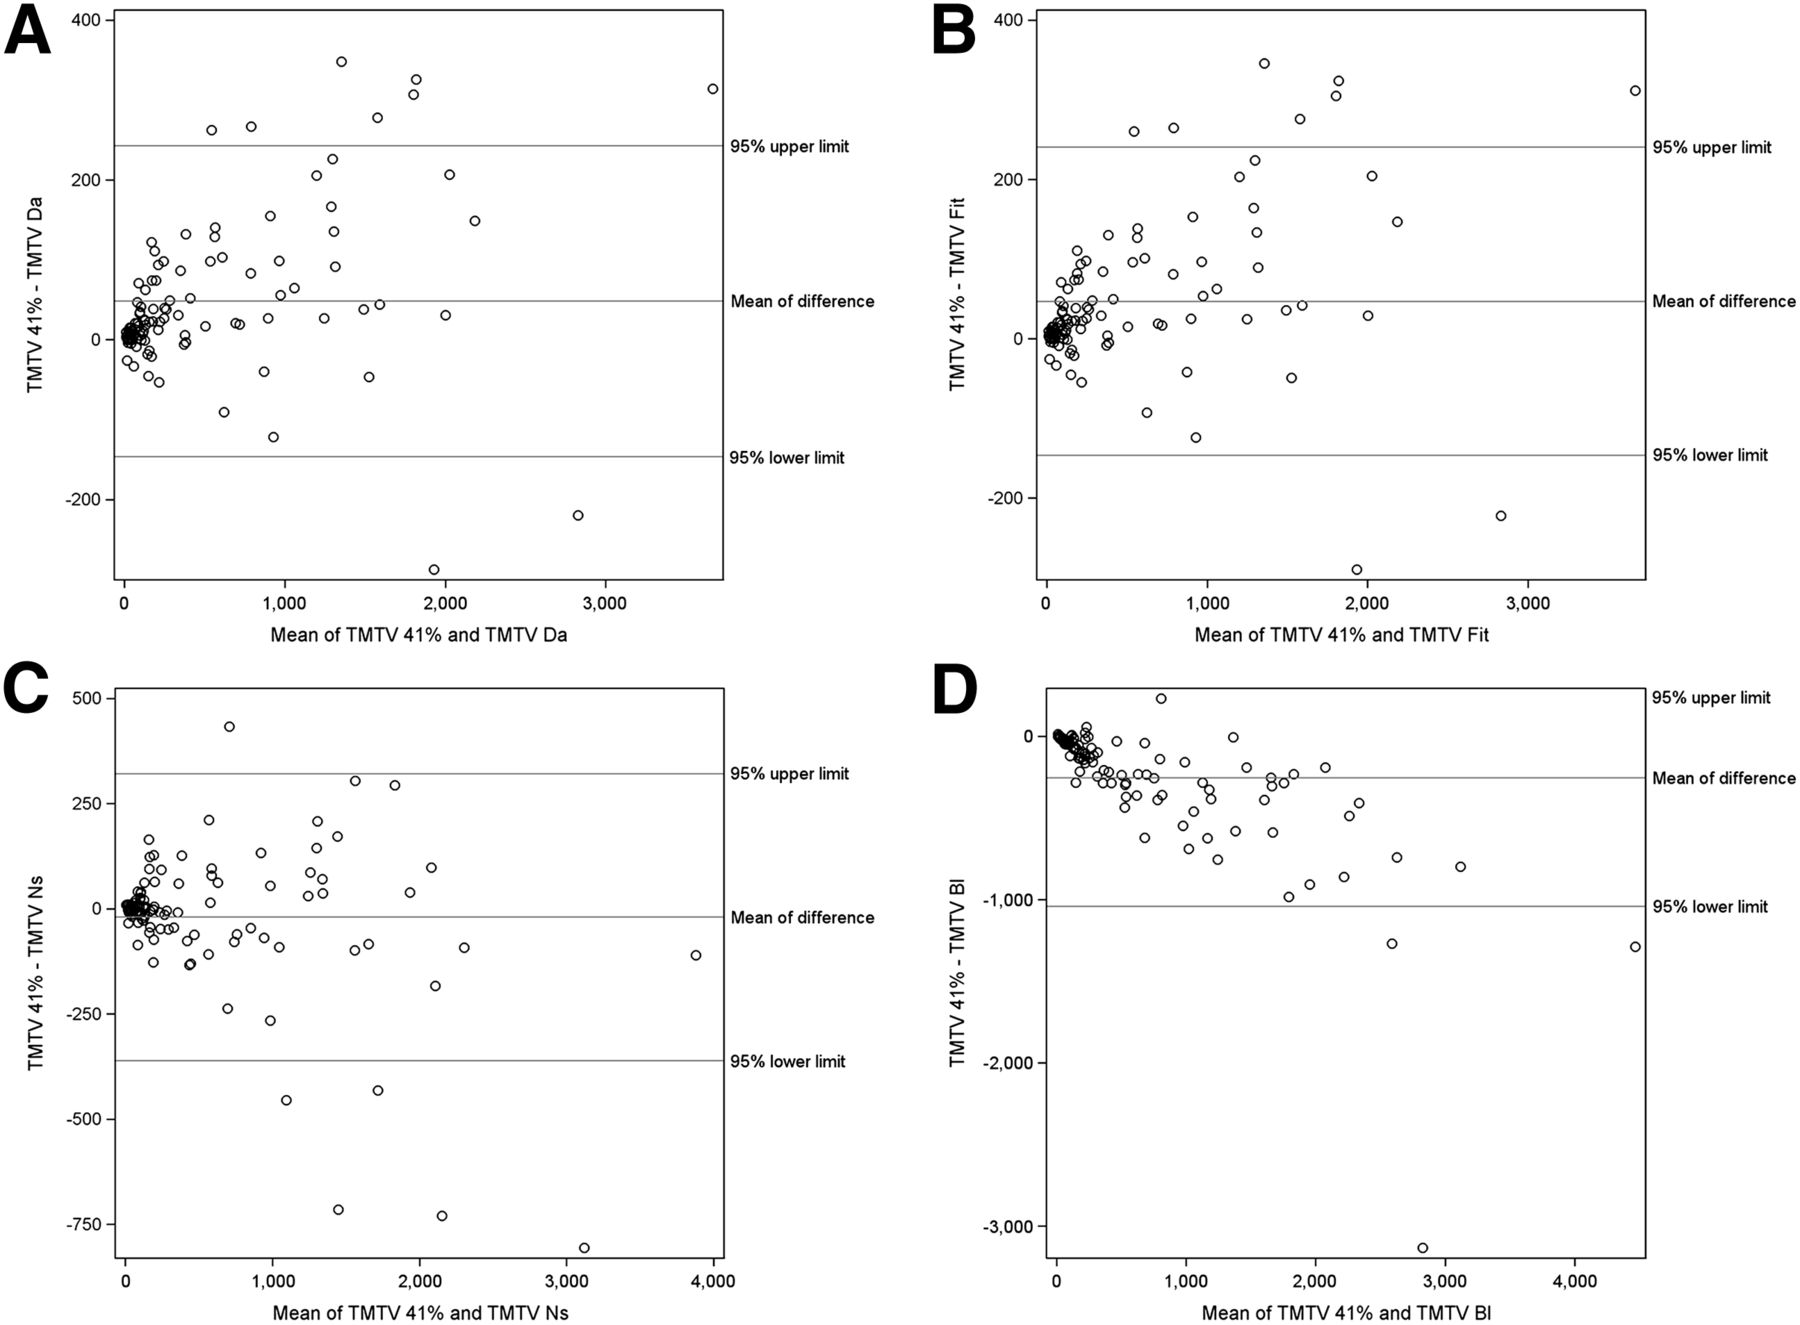
The Bland–Altman plots are presented in Figure 2. The means of difference between TMTV41% and TMTVDa, TMTVFit, TMTVNs, and TMTVBl were 48.5 ± 97.3 SD (95% CI, −147 to 243), 47.2 ± 96.7 (95% CI, −146 to 241), −19.5 ± 170.6 (95% CI, −360 to 322), and −253.3 ± 393.8 (95% CI, 534 to −1,041), respectively. A major overestimation was observed with TMTVBl compared with TMTV41%. The differences between methods increased for the high-TMTV group, with a proportional error for TMTV values greater than 500 cm3. Looking at TMTV under 500 cm3, the mean differences between 41% SUVmax and adaptive methods were really reduced: 21.8 ± 36.3 for TMTVDa, 21 ± 34.8 for TMTVFit, 0.4 ± 54.5 for TMTVNs, and −105.8 ± 124.5 for TMTVBl.

Bland–Altman analysis comparing TMTV values of TMTVDa (A), TMTVFit (B), TMTVNs (C), and TMTVBl (D) with TMTV41%. Mean bias and limits of agreements are represented by solids lines.
The ICC varied from 0.972 to 0.988 for TMTVDa, TMTVFit, and TMTVNs and was 0.856 for TMTVBl. The coefficient of variation between TMTV41% and TMTVDa, TMTVFit, TMTVNs, and TMTVBl was, respectively, 14%, 14%, 21%, and 48%.
Prognostic Value of Different Methods
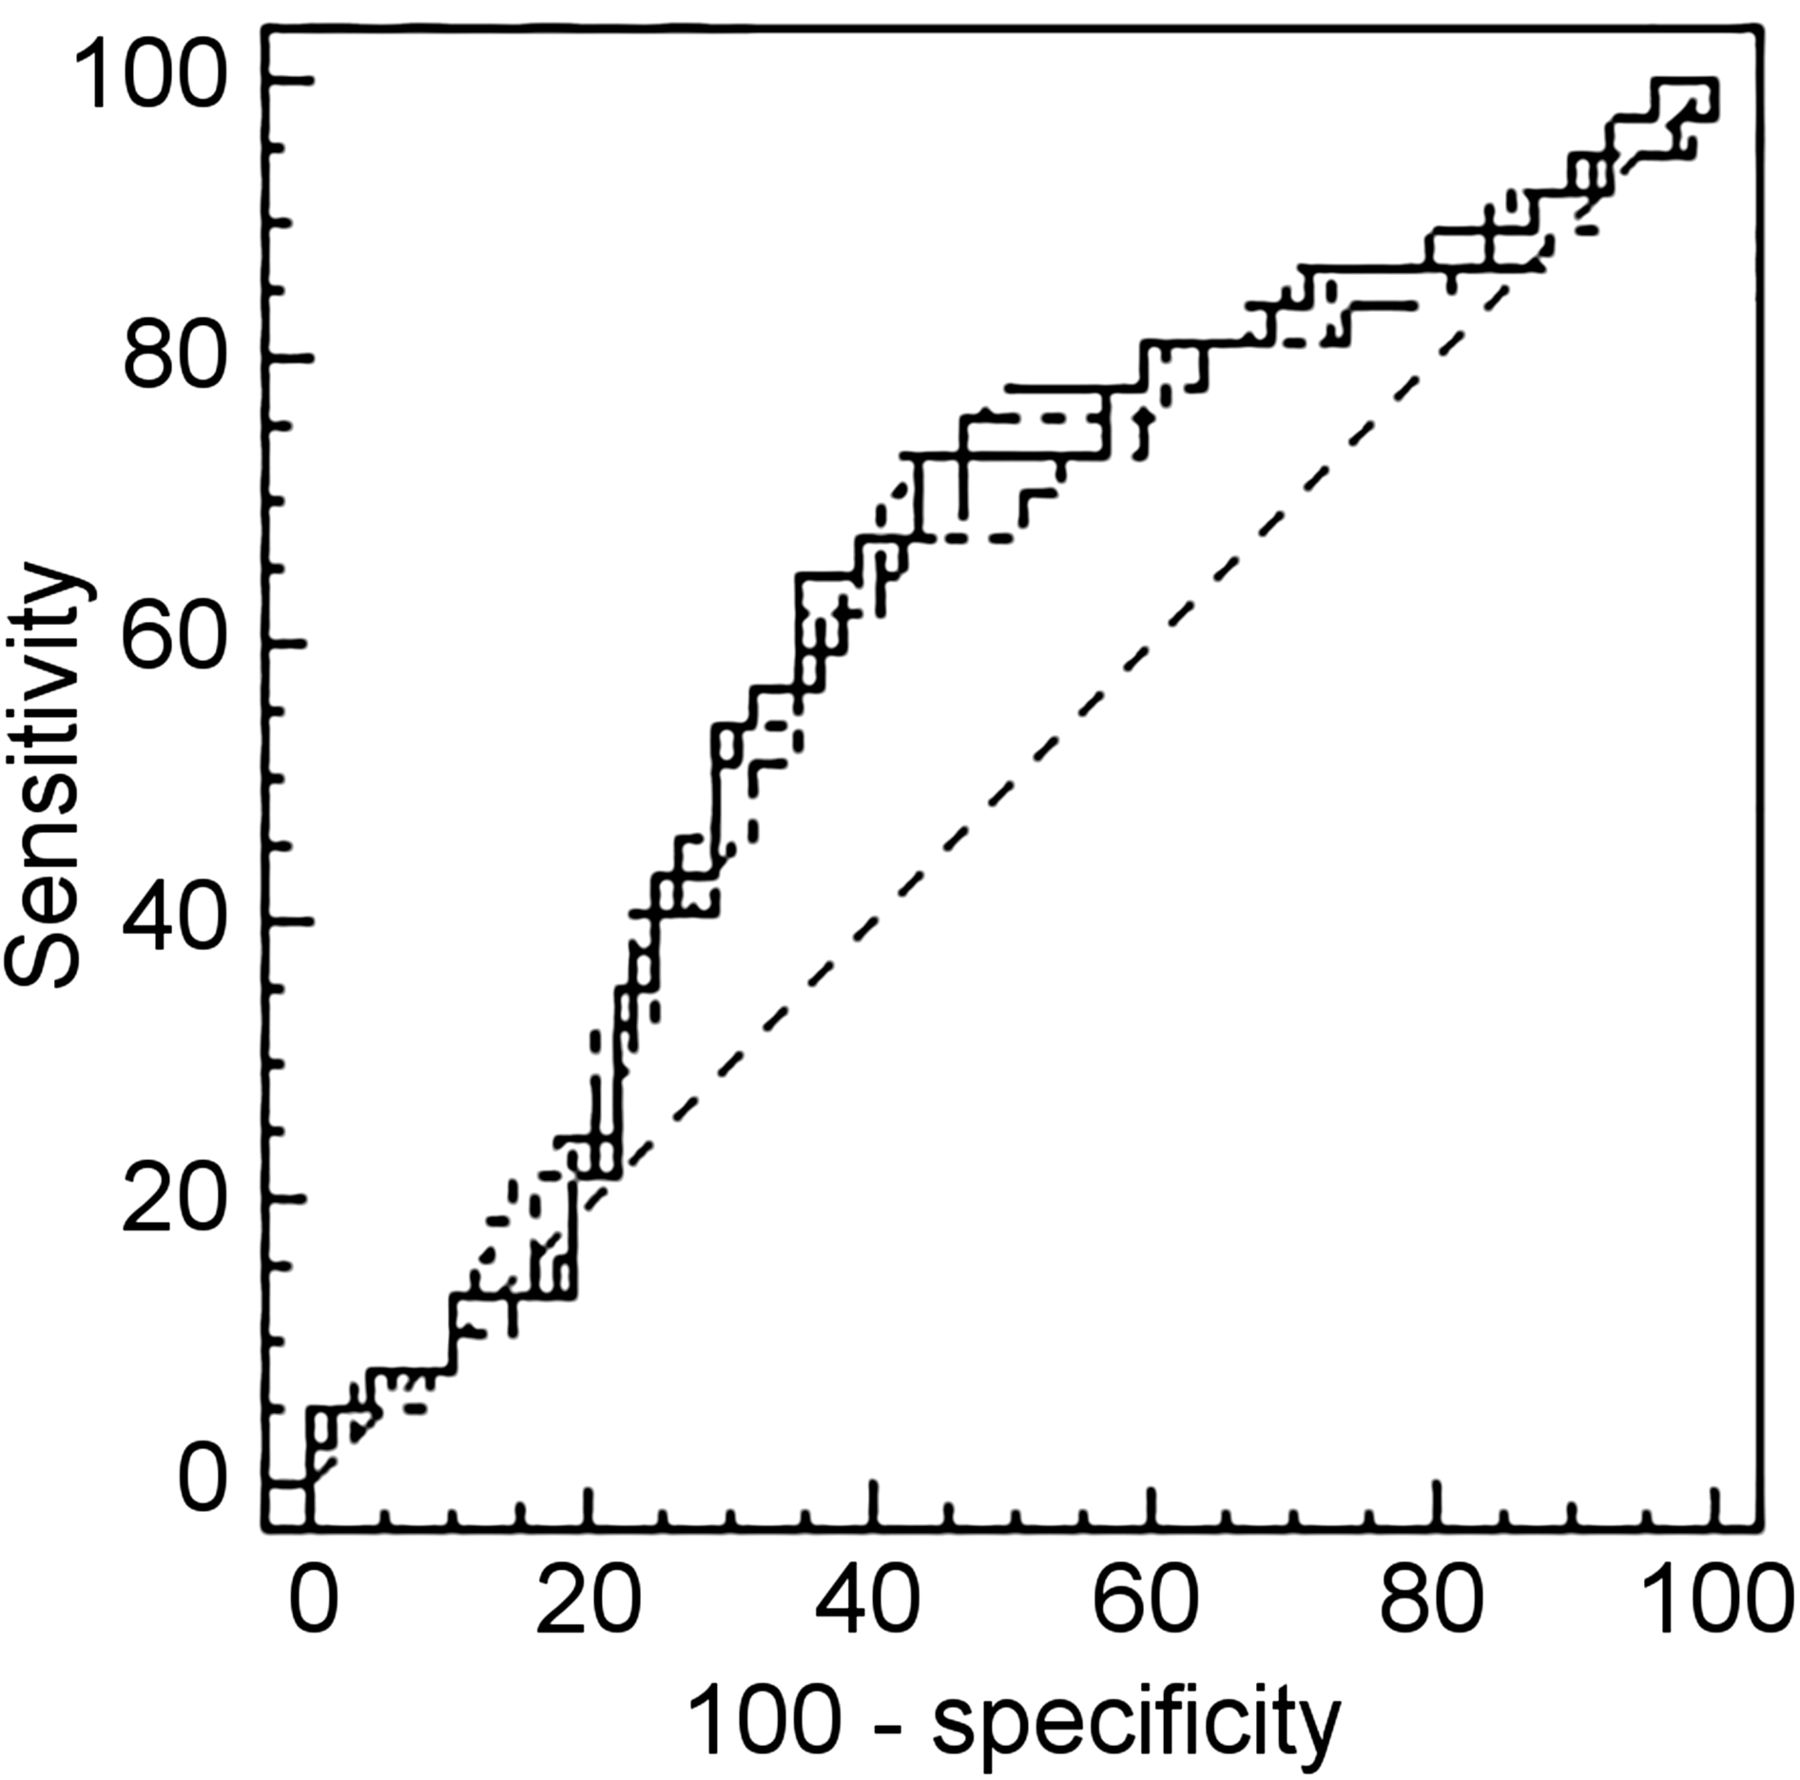
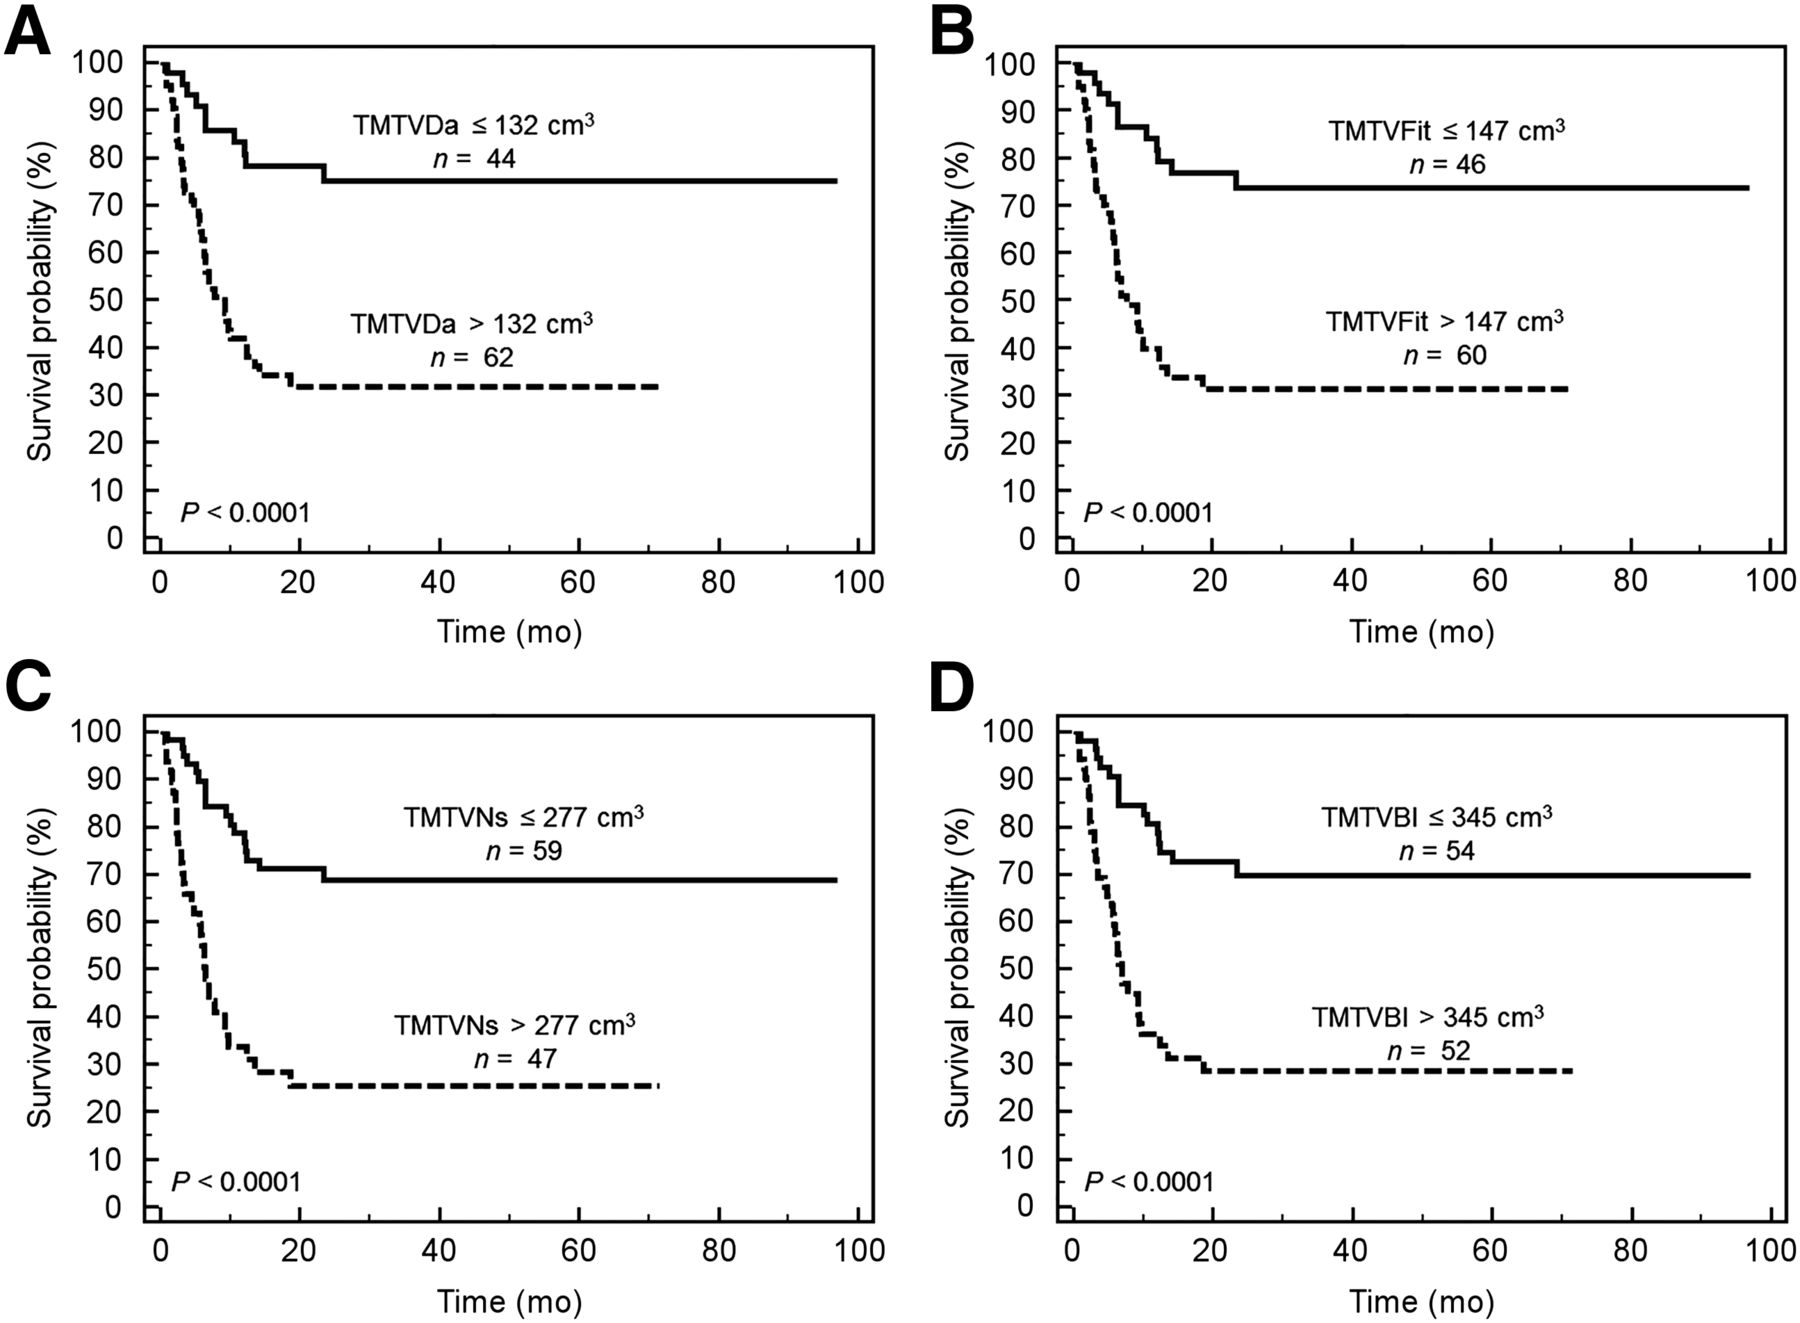
The respective optimal cutoffs found with ROC analysis for TMTV41%, TMTVDa, TMTVFit, TMTVNs, and TMTVBl were 230, 132, 147, 277, and 345 cm3 for PFS and 260, 132, 147, 191, and 345 cm3 for OS (Table 1). The respective area under the curve of TMTV41%, TMTVDa, TMTVFit, TMTVNs, and TMTVBl varied from 0.68 to 0.71 for PFS and from 0.60 to 0.62 for OS. For PFS, the area under the curve obtained with TMTVDa, TMTVFit, and TMTVNs was not significantly different (P > 0.4 for each pairwise comparison) from the area under the curve of TMTV41% (Fig. 3). A significant difference was observed for TMTVBl on PFS (P = 0.02). No significant difference was observed for OS.
ROC Optimal TMTV Cutoff, PFS, and OS Analyzed According to TMTV41%, TMTVDa, TMTVFit, TMTVNs, and TMTVBl

PFS ROC curve comparison according to each methodology.
TMTV was significantly associated with inferior PFS (P < 0.001) and OS (P < 0.001) whatever the method of computation, with no significant difference between them and similar hazard ratio (HR) (Table 1). The HR ranged from 3.7 (TMTVBl) to 4.1 (TMTV41%) on PFS and from 3.0 (TMTVBl) to 3.5 (TMTVDa) on OS. The 2-y PFS ranged from 66% to 72% for the low-TMTV groups versus 26%–29% for the high-TMTV groups and 2-y OS from 79% to 83% versus 50% to 53% (Fig. 4).

Kaplan–Meier estimates of PFS according to TMTVDa (A), TMTVFit (B), TMTVNs (C), and TMTVBl (D).
On the basis of the 230-cm3 cutoff (threshold determined with the 41% SUVmax method), the agreement between the 41% SUVmax method and adaptive methods to dichotomize the population was almost perfect, with a κ of 0.87, 0.87, and 0.87 for TMTVDa, TMTVFit, and TMTVNs, respectively. As expected, because of the major overestimation, no agreement was observed with the Black method. When this single cutoff of 230 cm3 was applied to the various methods, comparable PFS prediction was found (P < 0.0001, HR, 3.4, for Daisne modified and Fit; P < 0.0001, HR, 3.3, for Nestle; and P = 0.0056, HR, 2.4, for Black). This TMTV cutoff remained significant to predict OS except for Black (P = 0.058). For the other adaptive methods, this TMTV cutoff was slightly less significant than when using a specific optimal cutoff for each method (P = 0.0055, HR, 2.4, for Daisne modified and Fit; and P = 0.0037, HR, 2.6, for Nestle).
Comparison Between Rouen and Other Centers
Among the 106 patients, 28 were included in Rouen and 78 in the other centers. The coefficient of variation observed in the Rouen center between TMTV41% and TMTVDa, TMTVFit, TMTVNs, and TMTVBl was, respectively, 11.3%, 11.2%, 20.7%, and 40.1%, similar to those observed in the whole population. Correlations between methods were similar in the Rouen subgroup and in the other centers, with a Spearman coefficient from 0.96 to 0.99 for both subgroups. ICC was also similar for TMTVDa, TMTVFit, and TMTVNs between both subgroups, from 0.974 to 0.993 in the Rouen center and from 0.972 to 0.985 in the other centers. Regarding the Black method, ICC observed in the other centers was slightly lower than in the Rouen center, with an ICC of 0.836 compared to 0.9.
DISCUSSION
The major result of this study showed that the prognostic value of baseline TMTV computed with several adaptive methods was similar to TMTV computed with 41% SUVmax threshold method in a large series of PTCL patients taken as an example of diffuse tumor disease.
Retrospective studies have demonstrated that TMTV was a powerful predictor of outcome in different lymphoma subtypes. TMTV measurement at baseline is important because it could help in stratifying patients in different risk categories and has been suggested as a possible tool for early guiding of therapy. However, until now in lymphoma different TMTV methodologies have been used: an absolute cutoff of SUV greater than 2.5 or a relative SUVmax thresholding of the tumor sites. The absolute threshold using SUV greater than 2.5 is limited by the variability of SUVs, because of PET/CT devices, PET acquisition protocol, and reconstruction methods. In addition, because of partial-volume effect nontumor regions located between small distant nodes with high uptake could be included (15,16). Therefore, relative thresholds have been used in several lymphoma studies: a 41% SUVmax cutoff as recommended by guidelines of the European Association of Nuclear Medicine for solid tumors was applied in diffuse large B cell lymphoma, Hodgkin lymphoma, follicular lymphoma, and PTCL, and a 25% SUVmax was recently evaluated in primary mediastinal large B cell lymphoma (17).
Lymphoma characteristics—that is, a disseminated disease with different size of lesion, different sites with nodal or extranodal lesions, and heterogeneous 18F-FDG uptake (tumor-to-liver ratios varying from 1 to 15 in our series)—might limit the efficiency of both fixed-threshold methods. Conversely, adaptive methods may be more accurate and even easier to use in routine but they had not yet been tested on lymphoma.
In a previous study, we have shown in PTCL that baseline TMTV with a 230-cm3 threshold was a good tool for outcome prediction and predicted PFS and OS much better than the currently used clinical index.
In the same series of patients, we observed that the ICC found between TMTV values obtained with the 3 adaptive methods (Daisne modified, Fit, and Nestle) and those from the 41% SUVmax method were excellent. The optimal thresholds dichotomizing the population in low- and high-volume groups for each adaptive method were different, but despite these differences all these methods predicted PFS and OS with similar P and HR values for small and large volumes. The only slight incremental prognostic value compared with the 41% threshold method was observed for the Daisne modified method for OS prediction. Moreover, when the same threshold of TMTV obtained with the 41% SUVmax method (230 cm3) was used for Daisne modified, Fit, and Nestle methods, the HRs obtained for PFS and OS prediction were comparable, supporting the fact that the values obtained with each method were really close. Only Black was out of range with a major overestimation. This is probably explained because Black is based on the SUVmean whereas the other methods are based on the SUVmax.
A comparison between different methods of metabolic volume measurements has already been done in Hodgkin lymphoma. Kanoun et al. (18) have compared 41% SUVmax threshold to a per-patient adapted threshold based on SUVmax of the liver (>125% and >140% SUVmax of the liver background) in a monocentric study. They found no significant difference between ROC curves and similar prediction of PFS and OS according to high volume. It emphasized the strong prognostic value of metabolic imaging because TMTV remained prognostic throughout the different methods used. The current study is the first, to our knowledge, comparing adaptive methods to a fixed-threshold method in a large series of patients with a diffuse subtype of lymphoma, PTCL. Our results further confirm the strong prognostic value of baseline TMTV and demonstrate that these different methods of TMTV measurement equally predict outcome.
In this study, we analyzed retrospective data acquired with different PET systems on a workstation already calibrated to one of them for adaptive methods. However, standardized phantom experiments confirmed the similarity of image characteristics between centers and patients’ data comparison between adaptive techniques, and the 41% threshold was similar within centers. Indeed, TMTVs were all over 5 cm3, with a median of 231 cm3, an order of magnitude of volume where PET systems have similar detection capability.
Several quantitative measurements including TMTV and total lesion glycolysis have been done in ancillary studies of prospective trials based on quality-controlled PET (2,6,17). However, to our knowledge, no ongoing trials have been launched using the TMTV to guide therapy. Even if the prerequisite for this type of trial is quality control, as done using various existing control systems (7,19,20), it is anyway required for good PET clinical practice. The main problem is which TMTV technique measurement should be chosen because there is no established consensus. Relative methods (SUVmax thresholding or adaptive) have the advantage to minimize the errors linked to the use of different devices and the participation of different centers.
In addition, our results suggest that it is possible to conduct a prospective trial based on TMTV measurement provided a single relative method of TMTV measurement is used by all participating centers. The 41% TMTV threshold method is currently available in all commercial software and can be used in most of the PET/CT systems. It has demonstrated a good reproducibility among trained observers but requires accurate manual drawing of the volume of interest around each lesion. Adaptive methods might be an option if available in all the centers.
CONCLUSION
Our results demonstrate that adaptive methods can be used with the same efficacy as the 41% TMTV method in PTCL and would open the way to automatic procedures of volume computation. These conclusions should be confirmed for other types of diffuse aggressive lymphoma and new-generation devices.
DISCLOSURE
No potential conflict of interest relevant to this article was reported.
Acknowledgments
We acknowledge the radiophysicists of all centers participating in the study: Claire Bernard, Sebastien Hapdey, Helene Masset, and Jean Marc Vrigneaud. This study was presented during the Annual Meeting of the Society of Nuclear Medicine and Molecular Imaging, San Diego, California, June 11–15, 2016.
Footnotes
Published online Oct. 6, 2016.
- © 2017 by the Society of Nuclear Medicine and Molecular Imaging.
REFERENCES
- Received for publication June 29, 2016.
- Accepted for publication September 8, 2016.


Jump to section
Related Articles
Cited By...
- International Benchmark for Total Metabolic Tumor Volume Measurement in Baseline 18F-FDG PET/CT of Lymphoma Patients: A Milestone Toward Clinical Implementation
- A Guide to ComBat Harmonization of Imaging Biomarkers in Multicenter Studies
- Automated Segmentation of Baseline Metabolic Total Tumor Burden in Diffuse Large B-Cell Lymphoma: Which Method Is Most Successful? A Study on Behalf of the PETRA Consortium
- Deep-Learning 18F-FDG Uptake Classification Enables Total Metabolic Tumor Volume Estimation in Diffuse Large B-Cell Lymphoma
- Time to Prepare for Risk Adaptation in Lymphoma by Standardizing Measurement of Metabolic Tumor Burden
- Metabolic Tumor Volume for Response Prediction in Advanced-Stage Hodgkin Lymphoma
- Baseline and interim functional imaging with PET effectively risk stratifies patients with peripheral T-cell lymphoma
- Does PET Reconstruction Method Affect Deauville Score in Lymphoma Patients?
- Predictive Value of PET Response Combined with Baseline Metabolic Tumor Volume in Peripheral T-Cell Lymphoma Patients
- Metabolic Tumor Volume: We Still Need a Platinum-Standard Metric