


Abstract
In targeted radionuclide radiotherapy, the relationship between bone marrow (BM) toxicity and absorbed dose seems to be elusive. A compartmental model of mouse thrombopoiesis and erythropoiesis was set up to predict the depletion of hematopoietic cells as a function of the irradiation dose delivered to BM by injected radiopharmaceuticals. All simulated kinetics were compared with experimental toxicity for several stages of differentiation of the 2 hematopoietic lineages. Methods: C57BL/6 mice were injected either with 18FNa (37 and 60 MBq), a bone-seeking agent, or with saline. BM mean absorbed doses were calculated according to the MIRD formalism from small-animal PET/CT images. Hematologic toxicity was monitored over time, after 18FNa injection, by studying BM progenitors and precursors in addition to blood cells. The compartmental model takes into account the pharmacokinetics of the compound, in addition to cellular kinetics and cell radiosensitivities for the 2 studied lineages. Results: Because biodistribution studies showed an uptake of 18FNa in bones, the skeleton was considered as the principal source organ of BM irradiation. The time–activity curve obtained from validated quantification of PET/CT images allowed for the calculation of mean absorbed doses to the whole BM of 2.1 and 3.4 Gy for 18FNa injections of 37 and 60 MBq, respectively. Concerning hematologic toxicity, the model was in good agreement for the 2 absorbed doses with experimental measurements of cell depletion for platelets, progenitors, and precursors within the BM in terms of time to nadir, depletion intensity, and time to recovery. The same agreement was obtained for red blood cells and their precursors. Model predictions demonstrated that BM toxicity was in correlation with the mean absorbed dose as higher depletions at nadir and longer delays to recovery were noticed for 3.4 Gy than for 2.1 Gy. Conclusion: The developed compartmental model of thrombopoiesis and erythropoiesis in a BM toxicity context, after internal irradiation, allowed for the prediction of cell kinetics of BM progenitors, precursors, and mature blood cells in a dose-dependent manner. This model could therefore be used to predict hematologic toxicity in preclinical internal radiotherapy to study the dose–response relationship.
The objective of radiotherapy is to deliver a high absorbed dose of radiation to tumors that will lead to an effective treatment outcome without causing undesired effects in healthy tissues. Because of its high radiosensitivity, the bone marrow (BM) is often considered as the dose-limiting tissue, especially in radioimmunotherapy (1,2). Indeed, ionizing radiation impairs hematopoiesis by causing direct damage to hematopoietic cells and by altering the ability of BM stroma to support blood cell production (3). For all cell lineages, the time to recovery and the depletion intensity at the nadir are dependent on the injected activity (4). This hematopoietic pathway failure could be avoided by the ability to predict the BM toxicity to better define the therapeutic window before radioimmunotherapy.
The concept of dose–effect relationship established for external-beam radiotherapy should be applicable to radioimmunotherapy. However, this relationship remains elusive in the clinic (5). Most probable reasons are dose-assessment complexity and the insufficient data obtained from patients involved in radioimmunotherapy protocols, associated with previous BM sensitization because of pretreatments (6). In this context, the prediction of ionizing radiation effects on hematopoiesis by mathematic models could help to highlight the link between dose and biologic response. To develop such a model, mice are appropriate because they allow for studying hematologic toxicity on treatment-naïve subjects and for using invasive methods to assess dosimetry. In a radioimmunotherapy context, one model was developed by Shen et al. to simulate the effects of mouse BM irradiation for platelet production considering 3 compartments: BM progenitors, precursors, and platelets (7). Simulations were compared only with experimental peripheral platelet counts. One way to improve model accuracy and robustness would be to confront simulations with experimental measurements for several differentiation stages, such as progenitors or precursors in addition to mature blood cells.
Here, we developed a model that considers physical and biologic properties of the radiopharmaceutical and simulates the hierarchical structure of the hematopoietic system. From the absorbed dose and dose rate to the BM, the model predicts platelet and red blood cell (RBC) depletions. To develop and test the model, a bone-seeking agent—18FNa (IBA Cisbio International)—was chosen because it eased the dose calculations and efficiently irradiated the BM. Prediction accuracy was evaluated by comparing differences observed between experimental data and the model output for BM progenitors, precursors, and mature cells.
MATERIALS AND METHODS
Experimental Induction and Analysis of Myelotoxicity
Animals
Eight-week-old female C57BL/6 mice (Janvier-Europe) were used for experiments in the Center for Research and Preclinical Investigations in accordance with the institutional guidelines of the French Ethical Committee (no. CEEA.2012.131).
18FNa Biodistribution Assessment and Quantitative Small-Animal PET/CT Imaging
Mice were injected intraperitoneally with 10 MBq of 18FNa. Organs were collected after euthanasia at 1, 5, or 6 h after injection (n = 4 per analysis). Radioactivity tissue concentrations were determined using a γ counter (2470 Wizard2; Perkin Elmer).
All imaging procedures were performed using an Inveon small-animal PET/CT device (Siemens Preclinical Solutions) under anesthesia with 1.5% isoflurane (Centravet) and 1.0 liter of O2 per minute. Mice were injected intraperitoneally either with 0.9% NaCl (Centravet) for the control group or with 37 or 60 MBq of 18FNa. For all mice, either belonging to the control group or injected with 18FNa, a CT image was acquired (80 kV, 500 μA, 320 ms). CT images were achieved using a common cone-beam reconstruction method (Siemens). For mice injected with 18FNa, CT acquisition was followed by a PET acquisition (20 min). Images were reconstructed using the 3-dimensional ordered-subsets expectation maximization algorithm (18 iterations), followed by a fast maximum a priori probability algorithm (2 iterations). They were corrected for attenuation and scattering. Mice were imaged at different times after injection.
To quantify activity within the entire skeleton, regions of interest were first drawn by automatic thresholding based on CT Hounsfield units using the Inveon Research Workplace software (Siemens). They were then exported on registered PET images. Measured activity values were corrected to take into account the signal lost due to the partial-volume effect (8), as described in the supplemental data (supplemental materials are available at http://jnm.snmjournals.org). Time–activity curves within the whole skeleton and the femur were then derived from measurements performed on 46 mice.
BM and Blood Analyses
BM was harvested by flushing 1 femur with Dulbecco modified Eagle medium supplemented with 10% fetal bovine serum (Lonza). One to 5 thousand cells were added to the MethoCult GF M3434 methycellulose medium (StemCell Technologies) and seeded in duplicate in a humidified chamber at 37°C with 5% CO2. Multipotential colony-forming GEMM (granulocyte, erythrocyte, monocyte, and megakaryocyte) progenitors were scored after 14 d. Identification criteria were determined according to manufacturer’s recommendations.
The femurs from contralateral legs were fixed in 10% buffered formaldehyde and decalcified by continued electrolysis during 72 h before paraffin embedding. Transverse 3-μm-thick sections were stained by hematoxylin-eosin-safran to identify megakaryocytes as large and polyploid cells.
Ethylenediaminetetraacetic acid–treated blood was collected via a retro-orbital puncture. Numbers of reticulocytes, erythrocytes (RBCs), and platelets were determined using an automatic hematology analyzer (MS9-5; Melet Schloesing). Cytopenias were confirmed by counting cells in blood smears stained with May-Grünwald-Giemsa.
Compartmental Model
Model Hypotheses
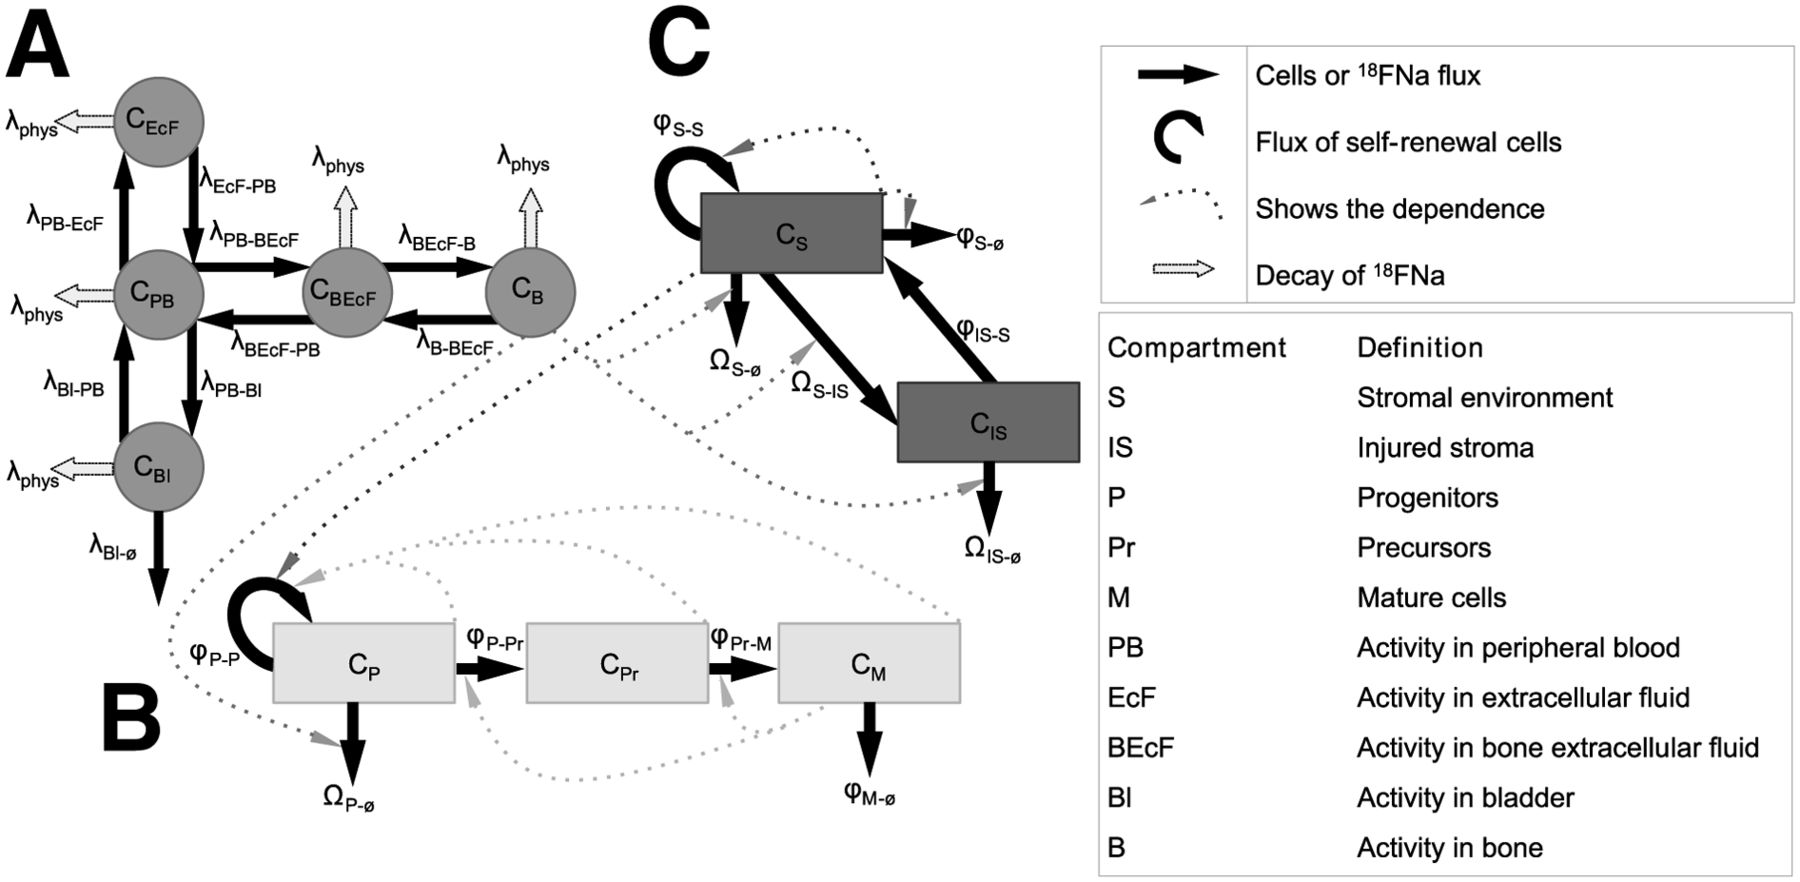
Two models, 1 for thrombopoiesis and 1 for erythropoiesis, were developed. Both models were divided into 3 parts: a common part adapted from Charkes et al. (9), which simulated the 18FNa pharmacokinetic (Fig. 1A); a second part that simulated hematopoietic cell depletions after irradiation (Fig. 1B); and a third part that described the radiation injuries on BM stroma (Fig. 1C). The second and third parts are based on a simplified representation of hematopoiesis and stromal environment as previously described by Shen et al. (7).

Simplified design of models for thrombopoiesis and erythropoiesis. Each model was divided into 3 parts: 1 for 18FNa biodistribution (A), 1 for hematopoietic system of thrombopoiesis and erythropoiesis (B), and 1 for stroma (C). Solid arrows represent 18FNa or cell flows from one compartment to another. Dashed arrows correspond to factors affecting cell flow rates. Description of each variable is given in Table 1.
Charkes model’s architecture was adopted, but rate constants were adapted to mice to fit experimental biodistribution data. Shen’s model was modified to take into account 18FNa instead of 67Cu. Modifications were also made to this model concerning the stromal damage: the stromal environment description was upgraded using the carrying capacity formulation (10).
General Description of Whole Compartmental Model
A simplified representation of the whole compartmental model is shown in Figure 1. State variables of the model are indicated in Table 1. For the whole model, the differential equation for compartment Y is described by following the general formula: Eq. 1where
  corresponds to the compartment influx from CX to CY,
  describes the efflux from CY to CZ, and
  represents elimination from compartment CY (excretion of 18FNa or cell loss by radiation injuries).
Compartmental Model Variables Associated with Figure 1
Compartmental Model of 18FNa Biodistribution
The architecture of the Charkes model was reproduced in SAAM II software (The ε Group), which generates systems of equations. The experimental blood and bone time–activity curves of the 18FNa in mice were then implemented into SAAM II. They allowed for calculating, with the Runge-Kutta integrator, the new rate constants, which describe the variation of 18FNa concentration in the compartments. For example, the concentration in peripheral blood (PB) was described by: Eq. 2The λ coefficients are rate constants, under the assumption that exchanges are linear between compartments. As described in Figure 1A, the variations correspond only to exchanges between PB and other compartments: extracellular fluid (EcF), bone extra cellular fluid (BEcF), bone (B), and bladder (Bl) and to physical decay. The same approach was used for EcF, BEcF, Bl, and B.
BM Absorbed Dose Estimation
The pharmacokinetic model allowed for deriving an accurate-fitting curve of the time–activity curve of 18FNa in mice. According to the MIRD Committee formalism (11), the radiation dose rate within the BM as a function of time,  , was obtained by multiplying the activity within the source region by the S value
  , that is, the mean absorbed dose to BM per disintegration in the source region rs:
 Eq. 3Here, the bone was considered as the principal source of irradiation, and contributions from other organs were negligible (12). The 2 S values S(BMskeleton←skeleton) and S(BMfemur←femur), which correspond respectively to the entire BM and the BM located within the femur only, were estimated using the mouse phantom MOBY with Monte Carlo calculations (MCNPX) as described previously (13). The β plus spectrum of 18F available at www.doseinfo-radar.com was used for the MCNPX simulations (14). This phantom was adapted to match with the weight of the mice used experimentally (22 g; matrix, 128 × 432 × 128; voxel size, 0.216 mm3). The derived S values were S(BMskeleton←skeleton) = 1.03 × 10⁻² mGy/(MBq⋅s) and S(BMfemur←femur) = 3.29 × 10⁻¹ mGy/(MBq⋅s). The mean absorbed dose to the BM at time t,
  , was calculated by integrating the time-dependent dose rate from zero to t. Because all mice, including controls, underwent CT, the negligible dose contribution arising from CT was not added.
Blood cell simulations (platelets, reticulocytes, and RBCs) were obtained using the whole BM absorbed dose, whereas predictions of the cell kinetics within the BM were associated with the femoral BM absorbed dose (BM GEMM and megakaryocytes).
Hematopoietic Cell Kinetics Model
The hematopoietic differentiation stages were divided into 3 compartments according to their degree of maturity (Fig. 1B): P for BM progenitors (all stages of progenitors able to proliferate), Pr for nondividing maturing precursors (megakaryocytes or reticulocytes), and M for mature blood cells (platelets or RBCs). The hematopoietic cell kinetics model takes into account the principal regulatory mechanisms such as cell fluxes between compartments (i.e., differentiation); amplification of cell numbers (i.e., self-renewal, for progenitors only); regulatory influence of stroma and of the different cell compartments (which impact the progenitors self-renewal); and finally damage caused by radiations, modeled using the linear-quadratic hypothesis.
The cell kinetics equations were: Eq. 4where CP(t), CPr(t), and CM(t) are cell percentages at time t for progenitors, precursors, and mature blood cells, respectively. CS(t) and CIS(t) represent normal and injured stroma cells, respectively, at time t (Fig. 1C). All the other parameters,
  and
and  , represent the regulatory mechanisms, mentioned above, and they are thoroughly described in the supplemental data. Noticeably, they were defined within the range of potential real-life values as listed in Supplemental Table 1.
Simulations
The numeric computation of the differential equations was implemented using the Scilab 5.3.3 software (Inria, Scilab Enterprises) that uses a standard ordinary differential equation integration procedure.
Statistical Analyses
Experimental measurements of hematopoietic cells were normalized to control counts for each date and are expressed as mean ± SD (n = 8 mice per time points). All these experiments were repeated once, except for GEMM progenitors: analyses were performed one time and confirmed by a second experiment for the nadir only.
RESULTS
Activity Quantification and Dosimetry
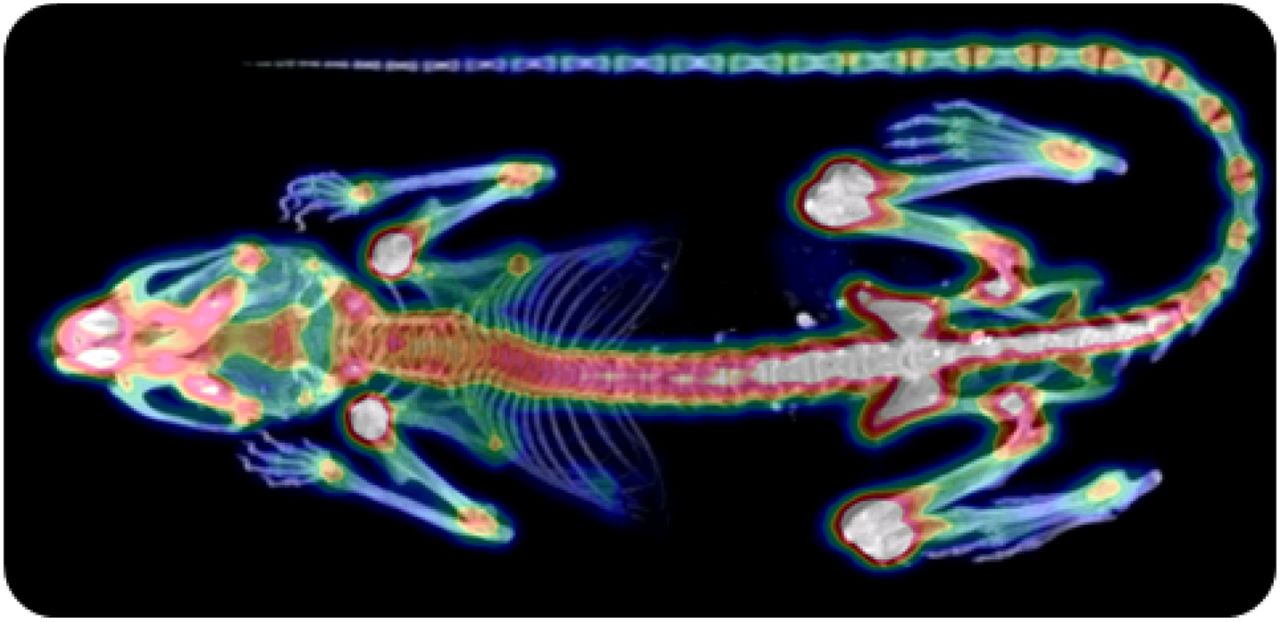
Results about the biodistibution study and the dosimetry calculations are given in the supplemental data. Briefly, activities measured in blood and organs were negligible as compared with activity uptake within bones (Fig. 2). These results confirmed that the skeleton could be considered as the principal source organ for BM absorbed dose calculations.

Example of PET/CT image 1 h after injection of 18FNa.
Using the derived time–activity curves, we calculated injected activities of 37 and 60 MBq of 18FNa to deliver, respectively, 2.1 and 3.4 Gy to the whole BM and 2.9 and 4.7 Gy to the femoral BM.
Successful Prediction of Thrombopoiesis Kinetics Using the Compartmental Model
Mice were injected at t = 0 either with NaCl for the control group or with 37 or 60 MBq of 18FNa. BM aplasia after irradiation increased with the absorbed dose (data not shown). Consequences on thrombocyte production were evaluated for less differentiated progenitors (GEMM) and precursors (megakaryocytes), both present in the BM and platelets in blood (Fig. 3; Table 2; Supplemental Fig. 2). Because an injected activity of 18FNa leads to different absorbed doses within the BM, simulations were obtained using the BMfemur absorbed dose for the GEMM and megakaryocytes and using the whole-BM absorbed dose for platelets.
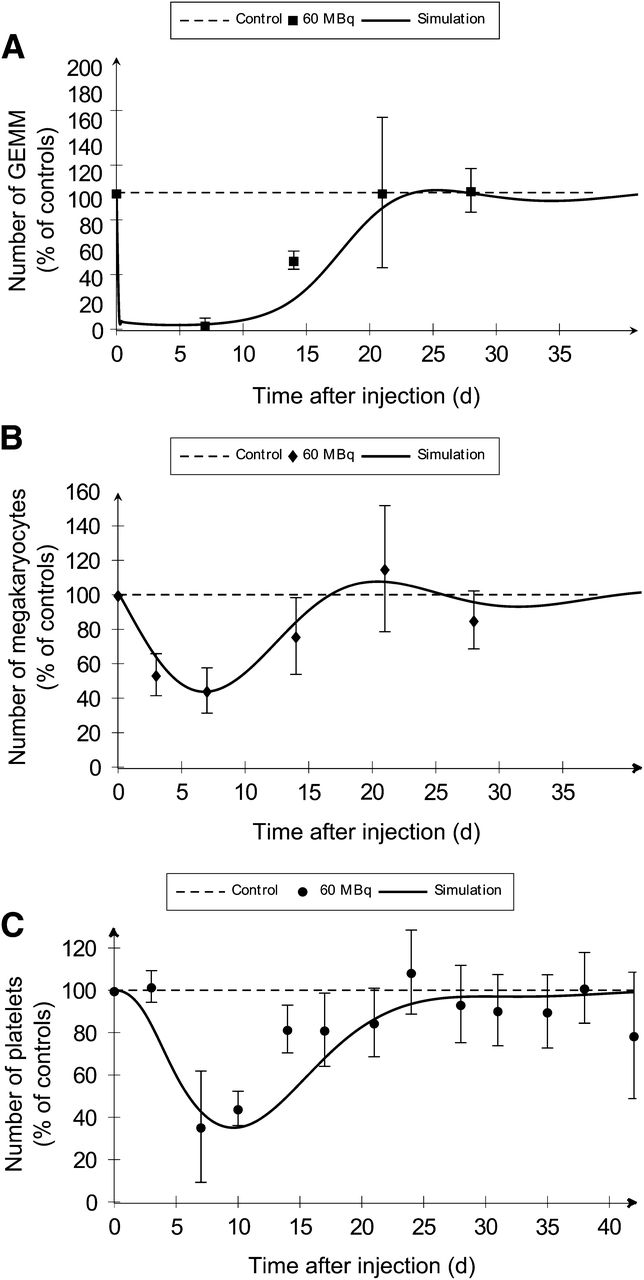
As compared with experimental measurements (dots), compartmental model simulations (solid lines) predict thrombopoietic cell kinetics after injection of 60 MBq of 18FNa. (A) BM cells were isolated from femur after irradiation and cultured for GEMM progenitor colonies counting. (B) Megakaryocyte number per mm2 within femur was determined by histology. (C) Platelets were counted in PB.
Comparisons Between Experimental Data and Compartmental Model Predictions
Predictions obtained with the model were in good agreement with the experimental measures (Table 2). Simulated values of times to nadir and to recovery were within the time interval experimentally observed. Depletion intensities at nadirs were calculated with less than 3% of error for GEMM and megakaryocytes and less than 6.5% for platelets.
Concerning injection of 60 MBq, simulated curves showed a rapid depletion of GEMM within the first 24 h, followed by a second slower phase reaching the nadir at day 4.8 (Fig. 3A). Megakaryocyte depletion began just after injection but was slower than the depletion observed for GEMM, with a nadir delayed in time and observed at day 7 (Fig. 3B). These effects induced a delayed decrease of platelets in blood, as demonstrated by the normal platelet count at day 3 and a nadir observed at day 9.8 (Fig. 3C).
Curve shapes were similar after injection of 37 MBq (Supplemental Fig. 2). Nevertheless, the increase of the BM absorbed dose was associated with an increase of the depletion at the nadir for the 3 studied cell stages (Table 2). Simulated depletions were 85.5% versus 96.9% for GEMM, 39.0% versus 56.2% for megakaryocytes, and 44.5% versus 67.4% for platelets. Simulations showed no difference between 2.1 and 3.4 Gy in the time to nadir for megakaryocytes but a time lag for progenitors and platelets, because 5 more days were necessary to reach the nadir with the higher dose. Finally, significant delays for recovery were predicted by the model for GEMM and platelets (Table 2).
Prediction of Erythropoietic Toxicity by the Compartmental Model
To assess the effect of BM irradiation on erythropoiesis, RBCs and their precursors—that is, reticulocytes—were scored in blood (Fig. 4; Table 2; Supplemental Fig. 3). Associated simulations were obtained using the whole BM absorbed dose of 2.1 and 3.4 Gy for 37 and 60 MBq of 18FNa, respectively.

Compartmental model simulations (solid lines) of erythroid cells after BM irradiation are representative of experimental conditions (dots). Reticulocyte (A) and RBC (B) numbers in blood were determined after injection of 60 MBq of 18FNa.
Simulated values for times to nadir were within time intervals obtained by experimentations (Table 2). Errors between simulated nadir values and experimental percentages were less than 10%. The model predicted the observed rebounds of reticulocytes in blood with good agreement in terms of times and maximum increases. Coherent results were obtained for the simulation of recovery for the 2 cell types, except for RBC at 2.1 Gy for which a 2-d difference was observed between experimentation and simulation.
The model provided an explanation for the effects of BM irradiation on erythropoiesis. With an irradiation of 3.4 Gy, a rapid depletion of precursors within the first 72 h was noticed (Fig. 4A). As a consequence, RBCs decreased just after injection, but slower and less importantly than reticulocytes (Fig. 4B). The RBC’s nadir was reached with a delay at day 16.3. The recovery of RBCs from nadir to baseline was associated with the reticulocyte rebound. The same curve shapes were obtained at 2.1 Gy (Supplemental Fig. 3).
The erythropoietic compartmental model showed that the depletion at the nadir for reticulocytes and RBCs increased with the absorbed dose (Table 2). For 2.1 and 3.4 Gy, respectively, the simulated depletions were 68.4% versus 87.5% for the precursors and 10.0% versus 16.3% for RBCs. The higher dose was associated with a faster decrease and a shift of the time to nadir. Moreover, when dose increased, the reticulocyte rebound intensity was higher and a time lag to recovery of 1.7 d was observed for both cells.
DISCUSSION
This paper presents a model that predicts platelet and RBC kinetics after 18FNa administration in mice. The required dosimetric input values for this model are both the absorbed dose and the dose rate to the BM. To take into account those values, a pharmacokinetic model was developed that fit experimental biodistribution measurements performed with PET/CT imaging. This latter technique permitted the time–activity curve within the entire skeleton (rather than the measurement on an isolated and therefore nonrepresentative bone by γ counting) to be derived. The PET/CT technique also permitted evaluation of the toxicity on the same mice as the ones used for quantification. To estimate the absorbed dose and the dose rate to the BM, the S values were determined from Monte Carlo calculations using the MOBY phantom. This step is a source of uncertainties. First, the S values were phantom-based and as such not specific for each mouse. Second, the limited resolution of the MOBY phantom did not allow for an accurate representation of the BM compartments. For these 2 points, despite these limitations, the MOBY phantom corresponds up to now to the state-of-the-art dosimetry. Finally, a uniform activity distribution within bones was considered, whereas PET images showed a higher uptake within long bone epiphyses (Fig. 2). From this, we can derive that the dose distribution in BM was nonuniform. The experimental data were obtained for 2 different injected activities of the same radiopharmaceutical. We can assume that the resulting nonuniformities were equivalent for both cases and as such the importance of the nonuniform activity distribution within bones cannot be established here.
In the case of dosimetry refinement, the radiobiologic parameters α and β of the quadratic linear model could be modified to keep the good agreement between model predictions and experimental results. An additional parameter could also be added within the linear-quadratic equations, the Lea-Catcheside coefficient (G) (15), that takes into account the effect of the dose rate at which the dose is delivered on the quadratic term. Another effect of the dose–rate on the hematologic toxicity, which is the relative rate at which cells are inactivated in regards to this given cells renewal, is natively considered in the model.
The hematologic toxicity was investigated by the traditional method—that is, by assessing the number of blood cells over time after the injection of the radiopharmaceutical (16). Model predictions were in good agreement with the experiments and with the literature in terms of curve shapes and dose increase effects. Indeed, we observed as well that increasing dose was associated with a delayed nadir with higher depletion and a delayed recovery. As far as depletion magnitude is concerned, no direct comparison was possible because of few reports on BM absorbed dose in previously published studies of internal radiotherapy. Nevertheless, the obtained toxicities for the 2 BM absorbed doses used in the present study were coherent with published external-beam radiation therapy results for the different studied cells (17,18).
The kinetics of GEMM progenitors and precursors of platelets and RBCs were also investigated, and the model accurately predicted the experimental observations. These observations confirmed that BM irradiation directly injured the progenitors whereas the decrease of precursors and mature cells could be explained by the nonrenewal of naturally dying cells, as previously described (19,20). Indeed, a rapid depletion of progenitors was noticed whereas delayed effects were observed for precursors and then for blood cells.
The robustness of the model was demonstrated by its good predictions of cell kinetics at various stages of differentiation and for 2 mean absorbed doses delivered to the BM. The parameters α and β were the only ones that were adapted to improve model predictions. On the contrary, all cellular constant values, such as cell life spans or differentiation times, were fixed and derived from the literature. It is important to consider that the values of α and β were still coherent with previously published values (7), even though those others were determined in a context of external-beam radiation therapy.
As the model predictions are based only on the absorbed dose and dose rate to the BM, we do expect that the model could be used for different radiopharmaceuticals, for instance, in a context of radioimmunotherapy, provided that the dosimetry is accurately performed. Potential applications of this model to clinical treatments are also envisaged: indirectly, by helping to improve the dose–toxicity relationship understanding, or directly, if model parameters are adapted to human constants. For this last possibility, refinements will be required to take into account, for instance, the status of BM reserve before the radioimmunotherapy protocol (21).
CONCLUSION
We developed a model adapted to preclinical targeted radionuclide therapy that predicted platelet and RBC toxicity in mice, with representative simulations of hematopoietic precursors, progenitors, and mature cell kinetics for 2 different levels of BM absorbed doses. This study thus opens the potential use of such models to investigate the dose–response relationships for the hematologic toxicity related to targeted radionuclide therapy.
DISCLOSURE
The costs of publication of this article were defrayed in part by the payment of page charges. Therefore, and solely to indicate this fact, this article is hereby marked “advertisement” in accordance with 18 USC section 1734. This work was funded by grants from City of Nantes “Nantes Génération Recherche 2015,” from the Pays de la Loire Council “Nucléaire pour la Santé,” from the Labex “IRON,” and from the Equipex “ArronaxPlus.” No other potential conflict of interest relevant to this article was reported.
Acknowledgments
We thank Dr. Marion Fusellier (ONIRIS) for her help in the experimental work and the INSERM U957 (Nantes) for bone decalcification.
Footnotes
↵* Contributed equally to this work.
Published online Jun. 16, 2014.
- © 2014 by the Society of Nuclear Medicine and Molecular Imaging, Inc.
REFERENCES
- Received for publication October 31, 2013.
- Accepted for publication April 7, 2014.


Jump to section
Related Articles
Cited By...
- No citing articles found.