


Abstract
PET-based radiomics have been used to noninvasively quantify the metabolic tumor phenotypes; however, little is known about the relationship between these phenotypes and underlying somatic mutations. This study assessed the association and predictive power of 18F-FDG PET–based radiomic features for somatic mutations in non–small cell lung cancer patients. Methods: Three hundred forty-eight non–small cell lung cancer patients underwent diagnostic 18F-FDG PET scans and were tested for genetic mutations. Thirteen percent (44/348) and 28% (96/348) of patients were found to harbor epidermal growth factor receptor (EGFR) or Kristen rat sarcoma viral (KRAS) mutations, respectively. We evaluated 21 imaging features: 19 independent radiomic features quantifying phenotypic traits and 2 conventional features (metabolic tumor volume and maximum SUV). The association between imaging features and mutation status (e.g., EGFR-positive [EGFR+] vs. EGFR-negative) was assessed using the Wilcoxon rank-sum test. The ability of each imaging feature to predict mutation status was evaluated by the area under the receiver operating curve (AUC) and its significance was compared with a random guess (AUC = 0.5) using the Noether test. All P values were corrected for multiple hypothesis testing by controlling the false-discovery rate (FDRWilcoxon, FDRNoether) with a significance threshold of 10%. Results: Eight radiomic features and both conventional features were significantly associated with EGFR mutation status (FDRWilcoxon = 0.01–0.10). One radiomic feature (normalized inverse difference moment) outperformed all other features in predicting EGFR mutation status (EGFR+ vs. EGFR-negative, AUC = 0.67, FDRNoether = 0.0032), as well as differentiating between KRAS-positive and EGFR+ (AUC = 0.65, FDRNoether = 0.05). None of the features was associated with or predictive of KRAS mutation status (KRAS-positive vs. KRAS-negative, AUC = 0.50–0.54). Conclusion: Our results indicate that EGFR mutations may drive different metabolic tumor phenotypes that are captured in PET images, whereas KRAS-mutated tumors do not. This proof-of-concept study sheds light on genotype–phenotype interactions, using radiomics to capture and describe the phenotype, and may have potential for developing noninvasive imaging biomarkers for somatic mutations.
Non–small cell lung cancer (NSCLC) accounts for more than 80% of lung cancers and affects more than 220,000 people in the United States. It is the leading cause of cancer-related death, with a 5-y survival rate of only approximately 15% (1). Advances in cancer genomics have demonstrated that NSCLC is driven by somatic mutations in key oncogenes, such as epidermal growth factor receptor (EGFR) and Kristen rat sarcoma viral (KRAS) (2,3). These discoveries have led to the use and regulatory approval of EGFR-specific tyrosine kinase inhibitors for treatment of patients who harbor an EGFR mutation (4–6). Furthermore, KRAS mutants have been found to respond poorly to both tyrosine kinase inhibitors and conventional cisplatin-based chemotherapy, resulting in poor treatment outcomes (7,8). Therefore, given the driving force of mutation status in the efficacy of NSCLC therapies, identification of mutation status is crucial for selecting the most effective treatments, and ultimately, dictating patient outcomes. The current standard of care uses molecular testing to identify mutation status based on biopsies of tumor tissue or surgical resection; however, molecular testing can be limited by invasive procedures, long processing times, sampling error, and tissue samples that are not always readily available (9–11).
Noninvasive 18F-FDG PET/CT is increasingly used for imaging of glucose metabolism and is part of the standard initial workup for NSCLC patients in the United States (12,13). Furthermore, the metabolic tumor phenotype captured in PET images may be an indication of the underlying biology associated with somatic mutations. For example, a mutation in EGFR activates the Akt signaling pathway, which promotes glucose consumption in tumor cells for their continuous growth and survival (14,15). In addition, increased glucose transport and glycolysis have been observed in KRAS-mutated colorectal and pancreatic cancer cell lines (16,17). Thus, previous studies have investigated the associations between these mutations and SUV measures from PET images; however, there have been conflicting findings (18–22). These inconsistent reports may be due to the fact that simple SUV measures fail to capture the spatial relationships between image voxels, which may be more informative of the biology of these mutations and describe the degree of tumor heterogeneity (23,24). Highly heterogeneous tumors are often associated with poor prognosis because resistance to therapy can develop in subpopulations of tumor cells (25,26). Therefore, accurate quantification of tumor heterogeneity from PET images may provide important information for the identification of mutation status and precision medicine. Heterogeneity in the tumor phenotype can be quantitatively described through radiomic features (23,27,28), which use advanced mathematic models to quantify the spatial relationship between image voxels (29).
In this proof-of-concept study, we assessed the associations between PET radiomic features with somatic mutations and their ability to predict mutation status in 348 NSCLC patients. To our knowledge, this is the first study to investigate the relationship between somatic mutations and the metabolic phenotype, which may provide valuable information for developing noninvasive imaging biomarkers to complement molecular testing in determining mutation status.
MATERIALS AND METHODS
Patient Imaging
This retrospective study was conducted under a Dana-Farber/Harvard Cancer Center Institutional Review Board–approved protocol. This study included 348 patients with NSCLC who underwent a diagnostic 18F-FDG PET/CT scan before treatment between September 2003 and December 2013. Patient characteristics are shown in Table 1.
Patient Characteristics
Patients were injected with 344–921 MBq (9.3–24.9 mCi) of 18F-FDG and scanned approximately 65 min after injection on Discovery (GE Healthcare), Biograph (Siemens AG), or GEMINI TF (Philips) PET/CT scanners (Table 1). Attenuation correction was performed on the PET images using the corresponding CT images. The acquisition time was 3–5 min per bed position for a whole-body scan.
Mutation Status Analysis and Patient Classification
Tissue samples of primary tumors were acquired through biopsy or surgical resection. Somatic mutations were tested using a polymerase chain reaction–based method or PROFILE Oncomap (30). The nucleotide sequence encoding the kinase domain (exons 18–24) of EGFR and exons 2–3 of KRAS were analyzed by a polymerase chain reaction–based method and capillary gel electrophoresis. PROFILE Oncomap is a mass spectrometry genotyping technique that analyzes more than 470 unique mutations in 41 oncogenes. Fifty-one percent (178/348) of patients had their mutation status identified by polymerase chain reaction and 49% (170/348) using PROFILE Oncomap.
Of the 348 patients who were tested for EGFR mutations, 44 patients tested positively for an EGFR mutation (EGFR+), whereas 304 patients were EGFR-negative (EGFR–). Among the 44 EGFR+ patients, 19 (43%) and 2 (5%) had a L858R or L861Q substitution mutation in exon 21, respectively. Two (5%) patients had a G719C and 2 (5%) had a G719S substitution mutation in exon 18. A deletion mutation in exon 19 was found in 19 (43%) EGFR+ patients. Three hundred seventeen patients were tested for KRAS mutations. Although 96 patients harbored a KRAS mutation (KRAS-positive [KRAS+]), 221 patients were KRAS-negative (KRAS–). Of the 96 KRAS+ patients, 47 (49%), 48 (50%), and 1 (1%) had a substitution mutation in exon 1, 2, or 3, respectively.
One hundred eighty-five patients tested negatively for EGFR and KRAS mutations (EGFR– and KRAS–). Thirty-one patients were tested only for an EGFR mutation, but not KRAS, because of the lack of medical necessity. In this study, we performed 3 comparisons: EGFR+ versus EGFR–, EGFR+ versus KRAS+, and KRAS+ versus KRAS–. A subset analysis was also performed on patients with adenocarcinoma histology (251 patients). Of these 251 patients, 36 and 84 patients harbored EGFR and KRAS mutations, respectively.
PET Feature Extraction and Selection
The metabolic tumor volume (MTV) was delineated on PET images with a fixed SUV threshold of 2.5. A nuclear medicine board-certified radiologist was masked from the mutation data and reviewed the delineations of all 348 MTVs. All radiomic features were implemented in MATLAB (The MathWorks Inc.) and computed within the MTV. Before computation of the radiomic features, the image voxel intensities were resampled into equally spaced bin widths of 0.1 (31).
In total, 68 radiomic features were extracted from the PET images, including 7 shape features (29), 13 histogram-based features (29), and 48 texture features. The texture features included 22 gray level cooccurrence matrix (32), 11 run length matrix (33), 10 size zone matrix (34), and 5 neighborhood gray-tone difference matrix (35) features (Supplemental Table 1; supplemental materials are available at http://jnm.snmjournals.org). In addition, 5 conventional features (MTV, SUVmax, SUVpeak, SUVmean, and SUVtotal) were computed for comparison with the radiomic features.
Radiomics Feature Selection
The Spearman correlation coefficient (R) was used to assess the correlation between all radiomic and conventional features in R software (version 3.2). Feature pairs with a |R| greater than 0.95 were considered to be highly correlated and likely to provide redundant rather than complementary information about the mutation status. Features with the highest average |R| were excluded. As a result, 21 features (19 radiomic [1 shape feature, 3 histogram-based features, and 15 texture features] and 2 conventional) were included in the analysis. The selected features are shown in Table 2. All other 51 features were correlated to at least 1 of these 21 features with an R greater than 0.95 (Supplemental Figs. 1 and 2). A Pearson correlation coefficient was used to assess the correlation between the selected 21 features, which ranged from 0.05 to 0.95 as shown in Supplemental Figure 2.
Description of Selected PET-Based Features That Were Included in Analysis
Data Analysis
The association of PET features with mutation status was evaluated by comparing the distribution of each feature within the following groups: EGFR+ versus EGFR–, KRAS+ versus KRAS–, and EGFR+ versus KRAS+. The Wilcoxon rank-sum test was used to determine whether there was a significant difference in the feature values between each mutation status. All P values were corrected for multiple hypothesis testing using the Benjamini–Hochberg method (false-discovery rate [FDR]) (36) (FDRWilcoxon), with a significance threshold of 10%.
Univariate analysis was performed with R software (version 3.2) using the pROC and survcomp packages from Bioconductor (37). We evaluated the performance of each feature in classifying patients according to their mutation status (i.e., EGFR+ from EGFR–, KRAS+ from KRAS–, and EGFR+ from KRAS+). The performance was quantified using the AUC. The AUC is interpreted as the probability of correctly classifying the patients into different mutation categories and ranges from 0.5 to 1.0, where a value of 0.5 indicates a random guess and a value of 1.0 indicates a perfect classification. The Noether test was used to determine whether the AUCs were significantly greater than 0.5. P values were FDR-corrected (FDRNoether), with a significance threshold of 10%.
To assess whether the radiomic features significantly outperformed the conventional features in predicting mutation status, the receiver-operating-characteristic (ROC) curves of the radiomic features with the highest AUCs were compared with the ROC curves of MTV and SUVmax using a bootstrap test (38). P values of less than 0.05 were considered statistically significant.
RESULTS
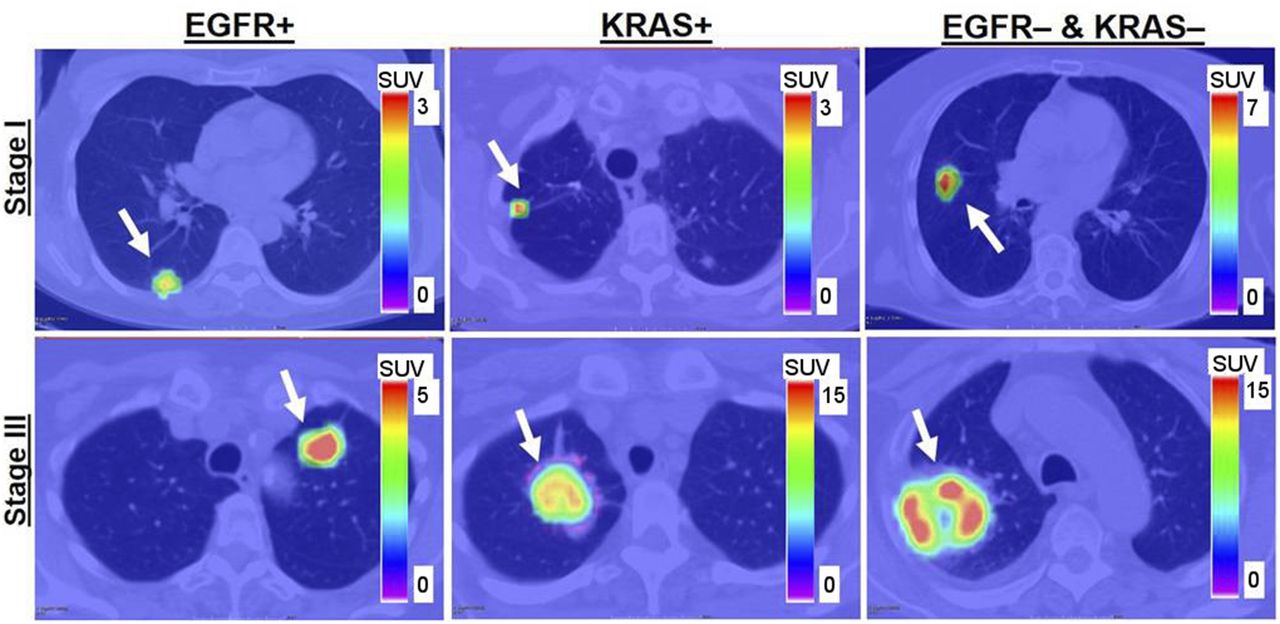
This study assessed the association of PET-based radiomic features with NSCLC mutation status and evaluated their ability to predict mutation status in a large patient cohort. Of 348 patients who were tested for somatic mutations, 13% (44/348) of patients were EGFR+, whereas 28% (96/348) of patients were KRAS+ (Table 1). Most patients in the total cohort were women (61%), Caucasian (91%), and current/former smokers (82%) and had adenocarcinoma (72%). Approximately 40% and 60% of patients in the total cohort were overall stage I/II and stage III/IV, respectively. We observed that patients who harbored an EGFR mutation (EGFR+) generally had smaller and more compact tumors with lower 18F-FDG uptake than EGFR– (Figs. 1 and 2).

From left to right are patients with EGFR mutation, KRAS mutation, and EGFR– and KRAS– tumors. Stage I and III tumors are shown in top and bottom rows, respectively. Arrows indicate locations of lung tumors.
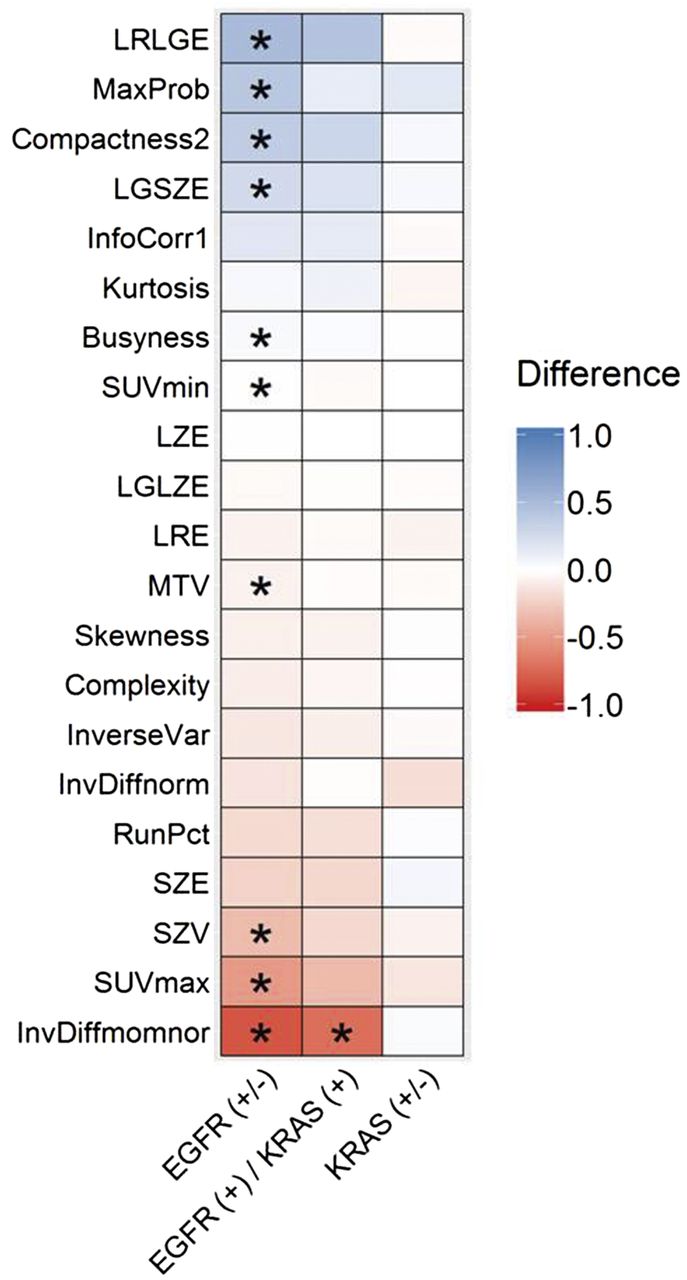
Comparison of PET features between mutation statuses. Wilcoxon rank-sum test was used to determine whether there was a significant difference in the PET feature between the mutation statuses. FDRWilcoxon ≤ 0.10 is indicated by *. Values of all PET features were normalized using z-transformation. Entries in columns of EGFR+ vs. EGFR–, EGFR+ vs. KRAS+, and KRAS+ vs. KRAS− represent differences of medians of transformed measures. For example, in EGFR+ vs. EGFR– column, entry values < 0 indicate that median value of PET feature for EGFR+ is lower than EGFR–. LGSZE = low gray small zone emphasis; LGLZE = low gray large zone emphasis; LRE = long run emphasis; LRLGE = long run low gray emphasis; LZE = large zone emphasis; RunPct = run percentage; SZE = small zone emphasis; SZV = size zone variability.
The total set of PET features extracted from the tumor volume was reduced to a small subset of descriptive features using an unsupervised selection method that reduced redundancy among the features. This method resulted in 21 features (19 radiomic and 2 conventional) that were analyzed for their associations with and predictive power for mutation status.
Comparison of PET Features Between Mutations
To assess the associations between PET features and mutation status, we compared the distribution of values of each feature between the following groups: EGFR+ versus EGFR–, EGFR+ versus KRAS+, and KRAS+ versus KRAS– (Fig. 2). A significant difference between the medians of the feature values for each mutation status indicated an association between the feature and mutation. Significant associations with 8 radiomic features (compactness, SUVmin, MaxProb, InvDiffmomnor, long run low gray emphasis, size zone variability, low gray size zone emphasis, and busyness), as well as both conventional features (MTV, SUVmax) and EGFR mutation status was observed (EGFR+ vs. EGFR–, FDRWilcoxon = 0.01–0.10). A significant association was found in the radiomic feature normalized inverse difference moment (InvDiffmomnor) between EGFR+ and KRAS+ (FDRWilcoxon = 0.08). None of the features was found to be significantly different between KRAS+ and KRAS– (FDRWilcoxon ≥ 0.92). Compactness was significantly associated with the EGFR mutation (EGFR+ vs. wild-type [WT], FDRWilcoxon = 0.08) (Supplemental Fig. 3). KRAS mutants demonstrated no distinctive imaging features. In particular, none of the PET features was significantly associated with the KRAS mutation (FDRWilcoxon ≥ 0.67) (Supplemental Fig. 3).
Prediction of Mutation Status
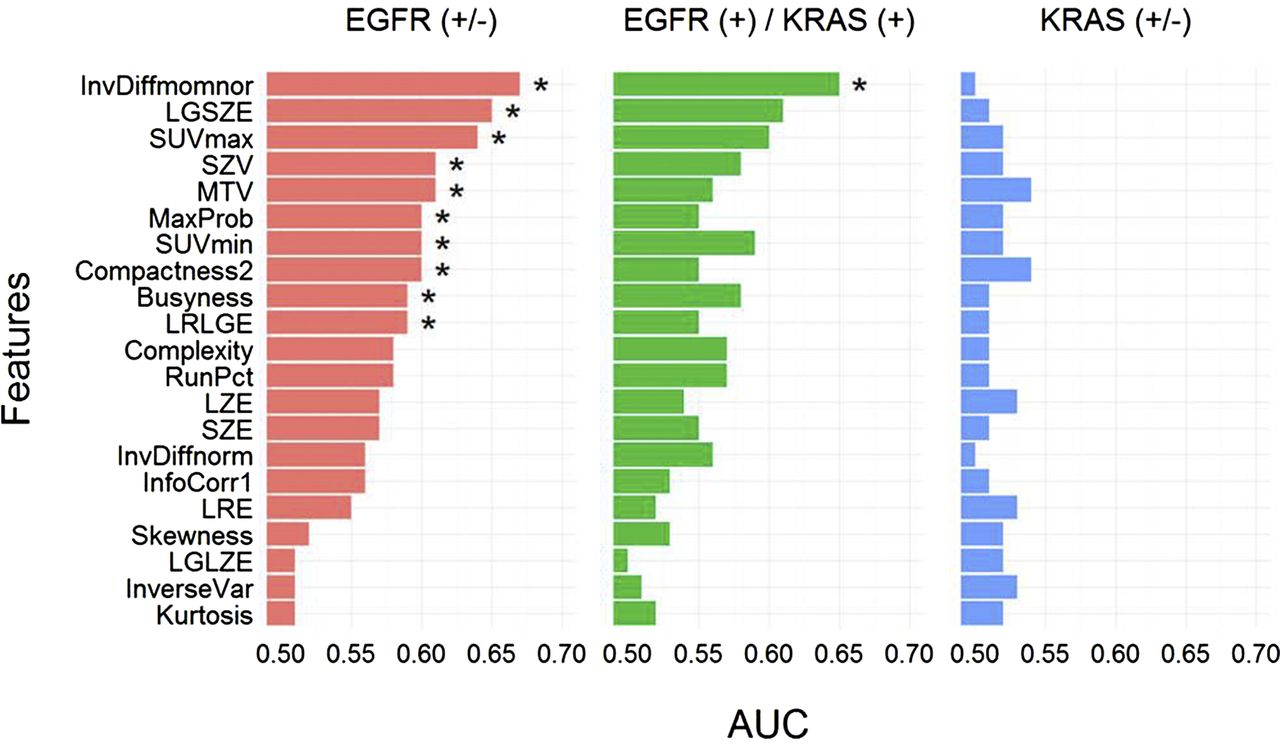
The 21 PET features were evaluated for their ability to predict mutation status and were assessed by the AUC. Eight radiomic features (compactness, SUVmin, MaxProb, InvDiffmomnor, long run low gray emphasis, size zone variability, low gray size zone emphasis, and busyness) and both conventional features (MTV, SUVmax) were predictive of EGFR mutation status, with AUCs ranging from 0.59 to 0.67 (FDRNoether = 0.0032–0.09) (Fig. 3). The radiomic feature InvDiffmomnor (AUC = 0.67, FDRNoether = 0.0032) had the highest AUC for discriminating EGFR+ from EGFR–, and long run low gray emphasis (FDRNoether = 0.06) and busyness (FDRNoether = 0.09) had AUCs of 0.59. Five radiomic features, including compactness, MaxProb, InvDiffmomnor, size-zone-variability, and low gray size zone emphasis, were able to significantly discriminate EGFR+ from the EGFR-KRAS WT (AUC = 0.61–0.67, FDRNoether = 0.003–0.04) (Supplemental Fig. 4). In addition, conventional features MTV and SUVmax were significantly predictive of EGFR+ and WT differentiation (AUC = 0.62–0.64, FDRNoether = 0.01–0.02). InvDiffmomnor outperformed all other measures in EGFR mutation prediction.

AUC. * indicates that AUC is significantly > 0.50 (random guessing) assessed with Noether test (FDRNoether ≤ 0.10). Many of the features significantly predict EGFR+ tumors; however, they are not able to predict KRAS+ tumors. LGSZE = low gray small zone emphasis; LGLZE = low gray large zone emphasis; LRE = long run emphasis; LRLGE = long run low gray emphasis; LZE = large zone emphasis; RunPct = run percentage; SZE = small zone emphasis; SZV = size zone variability.
Only 1 radiomic feature, InvDiffmomnor (AUC = 0.65, FDRNoether = 0.05), was able to significantly differentiate EGFR+ from KRAS+ (Fig. 3). In particular, none of the conventional PET features was able to differentiate EGFR+ from KRAS+ (AUC = 0.56–0.60, FDRNoether ≥ 0.29). All other features had AUCs ranging from 0.50 to 0.61 (FDRNoether ≥ 0.29) for EGFR+ and KRAS+ discrimination. None of the features was significantly predictive of KRAS mutation status (KRAS+ vs. KRAS–, AUC < 0.55, FDRNoether ≥ 0.92) (Fig. 3) or discriminating KRAS+ from WT (AUC = 0.50–0.57, FDRNoether ≥ 0.65) (Supplemental Fig. 4).
The predictive performances of the significant radiomic features and conventional features for mutation status were compared directly to assess the value of radiomics over conventional features. The radiomic feature InvDiffmomnor significantly outperformed the conventional feature MTV in differentiating EGFR+ from EGFR– (P = 0.02) but did not significantly outperform the conventional feature SUVmax (P = 0.14).
In patients with only adenocarcinoma histology, InvDiffmomnor (AUC = 0.66, FDRNoether = 0.01) was observed to outperform all other features (AUC ≤ 0.64, FDRNoether ≥ 0.03) in differentiating EGFR+ from EGFR– (Supplemental Fig. 5), as observed with the full cohort. Adenocarcinoma EGFR mutants had a significantly higher SUVmax than WTs (FDRWilcoxon = 0.06).
DISCUSSION
Identifying mutation status in NSCLC patients is an important component of selecting an optimal treatment plan for the patient. Clinically, a patient’s mutation status is identified using molecular testing based on pathologic examination of tumor tissues; however, these data may not always be readily available for all patients. We hypothesized that the genotype of tumors may be reflected in the phenotype that is captured in medical images. PET imaging is commonly used in the clinic for cancer management and can provide a noninvasive depiction of the tumor metabolic phenotype. We investigated the association between somatic mutations and 19 novel PET radiomic features and 2 conventional features (MTV and SUVmax) in 348 NSCLC patients. We observed that radiomic features are strongly associated with EGFR mutation status and could significantly discriminate EGFR+ from EGFR– and EGFR+ from KRAS+.
We found that EGFR mutants demonstrated distinctive imaging features compared with tumors without an EGFR mutation. For example, the metabolic region of EGFR+ tumors was smaller and had a lower SUVmax than EGFR– tumors. Because of their low SUV uptake and smaller MTV, our results are consistent with the notion that EGFR mutants tend to be more indolent than other lung cancer types (39,40). In addition, 8 radiomic features were significantly associated with and predictive of EGFR mutation status, where InvDiffmomnor was the most predictive for EGFR mutation status and significantly outperformed the conventional measure MTV (P ≤ 0.02). Furthermore, InvDiffmomnor was also found to outperform all other PET-based features in predicting EGFR mutations in patients with adenocarcinoma histology and was also predictive for differentiating EGFR+ from KRAS+ (Supplemental Fig. 5). However, only 5 features were shown to significantly discriminate EGFR+ from WT (Supplemental Figs. 3 and 4). This may be due to the fact that only 31 patients were tested only for EGFR mutations, but not KRAS mutations, because of a lack of medical necessity. Seventy-four percent (23/31) of these patients were EGFR–, whereas their KRAS mutation status was unknown. As it was unclear if those 23 patients were also KRAS–, they were excluded from the EGFR+ and WT differentiation analysis, which may explain why SUVmin, busyness, and long run low gray emphasis could significantly differentiate EGFR+ from EGFR–, but not EGFR+ from WT.
Our results showed that a lower SUVmax was associated with EGFR+ tumors. Previous studies have also shown a substantial association between SUVmax and EGFR mutation status in NSCLC patients, where lower SUVmax was associated with EGFR+ (18,20,41); however, there have been conflicting conclusions with other studies. Conversely, studies by Huang et al. (21) and Lee et al. (42) identified that higher SUV measures, such as SUVmax, were a strong predictor of EGFR+ tumors. In other studies, Lee et al. (43) and Chung et al. (44) found that none of their PET features (e.g., SUVmax, MTV, and total glycolysis lesion) was significantly associated with or predicted EGFR mutation status.
The differences observed in these aforementioned studies may be attributed to the patient demographics for each study. Our study contained the largest patient cohort (348 patients) compared with the other studies (206 patients in Lee et al. (43), 106 patients in Chung et al. (44), 77 patients in Huang et al. (21), and 214 patients in Lee et al. (42)). Furthermore, the previous studies were from Asian institutions whereas our study was from a North American cohort, which resulted in more than 90% of our patients being Caucasian (Table 1). Another study that had a predominantly Caucasian cohort was reported by Mak et al. (18), who reported that a lower SUVmax was associated with EGFR mutants, which is consistent with our current study.
The frequency of EGFR mutations has been found to be substantially higher in Asian countries than Western countries (45). Therefore, the effect of ethnicity is reflected in the frequency of EGFR+ mutations in each cohort, where the previous studies had a higher percentage of EGFR+ mutants than in our study (23% in the cohort of Lee et al. (43), 40% in Chung et al. (44), 64% in Huang et al. (21), and 24% in Lee et al. (42) vs. only 13% in our study). However, despite the differences between each study, it is clear that the conclusions on using conventional PET-based features for prediction of mutation status remain debatable. The limitation of conventional PET features may be that they do not adequately quantify the tumor phenotype that reflects mutation status. Using a radiomics approach with greater descriptive power to quantify the tumor phenotype, we found that not only were many radiomic features predictive of EGFR mutation status, they also could be better predictors than conventional PET features. Although this was an initial exploratory study to demonstrate that radiomics could be applied for mutation status prediction using PET images, these findings need to be further investigated in multiple large datasets acquired from different countries.
None of the conventional or radiomic features was associated with or predictive of KRAS mutation status (KRAS+ vs. KRAS−). We found that KRAS+ tumors tended to be bigger and had greater values in SUV measures than EGFR+ tumors, suggesting that KRAS+ tumors may be more aggressive (Figs. 1 and 2). Only 1 radiomic feature (InvDiffmomnor) could significantly discriminate KRAS+ from EGFR+, whereas other features, including conventional features, were unable to.
Other groups have also investigated the ability of conventional PET features to identify KRAS mutation status. Caicedo et al. (19) investigated whether SUV measures, including maximum, peak, and average SUV, could predict EGFR and KRAS mutation status in 102 patients with NSCLC. Unlike our results, they found that KRAS+ tumors had significantly higher values in SUV measures than both EGFR mutants and KRAS-EGFR WTs. One reason for this difference between our study and their study may be because a proportion of the KRAS– tumors in our study were also EGFR+ (36/221 [16%] KRAS– tumors were EGFR mutants). In our analysis of KRAS+ and WT, we found that all the features performed poorly in prediction for the KRAS mutation. Moreover, we also found that the feature distributions between KRAS+ and KRAS– were not significantly different for any of the PET features. However, these differences may also be attributed to the different cohort size because we investigated the association between PET imaging features and mutation status in 348 tumors, whereas the study by Caicedo et al. (19) investigated 102 tumors.
There are several limitations of our study. First, because of the retrospective nature of the study, the imaging protocols were not standardized for all the patients, resulting in different acquisition and reconstruction parameters (Table 1). Although these differences may lead to variability in quantification of SUV (46–48), the distributions of scanners used for PET/CT image acquisition were similar for all patient groups (Table 1). Second, partial-volume effects resulting from limited PET spatial resolution may lead to an underestimation of the metabolic tumor region and SUV measures (49). Furthermore, because of insufficient data acquisition and limited reconstruction techniques, respiratory motion can induce image blurring in the static (3-dimensional PET) image acquisition, subsequently affecting the quantification of the PET features (50). Despite these limitations, many radiomic features were still found to be significantly associated with and predictive of EGFR mutation status. Whether PET standardization, correction of partial-volume effects, and the use of respiratory-gated PET/CT imaging can improve the value of PET features in mutation identification needs to be further investigated. Although this study focused on the use of radiomic features extracted from the untreated primary tumors for mutation prediction, in the future, it would be interesting to also investigate the predictive value of features extracted from metastatic lesions.
CONCLUSION
Tumor metabolic phenotypes that are driven by EGFR mutations could be quantified by radiomic features. Several radiomic features were strongly associated with the EGFR mutation status; in particular, InvDiffmomnor outperformed all other PET features (radiomic and conventional) in EGFR mutation prediction (EGFR+ vs. EGFR− and EGFR+ vs. KRAS+). All PET features were poorly associated with KRAS mutations, potentially indicating that tumors of KRAS mutants demonstrated weak distinctive imaging features.
Radiomic features extracted from diagnostic PET images have potential for identifying EGFR mutations in NSCLC. Our study may help develop an imaging biomarker to noninvasively identify EGFR mutation status using PET imaging to complement, but not to replace, molecular testing. Prospective studies with masked mutation status and independent datasets will be needed to further validate the predictive power of the radiomic features. Furthermore, future studies will need to investigate how the EGFR mutation gives rise to certain phenotypic traits that are quantified by radiomic features.
DISCLOSURE
We acknowledge support from the National Institutes of Health (award nos. U01CA190234 and U24CA194354) and research seed funding grant from the American Association of Physicists in Medicine. No other potential conflict of interest relevant to this article was reported.
Acknowledgments
We thank the PROFILE team for their help with somatic mutation testing.
Footnotes
↵* Contributed equally to this work.
Published online Sep. 29, 2016.
- © 2017 by the Society of Nuclear Medicine and Molecular Imaging.
REFERENCES
- Received for publication July 27, 2016.
- Accepted for publication September 3, 2016.


Jump to section
Related Articles
Cited By...
- Performance and Robustness of Machine Learning-based Radiomic COVID-19 Severity Prediction
- Evolutionary dynamics at the tumor edge reveal metabolic imaging biomarkers
- Radiomics Analysis of Clinical Myocardial Perfusion Stress SPECT Images to Identify Coronary Artery Calcification
- Introduction to Radiomics
- Metabolic Biomarker-Based BRAFV600 Mutation Association and Prediction in Melanoma
- Identifying relationships between imaging phenotypes and lung cancer-related mutation status: EGFR and KRAS
- A Postreconstruction Harmonization Method for Multicenter Radiomic Studies in PET
- Somatic Mutations Drive Distinct Imaging Phenotypes in Lung Cancer