


Abstract
Radiomics is a rapidly evolving field of research concerned with the extraction of quantitative metrics—the so-called radiomic features—within medical images. Radiomic features capture tissue and lesion characteristics such as heterogeneity and shape and may, alone or in combination with demographic, histologic, genomic, or proteomic data, be used for clinical problem solving. The goal of this continuing education article is to provide an introduction to the field, covering the basic radiomics workflow: feature calculation and selection, dimensionality reduction, and data processing. Potential clinical applications in nuclear medicine that include PET radiomics-based prediction of treatment response and survival will be discussed. Current limitations of radiomics, such as sensitivity to acquisition parameter variations, and common pitfalls will also be covered.
Radiomics is a heavily discussed topic in nuclear medicine and in medical imaging in general. Although the term is not strictly defined, radiomics generally aims to extract quantitative, and ideally reproducible, information from diagnostic images, including complex patterns that are difficult to recognize or quantify by the human eye (1,2). There are several scenarios in which radiomic features extracted from metabolic imaging techniques such as PET and SPECT may be useful.
First, radiomics may be used to capture tissue and lesion properties such as shape and heterogeneity and, on serial imaging, their changes over time, such as during treatment or surveillance. In oncology, assessment of tissue heterogeneity is of particular interest: genomic analyses have demonstrated that the degree of tumor heterogeneity is a prognostic determinant of survival and an obstacle to cancer control (3–6). Studies have suggested that radiomic features are strongly correlated with heterogeneity indices at the cellular level (7,8). While biopsies capture heterogeneity within only a small portion of a tumor and usually at just a single anatomic site, radiomics captures heterogeneity across the entire tumor volume. Unsurprisingly, radiomic features are therefore also associated with tumor aggressiveness (9). Radiomic features have also been suggested to predict clinical endpoints such as survival and treatment response and to be directly linked to genomic, transcriptomic, or proteomic characteristics (1,2,9). Although even individual radiomic features may correlate with genomic data or clinical outcomes, the impact of radiomics is increased when the wealth of information that it provides—typically hundreds of features, a fraction of which will contribute to a disease-specific radiomic signature—is processed using machine learning techniques (10,11).
Second, radiomic data are mineable, meaning that in sufficiently large datasets, they may be used to discover previously unknown markers and patterns of disease evolution, progression, and treatment response. This so-called population-imaging approach (12) either may use unstructured data from different modalities (e.g., PET, CT, and MRI) acquired for a specific but possibly unrelated diagnostic purpose in broadly defined groups or may use—as in the German National MRI Cohort Study—a single imaging test in a large cohort for a multicentric longitudinal observational study (13). Such radiomic data can be combined with clinical, laboratory, histologic, genomic, or other data, using unsupervised machine learning.
Since a major obstacle for radiomics research is the lack of communication between physicians and computer scientists—in particular, lack of a common language—this article aims to introduce physicians to the technical radiomics terminology. We elected not to include mathematic equations but to use words in combination with illustrations to highlight key concepts. Like any other technique, radiomics has technical limitations—including susceptibility toward image acquisition and reconstruction parameters—and pitfalls, which will also be discussed. Finally, we will discuss examples of current radiomics applications in nuclear medicine.
RADIOMIC FEATURE CLASSES
Knowledge of the different types of radiomic features is not mandatory for reading research papers on radiomics or even for performing radiomics studies. However, familiarity with core principles may facilitate interpretation of results and preselection of features for specific applications. The below overview includes only the most frequently encountered radiomic feature classes. For a more complete listing of radiomic features and underlying equations, we recommend the recently published Image Biomarker Standardization Initiative white paper (14).
Radiomic features can be roughly subdivided into statistical, including histogram-based and texture-based; model-based; transform-based; and shape-based (15). Although radiomic features can be extracted from 2-dimensional (2D) regions of interest (ROIs) or 3-dimensional (3D) volumes of interest, we chose ROI as an umbrella term for both to improve readability. Also, statistical features can be calculated for unmodified, or discretized, gray-level intensities. Neither gray-level discretization (in which the range of gray levels is reduced to a predefined number to improve robustness and reproducibility) nor feature value aggregation (used to obtain a single value when the same feature is calculated in different variations, in its simplest form by arithmetic means) is covered, as this would exceed the scope of this article.
Histogram Features
The simplest statistical descriptors are based on the global gray-level histogram and include gray-level mean, maximum, minimum, variance, and percentiles (14,15). Because these features are based on single-pixel or single-voxel analyses, they are called first-order features. For PET, the commonly used SUVmax, SUVmean, and SUVpeak fall into this category. More sophisticated features include skewness and kurtosis, which describe the shape of the intensity distribution of data: skewness reflects the asymmetry of the data distribution curve to the left (negative skew, below the mean) or right (positive skew, above the mean), whereas kurtosis reflects the tailedness of a data distribution relative to a gaussian distribution due to outliers. Other features include histogram entropy and uniformity (also called energy). Notably, these differ from their cooccurrence matrix counterparts of the same name.
Texture Features
Absolute Gradient
A simple approach to true radiomic texture description is the analysis of the absolute gradient, which reflects the degree or abruptness of gray-level intensity fluctuations across an image. For 2 adjacent pixels or voxels, the gradient is highest if one is black and the other one white, whereas if both pixels are black (or both are white) the gradient at that localization is zero. Whether the gray level increases from black to white (positive gradient) or decreases from white to black (negative gradient) is irrelevant for the gradient magnitude. Similar to histogram features, gradient features include gradient mean, variance, skewness, and kurtosis (Fig. 1) (14,15).
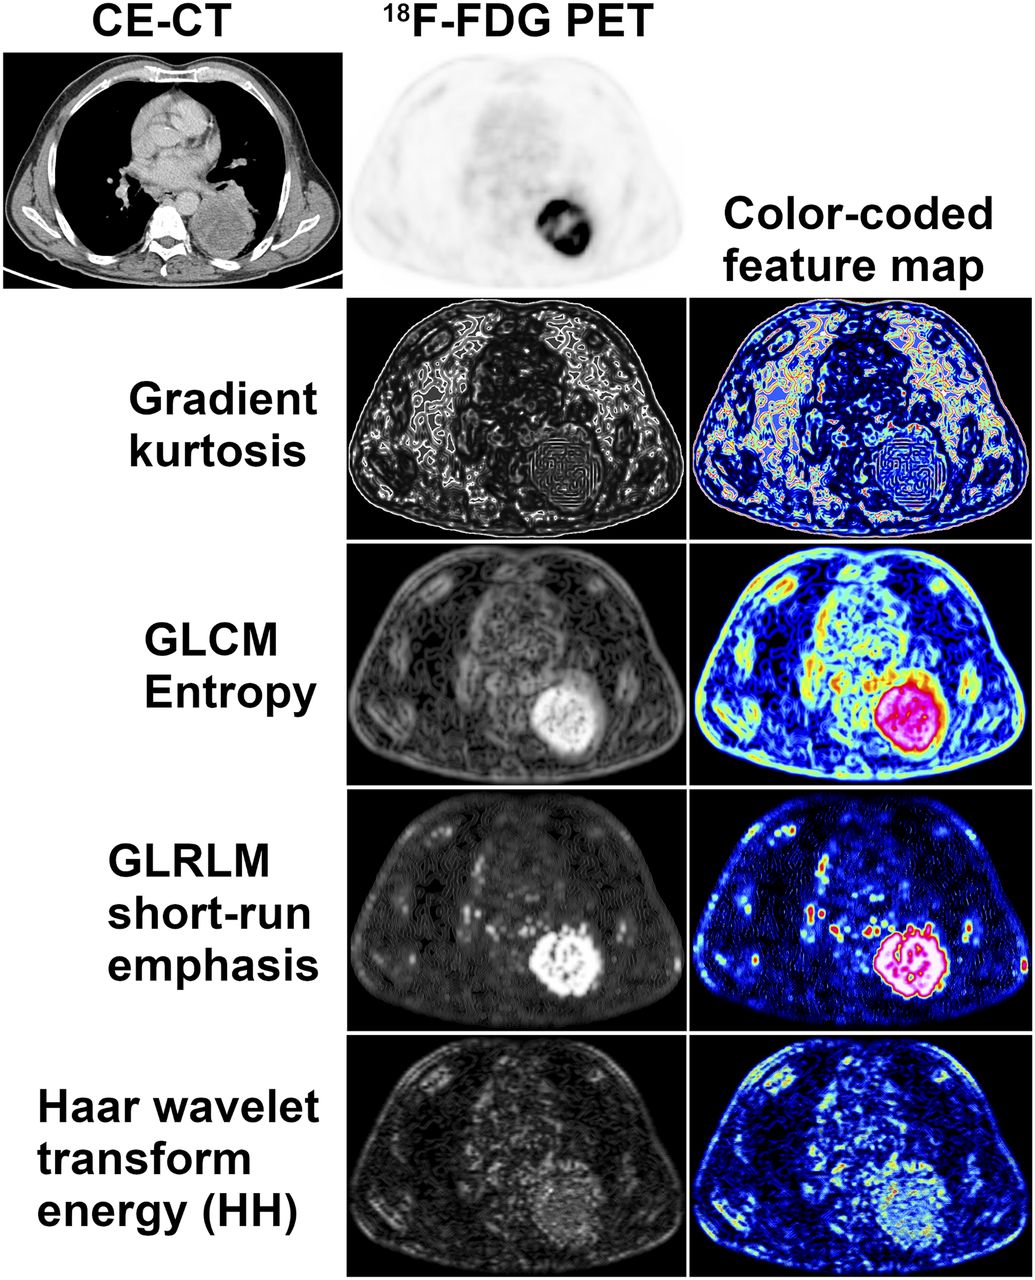
Visual representation of radiomic features: 18F-FDG PET and contrast-enhanced CT images of partly necrotic lung cancer of left lower lobe. Radiomic feature maps generated by moving small rectangular window over PET image, and calculating feature value for each position, reflect different aspects of glucose metabolism heterogeneity across tumor. Each feature map depicts a single radiomic feature, with high values corresponding to high signal intensities on gray-level feature map. Color-coded feature maps may be used for better visualization and as color overlay for CT. CE = contrast-enhanced; HH = high–high, or high-pass filtering in both directions.
Gray-Level Cooccurrence Matrix (GLCM)
First described by Haralick et al. (16), the GLCM is a second-order gray-level histogram. GLCM captures spatial relationships of pairs of pixels or voxels with predefined gray-level intensities, in different directions (horizontal, vertical, or diagonal for a 2D analysis or 13 directions for a 3D analysis), and with a predefined distance between the pixels or voxels (Fig. 2). GLCM features include entropy (Fig. 2), a measure of gray-level inhomogeneity or randomness; angular second moment (also called uniformity or energy), which reflects gray-level homogeneity or order; and contrast, which emphasizes gray-level differences between pixels or voxels belonging to a pixel or voxel pair (14–16).

Calculation of radiomic texture features. Whereas GLCM relies on pixel pairs (here, interpixel distance = 0), GLRLM relies on runs, and GLSZM relies on areas of neighboring pixels with same gray-level.
Gray-Level Run-length Matrix (GLRLM)
The GLRLM, described by Galloway (17), provides information about the spatial distribution of runs of consecutive pixels with the same gray level, in one or more directions, in 2 or 3 dimensions. GLRLM features include fraction, which assesses the percentage of pixels or voxels within the ROI that are part of the runs and therefore reflects graininess; long- and short-run emphasis (inverse) moments (Fig. 1), which are weighted toward the presence of numbers of long and short runs, respectively; and gray-level and run-length nonuniformity, which assesses the distribution of runs over different gray levels and run lengths, respectively (14,15,17).
Gray-Level Size Zone Matrix (GLSZM) and Gray-Level Distance Zone Matrix (GLDZM)
Described by Thibault et al. (18), the GLSZM is based on a similar principle to the GLRLM, but here, counts of the number of groups (so-called zones) of interconnected neighboring pixels or voxels with the same gray level form the basis for the matrix (Fig. 2). A more homogeneous texture will result in a wider and flatter matrix. GLSZM is not computed for different directions but may be computed for different pixel or voxel distances that define the neighborhood. GLSZM features may be calculated in 2 dimensions (8 neighboring pixels) or 3 dimensions (26 neighboring voxels) and, following GLRLM definitions, include fraction (percentage of pixels or voxels that are part of the zones), large- and small-zone emphasis, and others (14,18).
As a variation of GLSZM, GLDZM not only assesses zones of interconnected neighboring pixels or voxels with the same gray level but requires them to be at the same distance from the ROI edge. GLDZM features are therefore “hybrids” between texture features and morphologic features, as is also reflected by some self-explanatory GLDZM feature names, such as small-distance high–gray-level emphasis (18).
Neighborhood Gray-Tone Difference Matrix (NGTDM)
Proposed by Amadasun and King (19), the NGTDM quantifies the sum of differences between the gray level of a pixel or voxel and the mean gray level of its neighboring pixels or voxels within a predefined distance. Key features include NGTDM coarseness, busyness, and complexity. Coarseness reflects the gray-level difference between the central pixel or voxel and its neighborhood and thus captures the spatial rate of changes in gray-level intensities; that is, an ROI consisting of larger areas with relatively uniform gray levels (i.e., a lower rate of spatial intensity changes) will have a high coarseness value. Busyness, on the other hand, reflects rapid gray-level changes between the central pixel or voxel and its neighbors (i.e., a high spatial frequency of intensity changes), so that an ROI comprising many small areas with markedly different gray levels will have greater busyness.
Neighborhood Gray-Level Dependence Matrix (NGLDM)
Described by Sun and Wee (20), the NGLDM is also based on the gray-level relationship between a central pixel or voxel and its neighborhood. Here, a neighboring pixel or voxel within a predefined distance is regarded as being connected to the central pixel or voxel if it meets the dependence criterion in terms of a defined range of gray-level differences. The ROI is then analyzed for the presence of central pixels or voxels with intensity i- and j-dependent neighboring pixels or voxels. Again, similar to GLRLM, NGLDM features include a large dependence emphasis and a small dependence emphasis that reflect heterogeneity and homogeneity, as well as gray-level nonuniformity and dependence uniformity that reflect the similarity in gray levels and in gray-level dependencies throughout an ROI, respectively (14,20).
Model-Based Features
Model-based analyses aim to interpret spatial gray-level information to characterize objects or shapes. A parameterized model of texture generation is calculated and fitted to the ROI, and its estimated parameters are used as radiomic features (15). The autoregressive model is an example of a model-based approach and is based on the idea that the gray level of a pixel is a weighted sum of the gray levels of 4 neighboring pixels: the pixel to its left (θ-1), top left (θ-2), top (θ-3), and top right (θ-4). In addition, σ, which carries information about the variance of the minimum prediction error, measures texture regularity (15).
Fractal analysis also yields features that can be used for radiomics, in particular fractal dimension, which reflects the rate of addition of structural detail with increasing magnification, scale, or resolution and therefore serves as a measure of complexity. Lacunarity, a feature measuring the lack of rotational or translational invariance, reflects inhomogeneity (21).
Transform-Based Features
Transform-based methods, including Fourier, Gabor, and Haar wavelet transforms, analyze gray-level patterns in a different space. The discrete Haar wavelet transform, for instance, analyzes the frequency content of an image at different scales (15). Wavelet decomposition of an image is possible by applying a pair of so-called quadrature mirror filters, a high-pass and a low-pass filter (22). Although the high-pass filter highlights the changes in gray level and thus emphasizes image details, the low-pass filter smooths the image in terms of gray level, removing image details. After signal decomposition, a set of spatially oriented frequency channels is available, which is used to describe local image variability. The energies within the frequency channels are then used as features. High-pass filtering in both directions (Fig. 1) captures diagonal details, high-pass filtering followed by low-pass filtering captures vertical edges, low-pass filtering followed by high-pass filtering captures horizontal edges, and low-pass filtering in both directions captures the lowest frequencies, at different scales (15). Notably, wavelet transformation can be used not only for generation of radiomic features but also for image segmentation or as a preprocessing step to texture analysis.
Shape-Based Features
Shape-based features describe geometric properties of ROIs. Many shape-based features are conceptually much simpler than other radiomic features, such as 2D and 3D diameters, axes, and their ratios. Surface- and volume-based approaches founded on the use of meshes (i.e., small polygons such as triangles and tetrahedrons) are more complex. Features include compactness and sphericity, which describe how the shape of an ROI differs from that of a circle (for 2D analyses) or a sphere (for 3D analyses), and density, which relies on the construction of a minimum oriented bounding box (or rectangle for 2D analyses) enclosing the ROI (14).
ACQUISITION PARAMETERS AND FEATURE STANDARDIZATION
Image-derived metrics such as SUVs and radiomic features are sensitive to image acquisition settings, reconstruction algorithms, and image processing. Recently, Zwanenburg (23) performed a metaanalysis on 42 PET radiomics studies to evaluate feature robustness, reproducibility, and standardization; 21 were eligible for quantitative evaluation. Different aspects of data heterogeneity—caused by variations in acquisition parameters (e.g., scan duration, numbers of iterations and subsets, reconstruction type and algorithm, and spatial resolution) and image processing methods (segmentation method and gray-level discretization)—were investigated. Spatial resolution had the strongest effect, with a coefficient of variation (CV) of 3.63, followed by scan duration (CV, 2.93), segmentation method (CV, 2.92), reconstruction method (CV, 2.30), gaussian filter width for postreconstruction smoothing (CV, 2.23), number of iterations (CV, 1.81), and number of subsets (CV, 1.08). Segmentation also had a considerable effect (CV, 2.92) (23).
van Velden et al. (24) reported that repeatability was comparable to that of simple SUV measures for most radiomic features (60% having good reproducibility) and that features were more sensitive to delineation or segmentation than to the reconstruction method. Other studies also found radiomics repeatability similar to SUV repeatability (25) and a high sensitivity to image discretization (26). Lasnon et al. (27) found that ordered-subset expectation maximization (OSEM) with point-spread function modeling and postfiltering produced SUV and texture information comparable to that from plain OSEM, but unfiltered point-spread function images showed higher heterogeneity (potentially more discriminative in stratifying patients). Papp et al. (28) compared the sensitivities of the individual PET radiomic feature classes to variations in spatial resolution and reconstruction algorithms, using sphere-based phantoms. To minimize feature variations, they recommended small voxels, narrow gaussian postfiltering, and, like Lasnon et al., the use of point-spread function modeling. Bin size had a small effect on radiomic features according to Yan et al. (29), but number of iterations, postprocessing filter width, and voxel size affected many of them (3, 8, and 35 of 61 features showed >20% CV). Galavis et al. (30) concluded that 80% of investigated texture features displayed large variability (>30%) as a result of varying acquisition and reconstruction parameters (2D or 3D OSEM algorithm, number of iterations, postprocessing filter width, and voxel size). Pfaehler et al. (31) indicated that PET images reconstructed with point-spread function had increased repeatability compared with images reconstructed with a standard OSEM or time-of-flight algorithm.
Since spatial resolution appears to have a particularly strong effect on radiomic features, resampling of multicentric imaging data is a common strategy to ameliorate the effects of differences in resolution between scanners. Whybra et al. (32) investigated the robustness of PET/CT radiomic texture and shape features to trilinear and spline interpolation for resampling to isotropic voxel sizes. They reported that about two thirds of the 141 radiomic features tested were robust to both resampling techniques, and another 21% were potentially correctable. However, absolute differences between the 2 interpolation techniques were, in part, considerable, and thus, a single interpolation technique should be used consistently.
Recently, deep learning for PET reconstruction was proposed, either for postprocessing of conventionally reconstructed images (33) or for use within an iterative reconstruction framework (34) or for direct mapping of PET data into images (35). These methods have been able to restore or reconstruct PET images of higher quality than is possible with conventional OSEM, making images less noisy without sacrificing resolution. Since noise (controlled by, for example, counting statistics and number of iterations) heavily influences calculated features, deep learning may possibly lead to more robust radiomic features.
FEATURE HARMONIZATION, SELECTION, AND REDUCTION
Feature Harmonization
Harmonization is a mathematic postprocessing technique to remove the so-called batch effect (i.e., center-dependent effects of acquisition parameter variations) on radiomic features after image acquisition, reconstruction, and analysis. Harmonization is thus applied not to images but directly to numeric radiomic feature values. The currently most popular technique is ComBat harmonization, which was originally described for use with genomic data and has meanwhile been validated for removing the center effect from radiomic features while preserving pathophysiologic information (36). Several studies have applied this technique to PET radiomics (37,38).
Feature Selection and Dimensionality Reduction
Once radiomic image analysis has been completed, the relevant features that will be used in the statistical model to solve the clinical problem (e.g., to distinguish between benign and malignant lesions) must be identified.
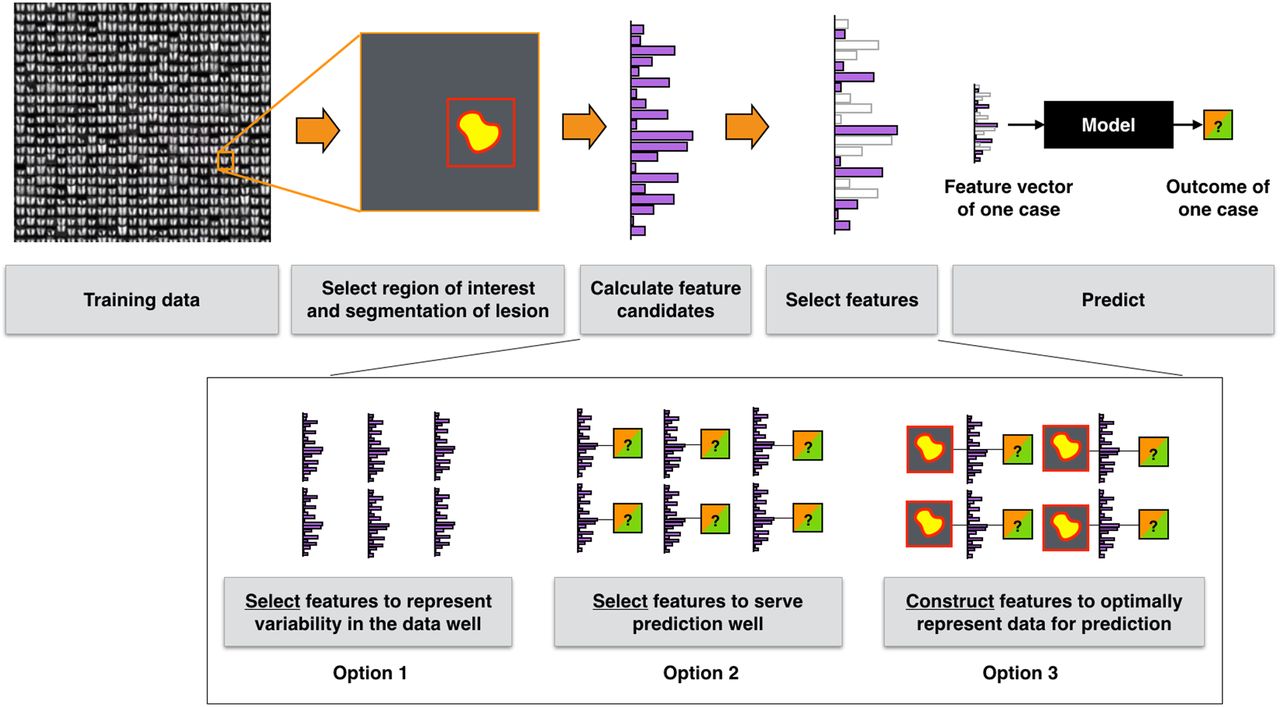
Although, theoretically, the hundreds of radiomic feature candidates that are typically extracted (Fig. 3) could be used as input to the prediction model, the number of required model parameters would then grow exponentially. Therefore, a large number of feature candidates must be removed or transformed. This process is called dimensionality reduction. Radiomic features frequently show high correlations indicating data redundancy, meaning that some features can be discarded and others grouped and replaced with a representative feature, such as through using principal-component or linear discriminant analysis. Among such representative features, informative features showing the highest natural biologic range (i.e., interpatient variability) are preferable (39). Fourteen approaches to radiomic feature selection were compared by Parmar et al. (40), including mutual information–based methods and 12 machine learning classifiers; a similar approach was also used by Leger et al. (41), who focused on time-to-event survival data. Extensive systems for selecting radiomic features for prediction of tumor treatment outcome from PET images were developed by Lian et al. (42).

Radiomics workflow. First, ROI is defined or lesions are segmented. For ROIs or lesions, frequently a large number of feature candidates are extracted. Features that either represent variability in data most efficiently or serve a particular prediction model best are selected. Instead of selecting from predefined set of features, deep learning approaches link feature construction and modeling directly to further improve prediction accuracy and reliability.
Dimensionality reduction techniques that lessen redundancy without exploiting knowledge about target variables (e.g., benign or malignant), such as principal-component analysis, are popular but typically mix variables and complicate subsequent tracing of predictors in the initial radiomic feature set. Once prediction targets are considered during feature selection, care has to be taken to avoid so-called overfitting, leading to overoptimistic estimates of predictive accuracies. If the number of features is high enough, correlations can be detected even in random data.
MODEL CONSTRUCTION AND CLASSIFICATION
After the radiomic features have been selected, they are used to predict target variables in the present, such as the absence or presence of a disease or tumor type, or variables in the future, such as treatment response or time to recurrence.
The target can either be scalar (e.g., survival in months), as would be predicted by a regression model, or categoric (e.g., response status or receptor positivity), as would be predicted by a classification model (Fig. 3) (43). Machine learning, a subfield of artificial intelligence, has undergone rapid development during the last 2 decades. Machine learning models learn the relationship between high-dimension inputs—radiomic features—and target variables based on training examples. A key capacity is the exploitation of groups of predictors or features taken together, so-called multivariate patterns as opposed to univariate or mass-univariate regression. Support vector machines were one of the first highly successful models, suffering only from the need for careful feature selection (44). Bagging and boosting methods, such as random forests, introduced the training of robust classifiers or regressors by integrating feature selection and effective sampling in the training process (45). This ability is at the core of many current radiomics approaches that select features on the basis of their predictive contribution. These approaches have fostered extremely successful applications in various fields ranging from automotive (pedestrian recognition) to genetics (identifying associations), by shifting the focus from expert-based feature selection to directly letting the classifier evaluate feature candidates and identify those with predictive value (46). More recently, neural networks have resurged as powerful classification and feature construction models. Given sufficient training data, convolutional neural networks outperform feature selection schemes, because instead of selecting features from predefined and finite sets of feature candidates, optimal features are constructed from the image data themselves (47). One limitation is the need for excessive training data. This limitation has recently successfully been tackled by strategies such as transfer learning, exploiting the similarity of visual features across problem domains.
Goodness of fit on the test set is a valid measure of how well the approximation function predicts the output of the target function. For categoric variables, false-positives, false-negatives, or derived measures reflect the relevant information. Since many of the approaches have parameters, receiver-operator-characteristic curves are used to represent prediction accuracy over a parameter range. Cross-validation schemes, in which training and test sets are rotated through the available data, can alleviate limited dataset sizes but have to be used with caution. Once the algorithm design and its parameters are informed substantially by intermediate cross-validation, the ability to provide independent test results is lost. Here, having a holdout set of data that are touched only after algorithm finalization during a final validation is the best practice. Further information about machine learning can be found in a recent article by Uribe et al. (11).
PITFALLS AND QUALITY CONTROL
There are several caveats when conducting radiomics research, some of which were briefly mentioned above. These include the need for high-quality, artifact-free images, preferably obtained with homogeneous image acquisition protocols and reconstruction techniques, or the use of appropriate correction before or after radiomic analysis when such image quality cannot be achieved (e.g., in multicentric retrospective studies); adequate size and completeness of datasets; and separate training and validation datasets. Apart from these prerequisites for meaningful radiomics research, there are two pitfalls that frequently affect radiomics studies: class imbalances and overfitting.
Class Imbalances
Outside randomized clinical trials, class imbalances are common. Especially in retrospective studies using routine clinical data, it is seldom that the condition of interest has the same prevalence within a cohort as does lack of this condition. For instance, in patients with diffuse large B-cell lymphoma, bone marrow involvement is found in approximately 16% of patients. When evaluating the performance of 18F-FDG PET radiomics for detection of bone marrow involvement, this imbalance in the percentage of patients with (16%) and without (84%) marrow involvement must be considered. A classifier that assigns all cases in the sample to the no-marrow-involvement group would have a seemingly decent accuracy of 84% but would be clinically useless because it would be unable to distinguish between involved and uninvolved bone marrow on PET images (Supplemental Table 1; supplemental materials are available at http://jnm.snmjournals.org). Therefore, not only overall accuracy but also classwise accuracy, or sensitivity or specificity, should be reported.
Overfitting and Underfitting
If a model is not sufficiently well balanced in terms of function approximation, one may encounter overfitting or, to a lesser degree, underfitting. Overfitting occurs when a model with a large number of input parameters or too many degrees of freedom can memorize data, so that not just the relevant, disease-specific, features but also features reflecting image noise and random fluctuations are included in the model (Supplemental Fig. 1). Such a model gives correct classification results at the data points provided to it during training, but its response is wrong for points outside the training dataset—the model is unable to generalize information. To avoid overfitting, regularization needs to be applied to smooth the model function, or the number of input features needs to be reduced, which decreases the number of required model parameters. Validation using a separate dataset helps in detecting overfitting: if the error decreases in the training dataset but starts to increase in the validation dataset, the training needs to be stopped. Underfitting, on the other hand, occurs when a model is incapable of classifying data correctly in both the training and the validation datasets, such as when the model is overly simplistic. Here, additional input data or a switch to a different model may be necessary.
Radiomics Score
Lambin et al. (48) developed a modality-independent radiomics quality score based on 16 criteria that carry different weights; a maximum of 36 points can be achieved. Although the use of standardized image acquisition protocols according to published recommendations is among these criteria, it has, with one point, just a minor impact; software-based correction or harmonization techniques for multicentric data are not explicitly mentioned, possibly because of the publication date; instead, the use of a phantom to assess variations in radiomic feature values is endorsed. Having 7 points, use of a prospective design and trial registration is given particular weight, and having up to 5 points, use of a validation dataset is also weighty. At 3 points, the use of feature reduction techniques to reduce the risk of overfitting is also a relevant criterion. Notably, at 2 points each, assessment of the added value of the radiomics approach in comparison to the current gold standard (e.g., radiomics vs. image-based TNM stage), as well as clinical relevance and utility, are important factors. The score also recommends combination of radiomic with clinical, molecular, and genomic data (48).
CLINICAL APPLICATIONS
Compared with the multitude of studies using traditional PET metrics for outcome prognostication or tissue characterization, applications of texture, shape, or histogram features are still rare in the literature. In this section, we will review selected articles to highlight promising clinical applications and discuss their limitations.
Radiogenomics: Linking Imaging Data to Biology
Radiogenomics in non–small cell lung cancer has attracted particular interest. Nair et al. (49) investigated the association of quantitative 18F-FDG PET/CT–based metabolic tumor volume and histogram features with genomic data in non–small cell lung cancer patients. Fourteen radiomic features and 3 principal components were correlated with gene expression for single genes and coexpressed gene clusters in a training dataset of 25 patients who underwent PET/CT before tumor resection. Four genes (LY6E, RNF149, MCM6, and FAP) were correlated with radiomic features and survival. Unusual for a radiomics study, the test and validation cohorts confirming these associations were much larger (63 and 84 patients) than the training cohort. Yip et al. (50) investigated associations between the 18F-FDG PET/CT radiomic features of 348 non–small cell lung cancer patients (histogram, GLCM, GLRLM, GRSZM, NGTDM, and shape) and epidermal growth factor receptor or Kristen rat sarcoma viral (KRAS) mutations. Although 8 texture features (and also SUV and metabolic tumor volume) were significantly associated with epidermal growth factor receptor mutation status, and 1 GLCM feature was even predictive of a positive epidermal growth factor receptor mutation status, no feature was associated with KRAS mutation. The study was limited by lack of a validation cohort and by use of PET/CT data from 8 different scanners; although voxel intensities were resampled, voxel size was not.
18F-FET PET radiomics were used by Pyka et al. (51) to differentiate between tumor grades in 113 high-grade glioma patients. A single PET/CT device was used, eliminating the need for resampling or harmonization. Four NGTDM features enabled differentiation between tumor grades III and IV; further improvement was achieved through combination with metabolic tumor volume. Notably, no validation set was used. 18F-FET PET radiomics was retrospectively evaluated by Lohmann et al. (52) for prediction of isocitrate dehydrogenase mutation, a diagnostic marker not routinely obtained preoperatively. Fifty-six of 84 patients were examined on a stand-alone PET scanner, and the remaining 28 patients were examined on a PET/MRI device—that is, practically all acquisition parameters (including resolution and reconstruction algorithm) differed between the 2 subgroups. Thirty-three features (histogram, GLCM, GLRLM, GLSZM, and shape) were extracted, and 26 of 84 patients showed isocitrate dehydrogenase mutation. To avoid overfitting, the number of relevant features was therefore reduced to 2, and 5- and 10-fold cross-validation was applied. Accuracies of up to 81%, but quite low sensitivities, were achieved, probably because of a combination of class imbalance and acquisition parameter heterogeneity.
In an experimental setup, Rajkumar et al. (53) tested whether GLCM features extracted from 125I-A5B7 anticarcinoembryonic antigen antibody nano-SPECT could be used to differentiate between metastatic colorectal cancer phenotypes. In 14 mice with hepatic colorectal cancer metastases, the authors found that undifferentiated metastases were clearly more heterogeneous than well-differentiated lesions, as reflected by 3 SPECT texture features, which also captured antivascular therapy effects.
Clinical Outcome Prediction
Early assessment of response to treatment and prediction of survival are of interest to clinicians because such an ability may aid treatment selection and patient stratification and justify a therapy switch. In 358 stage I–III non–small cell lung cancer patients, Arshad et al. (54) used pretherapeutic 18F-FDG data from 7 institutions to evaluate 18F-FDG PET radiomics for overall survival prediction after radiotherapy or chemoradiotherapy. Histogram, shape, and texture features (GLCM, GLRLM, and NGTDM, extracted from original and wavelet-transformed images) were calculated in addition to traditional PET metrics, and dimensionality reduction was performed by least absolute shrinkage and selection operator (LASSO) regression in combination with weighted linear feature combination. No correction for acquisition parameter variations was applied. In total, 133 datasets were used for training, and there were 204 patients for internal validation and 21 patients for external testing. The combined radiomic feature vector correctly predicted a 14-mo survival difference in the validation cohort and lack of a survival difference in the testing cohort.
Peng et al. (55) evaluated a pretreatment 18F-FDG PET/CT–based radiomics signature and nomogram to predict disease-free survival in patients with stage III–IVa nasopharyngeal carcinoma, using images obtained with a single scanner type and a fixed acquisition protocol, to predict disease-free survival. The training dataset consisted of 470 patients, and the validation set had 237 patients. Radiomic features were chosen manually (including histogram, shape, GLCM, and GLRLM features) and then also automatically by deep learning convolutional neural networks. LASSO Cox regression analyses were used to reduce feature dimensionality. The radiomics nomogram proved superior to nomograms based on clinical data and plasma EBV DNA (an established prognostic biomarker in nasopharyngeal carcinoma). The radiomics nomogram enabled patient stratification into 2 risk groups that differed in 5-y disease-free survival; only the radiomics high-risk group showed a benefit from induction chemotherapy in addition to standard chemoradiotherapy. Interestingly, no combination between radiomic features and other data (such as DNA) was evaluated. Such a strategy was, however, evaluated in a similar study by Lv et al. (56) in 128 patients with nasopharyngeal carcinoma; there, the combination of radiomic and clinical data slightly improved prediction of progression-free survival.
Finally, in a study of 214 gastric cancer patients, Jiang et al. (57) investigated the utility of 18F-FDG PET radiomic features (histogram, shape, GLCM, GLRLM, GLSZM, and NGTDM) for disease-free survival and overall survival prediction. In that study, the training cohort (132 patients) was examined with a single scanner, and the validation cohort (82 patients) was examined with a different scanner from a different vendor, providing true external validation. Although voxel size and other acquisition parameters differed between the 2 cohorts, the radiomics score was built on features selected through LASSO regression and was a better predictor of overall survival and disease-free survival than TNM stage or the tumor marker CA 19-9. Again, no CT radiomic features or clinical or laboratory data were included in the radiomics prediction model.
CONCLUSION
Radiomics is a sophisticated image analysis technique with the potential to establish itself in precision medicine. Radiomic features not only correlate with genomic data but also may provide complementary information about tumor heterogeneity across the entire tumor volume to improve survival prediction, therefore potentially proving useful for patient stratification. For nuclear medicine, with its long tradition of providing quantitative biologic data, radiomics could represent the next logical step in its evolution, not just as a clinical decision-making tool but also as a research tool to discover novel molecular disease pathways. However, development of, and strict adherence to, standardized image acquisition and reconstruction protocols are vital.
Footnotes
Published online Feb. 14, 2020.
Learning Objectives: On successful completion of this activity, participants should be able to (1) describe the standard radiomics workflow; (2) know the basic concepts of radiomic feature classes; and (3) recognize common limitations and pitfalls in radiomics studies.
Financial Disclosure: Dr. Mayerhoefer has received speaker honoraria and research support from Siemens Healthineers and speaker honoraria from Bristol-Myers Squibb. Dr. Langs is an employee and shareholder of contextflow GmbH. The authors of this article have indicated no other relevant relationships that could be perceived as a real or apparent conflict of interest.
CME Credit: SNMMI is accredited by the Accreditation Council for Continuing Medical Education (ACCME) to sponsor continuing education for physicians. SNMMI designates each JNM continuing education article for a maximum of 2.0 AMA PRA Category 1 Credits. Physicians should claim only credit commensurate with the extent of their participation in the activity. For CE credit, SAM, and other credit types, participants can access this activity through the SNMMI website (http://www.snmmilearningcenter.org) through April 2023.
- © 2020 by the Society of Nuclear Medicine and Molecular Imaging.
REFERENCES
- Received for publication August 22, 2019.
- Accepted for publication January 28, 2020.


Jump to section
Related Articles
Cited By...
- Radiomics for Growth Prediction of Vestibular Schwannomas in Neurofibromatosis Type 2
- Quantitative Susceptibility Mapping Radiomics with Label Noise Compensation for Predicting Deep Brain Stimulation Outcomes in Parkinsons Disease
- Radiomics-based functional outcome prediction in acute single subcortical infarction
- Cancer radiomic feature variations due to reconstruction kernel choice and integral tube current
- Is PET Radiomics Useful to Predict Pathologic Tumor Response and Prognosis in Locally Advanced Cervical Cancer?
- Multi-region Multiomic Random Forest Toxicity Modeling of Radiation Pneumonitis
- Impact of 18F-FDG PET Intensity Normalization on Radiomic Features of Oropharyngeal Squamous Cell Carcinomas and Machine Learning-Generated Biomarkers
- Diagnostic Value of Multiparameter MRI-Based Radiomics in Pediatric Myelin Oligodendrocyte Glycoprotein Antibody-Associated Disorders
- Radiomics in Spine Surgery
- Impact of ComBat Harmonization on PET Radiomics-Based Tissue Classification: A Dual-Center PET/MRI and PET/CT Study
- Using angiographic parametric imaging-derived radiomics features to predict complications and embolization outcomes of intracranial aneurysms treated by pipeline embolization devices
- Machine Learning in Nuclear Medicine: Part 2--Neural Networks and Clinical Aspects