


Abstract
Several reports have shown that radiomic features are affected by acquisition and reconstruction parameters, thus hampering multicenter studies. We propose a method that, by removing the center effect while preserving patient-specific effects, standardizes features measured from PET images obtained using different imaging protocols. Methods: Pretreatment 18F-FDG PET images of patients with breast cancer were included. In one nuclear medicine department (department A), 63 patients were scanned on a time-of-flight PET/CT scanner, and 16 lesions were triple-negative (TN). In another nuclear medicine department (department B), 74 patients underwent PET/CT on a different brand of scanner and a different reconstruction protocol, and 15 lesions were TN. The images from department A were smoothed using a gaussian filter to mimic data from a third department (department A-S). The primary lesion was segmented to obtain a lesion volume of interest (VOI), and a spheric VOI was set in healthy liver tissue. Three SUVs and 6 textural features were computed in all VOIs. A harmonization method initially described for genomic data was used to estimate the department effect based on the observed feature values. Feature distributions in each department were compared before and after harmonization. Results: In healthy liver tissue, the distributions significantly differed for 4 of 9 features between departments A and B and for 6 of 9 between departments A and A-S (P < 0.05, Wilcoxon test). After harmonization, none of the 9 feature distributions significantly differed between 2 departments (P > 0.1). The same trend was observed in lesions, with a realignment of feature distributions between the departments after harmonization. Identification of TN lesions was largely enhanced after harmonization when the cutoffs were determined on data from one department and applied to data from the other department. Conclusion: The proposed harmonization method is efficient at removing the multicenter effect for textural features and SUVs. The method is easy to use, retains biologic variations not related to a center effect, and does not require any feature recalculation. Such harmonization allows for multicenter studies and for external validation of radiomic models or cutoffs and should facilitate the use of radiomic models in clinical practice.
The number of publications involving texture analysis or radiomic studies in medical imaging in general, and in PET in particular, is growing rapidly (1,2). Several authors have published promising PET results suggesting that quantification of lesion heterogeneity using radiomic features can predict patient outcome or treatment response (3–6). Yet, in a recent study, Chalkidou et al. (7) pointed out an inappropriate control of type I error in many radiomic studies that involved the calculation of a large number of imaging features in a small number of patients. These authors underlined the need to confirm observations and validate models using independent patient cohorts in multicenter settings. Since the first publication including texture analysis in PET images in 2009 (8), 77% of the radiomic or texture studies in PET have included fewer than 100 patients (Fig. 1), and only 3 studies involved more than 200 patients (9–11). The difficulty in including a large number of patients lies mostly in the need for a clinically homogeneous cohort with respect to lesion types, stages, treatments, and imaging protocols. Indeed, it has been shown that radiomic features are sensitive to acquisition and reconstruction parameters (12,13), thus hindering the pooling of data acquired using different scanners or protocols. More precisely, radiomic features are sensitive to the reconstruction algorithm, number of iterations or subsets, scan duration per bed position, postreconstruction filter, and voxel size (12–22). This variability of radiomic features implies that a radiomic model established using data from a given PET scanner might not be directly applicable to data from another PET scanner, as recently demonstrated in cervical cancer by Reuzé et al. (23). This is obviously a severe limitation for the dissemination of radiomic models and their transfer to clinical practice.

Number of patients involved in texture or radiomic studies from PET images since 2009, as found in a PubMed search for “(radiomics OR texture OR textural) AND PET.”
About 10 years ago, the genomics field faced a similar problem called the batch effect, with batch referring to the settings used to acquire the data, hence being identical to the scanner effect or imaging-protocol effect in radiomics. In genomics, the batch effect is a technical source of variations caused by the handling of samples (e.g., different laboratories, different technicians, different days), potentially masking individual variations, whereas the identification of robust gene signatures to predict disease outcome requires thousands of samples (24). Among the methods developed to deal with the batch effect, ComBat harmonization was described in 2007 (25). This method is now widely used in genomics and has an advantage over other methods in that it provides satisfactory results even for small datasets with a limited number of features (26).
In this context, the purpose of this study was to determine whether the harmonization method initially described for genomic data analysis could successfully normalize radiomic features as measured in PET so as to remove the center effect while retaining the pathophysiologic information, in order to facilitate multicenter studies and exportation of a radiomic model to different centers.
MATERIALS AND METHODS
Patients
Two groups of patients with nonmetastatic breast cancer, with a total of 137 lesions, were included in this study. The first cohort included 63 patients treated at Avicenne Hospital, Bobigny, France (department A). The second cohort consisted of 74 patients scanned at Institut Curie-René Huguenin Hospital, Saint-Cloud, France (department B). This study was approved by the local institutional review board (Ile-de-France X), and the requirement to obtain informed consent was waived. A core-needle biopsy was performed for all patients to determine the lesion type (27). The characteristics of each patient group are summarized in Table 1.
Patient Characteristics for Departments A and B
PET/CT Imaging Protocol
Each 18F-FDG PET/CT scan was performed before the start of therapy. For each patient, the capillary blood glucose level was less than 8 mmol/L at the time of 18F-FDG injection.
In department A, 18F-FDG PET/CT images were acquired using a Gemini TF scanner (Philips) at 78 ± 9 min (mean ± SD; range, 59–108 min) after injection of 18F-FDG (3 MBq/kg) at a rate of 1.45 min per bed position. PET images were reconstructed using a list-mode iterative algorithm (blob ordered-subsets time-of-flight, 2 iterations, 33 subsets). Attenuation was corrected using CT images, and no postreconstruction smoothing was used. The voxel size of the reconstructed PET images was 4 × 4 × 4 mm.
In department B, 18F-FDG PET/CT images were acquired using a Discovery 690 scanner (GE Healthcare) at 74 ± 8 min (range, 55–99 min) after injection of 18F-FDG (3–3.5 MBq/kg) at a rate of 2.5 min per bed position. PET images were reconstructed using an ordered-subset expectation maximization iterative algorithm (2 iterations, 24 subsets) and gaussian postfiltering (6 mm in full width at half maximum). Attenuation was corrected using CT images. The voxel size of the reconstructed PET images was 2.7 × 2.7 × 3.3 mm.
Last, we smoothed the PET images from department A using a 3-dimensional gaussian filter (σ = 4 mm) to mimic a third department (department A-S).
All PET images were converted into SUVs using standardization by patient body weight.
Radiomic Feature Measurements
For each patient, 2 volumes of interest (VOIs) were delineated. First, we segmented the primary lesion using a fixed threshold of 40% of its SUVmax. Second, we located a spheric VOI of about 23 cm3 in healthy liver tissue.
For each VOI, 9 features were measured using LIFEx software (www.lifexsoft.org), including SUVmax, SUVmean in the VOI, and SUVpeak (maximum average SUV in a 1-cm3 sphere). For textural feature calculation, voxel intensities were resampled using 64 discrete values between 0 and 20 SUV units, corresponding to an absolute resampling with a bin width of about 0.3 SUV (28). Six textural features previously selected for their robustness with respect to the segmentation method in each texture correlation group (29) were calculated: homogeneity and entropy from the cooccurrence matrix, short-run emphasis and long-run emphasis from the gray-level run length matrix, and high–gray-level zone emphasis and low–gray-level zone emphasis from the gray-level zone length matrix. The method of calculating textural features was previously described in detail (29).
Harmonization Method
To pool SUV and textural features measured from different PET protocols, we tested a harmonization method, ComBat, previously described for genomic studies by Johnson et al. (25) to correct the batch effect. The harmonization model assumes that the value of each feature y measured in VOI j and scanner i can be written as follows: Eq. 1
Eq. 1
where α is the average value for feature y; X is a design matrix for the covariates of interest; β is the vector of regression coefficients corresponding to each covariate; γi is the additive effect of scanner i on features, supposed to follow a normal distribution; δi is the multiplicative scanner effect, supposed to follow an inverse gamma-distribution; and εij is an error term (normally distributed with a zero mean), as explained by Fortin et al. (30). Harmonization consists of estimating γi and δi using empiric Bayes estimates (denoted as γi* and δi*) as described previously (25). The same model can be used in its nonparametric form in which no assumptions are made regarding the laws followed by γi, δi, and εij. The normalized value of feature y for VOI j and scanner i is then obtained as follows: Eq. 2
Eq. 2
where  and
and  are estimators of parameters α and β, respectively. The harmonization determines a transformation for each feature separately, based on the batch (here, department) effect observed on feature values. In the first part of this study, we used harmonization without accounting for any biologic covariate (i.e., X = 0), and in the second part, we used TN status as the covariate of interest.
For each tissue separately (lesion and liver tissues), we applied harmonization on all features using the R function called ComBat, available at https://github.com/Jfortin1/ComBatHarmonization/, using the non-parametric settings.
Statistical Analysis
To test the ability of the harmonization method to remove the center effect from the feature values, we plotted the probability density function of all features in the liver VOI as a function of the department, before and after harmonization. We used Wilcoxon tests to determine whether the features differed significantly between departments, with P values of less than 0.05 considered statistically significant.
For the lesion VOI, we displayed the box plots of all features as a function of lesion type—TN or non-TN—for each department separately, before and after harmonization. Wilcoxon tests were used to investigate the impact of harmonization on the features in the TN and non-TN groups in each department.
To study the usefulness of harmonization in multicenter studies, we determined the cutoff for each feature as that maximizing the Youden index, defined as (sensitivity + specificity – 1), in separating TN from non-TN groups using data from department A. We then used these cutoffs to determine whether lesions from department B were TN or non-TN, and we assessed the accuracy of this classification without and with harmonization. The accuracy of the TN classification was also measured using the Youden index.
Finally, we investigated the impact of setting a covariate of interest by removing the TN lesions from department A to obtain 2 datasets with different biologic compositions: department A without TN and department B including 20% of TN. We studied how TN lesions in department B were distinguished from non-TN lesions in department A using Wilcoxon tests before and after harmonization, without and with TN status as a covariate of interest.
RESULTS
Liver Tissue
The plots of features in liver tissue show a shift in distribution among the 3 departments (Fig. 2; Supplemental Fig. 1 [supplemental materials are available at http://jnm.snmjournals.org]). For instance, homogeneity in the liver VOI was lower in department A than in department B or A-S (Fig. 2A). Conversely, SUVmax was higher in department A than in B, which was higher than in A-S (Fig. 2C). Homogeneity, entropy, short-run emphasis, and long-run emphasis differed significantly between departments A and B and between departments A and A-S (P < 0.05; Table 2) when the features were not harmonized. High–gray-level zone emphasis and SUVmax also differed significantly between departments A and A-S.
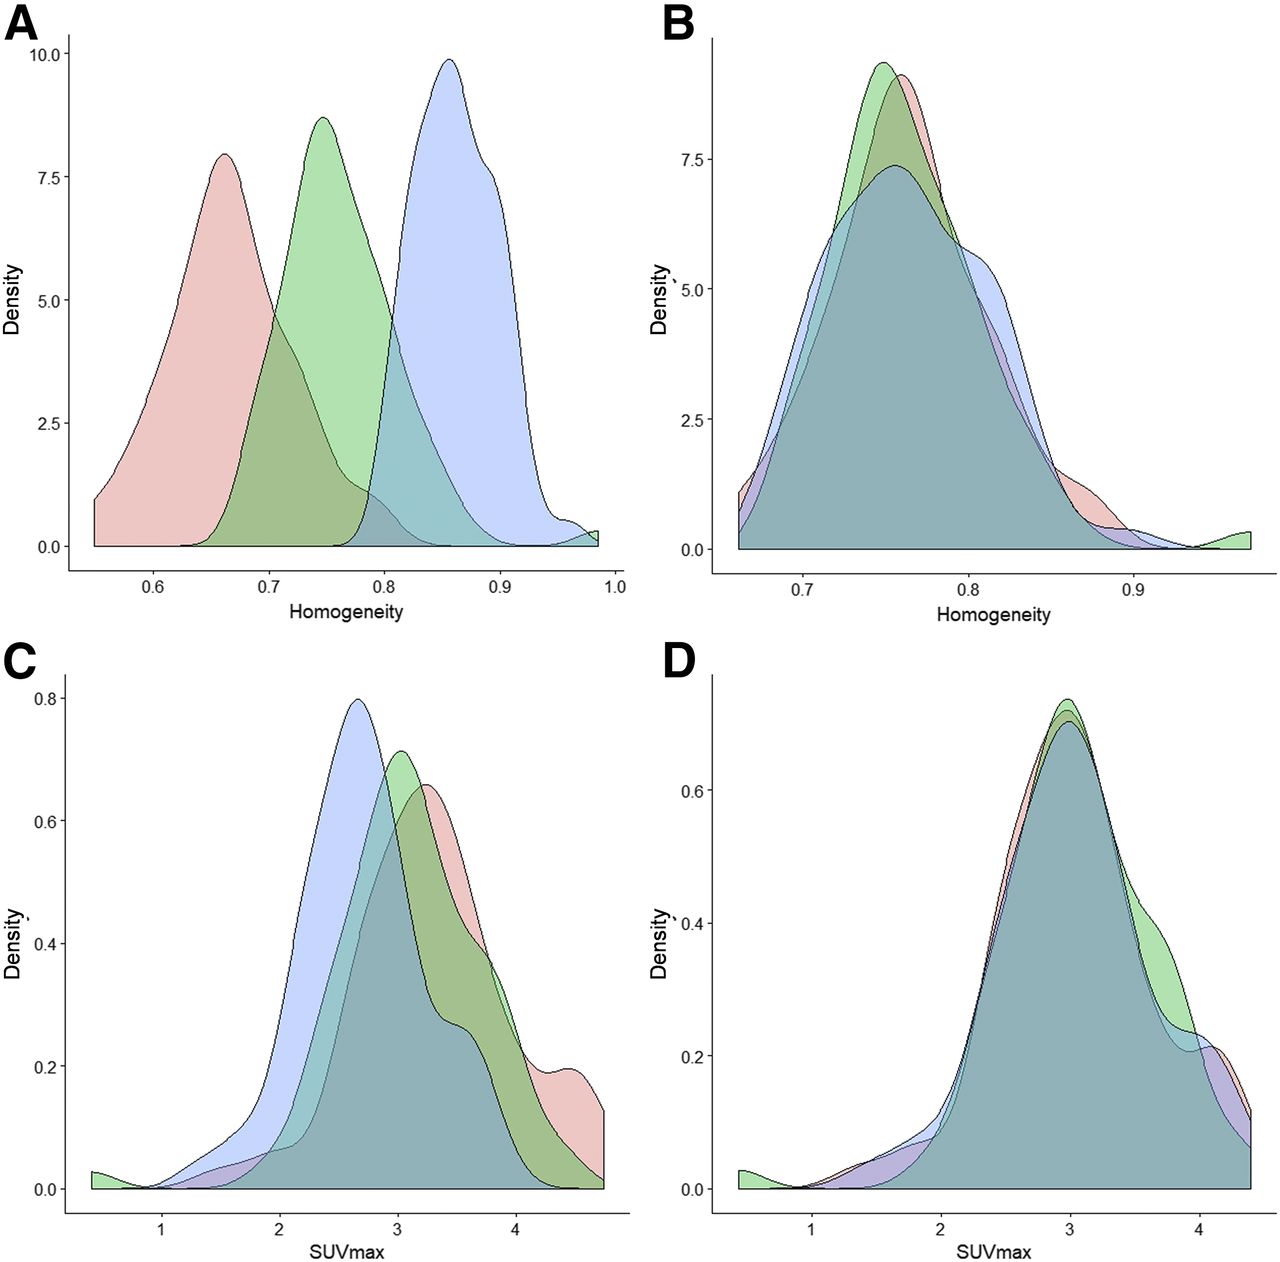
Probability density function (%) of homogeneity (A and B) and SUVmax (C and D) in liver tissue as observed in departments A (pink), B (green), and A-S (blue), before (left) and after (right) harmonization.
P Values of Wilcoxon Tests Between Feature Values in Departments A and B and in Departments A and A-S Before and After Harmonization
After harmonization, the distributions overlapped better for all features (Fig. 2; Supplemental Fig. 1), and no feature differed significantly between 2 departments (P > 0.1; Table 2).
Lesion Tissue
In our cohorts, 16 of 63 lesions (25%) were TN in departments A and A-S, and 15 of 74 lesions (20%) were TN in department B (Table 1). The mean lesion volume was 28.1 ± 39.1 cm3 (range: 4.8–229.1 cm3) in departments A and A-S and 12.3 ± 13.0 cm3 (range: 2.0–77.3 cm3) in department B (P < 0.05).
Figure 3 and Supplemental Figure 2 show that, in each department separately, uptake heterogeneity was higher in TN than non-TN lesions, with lower values for homogeneity, long-run emphasis, and low–gray-level zone emphasis and higher values for entropy, short-run emphasis, high–gray-level zone emphasis, and SUV.
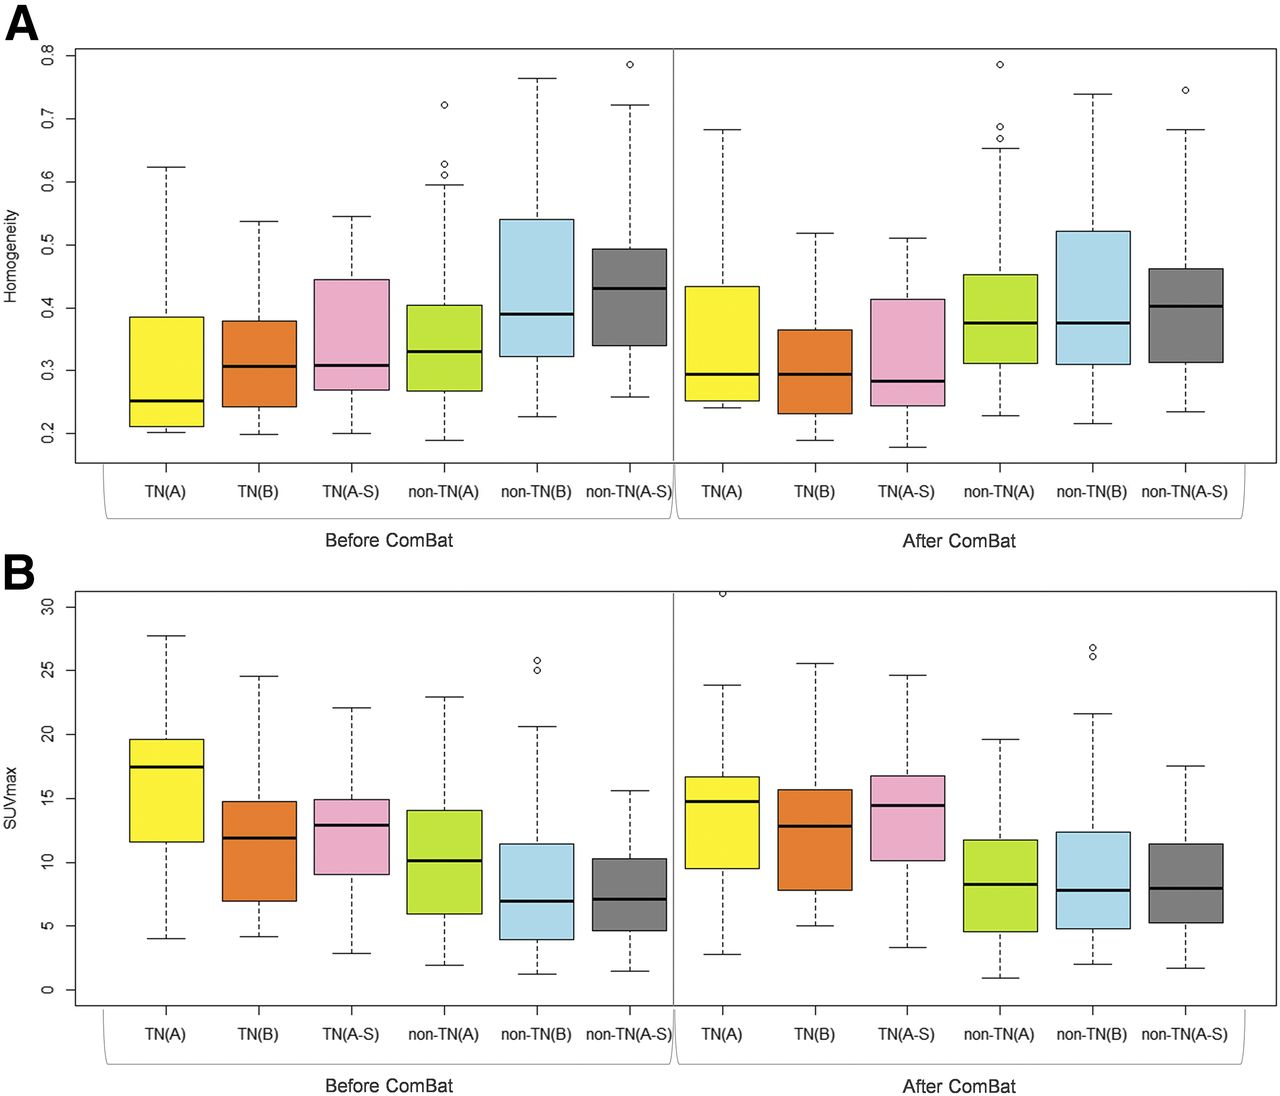
Box plots of homogeneity (A) and SUVmax (B) for TN and non-TN lesions before and after harmonization in 3 departments separately.
Before harmonization, we observed a shift between features for the lesion VOI among the 3 departments (Supplemental Fig. 2) with, for example, a lower homogeneity and a higher SUVmax in department A than in department B or A-S (Fig. 3; Supplemental Fig. 3). Table 3 shows that no feature could distinguish between non-TN lesions from department A and TN lesions from department B (P > 0.08). Five of 9 features did not significantly differ between non-TN lesions from department A and TN lesions from department A-S (Supplemental Table 1). All features differed significantly between the 2 types of lesions in each center separately, excepting short-run emphasis and long-run emphasis in departments A and A-S and homogeneity in department A.
P Values of Wilcoxon Tests Between Feature Values in TN and Non-TN Lesions in Departments A and B Before and After Harmonization
Figure 3 and Supplemental Figure 2 show that, after harmonization, there was a realignment of features among the 3 departments for TN and non-TN lesions. Table 3 shows that before harmonization, there was a significant difference between departments A and B for 4 of 9 features in TN lesions and 8 of 9 features in non-TN lesions. Supplemental Table 1 shows that before harmonization, 7 of 9 features in non-TN lesions differed significantly between departments A and A-S. After harmonization, the only feature (for either lesion type) that differed significantly between either A and B or A and A-S was long-run emphasis in TN lesions between A and B (Table 3; Supplemental Table 1; Supplemental Fig. 3). The P values for distinguishing between non-TN lesions in department A and TN lesions in department B or A-S were always lower with harmonization than without (Table 3; Supplemental Table 1).
To mimic a multicenter study, we determined for each feature a cutoff to distinguish between TN and non-TN lesions based on data from department A and then applied these cutoffs to data from department B. Table 4 shows that, before harmonization, all Youden indices were between 0.05 and 0.23, reflecting poor to moderate distinction between TN and non-TN lesions. After harmonization, the Youden indices for 8 of 9 features increased to between 0.20 and 0.36, significantly higher than before harmonization (P = 0.008). These Youden indices after harmonization were close to those obtained when the cutoff was directly based on data from department B (Table 4). For instance, with a department A–based cutoff, the Youden index for SUVpeak for department B was 0.05 before harmonization and increased to 0.36 after harmonization—similar to that (0.37) obtained with a department B–based cutoff.
Youden Indices for Distinction Between TN and Non-TN Lesions from Department B with Department A–Based Threshold and Department B–Based Threshold
Setting a Covariate of Interest
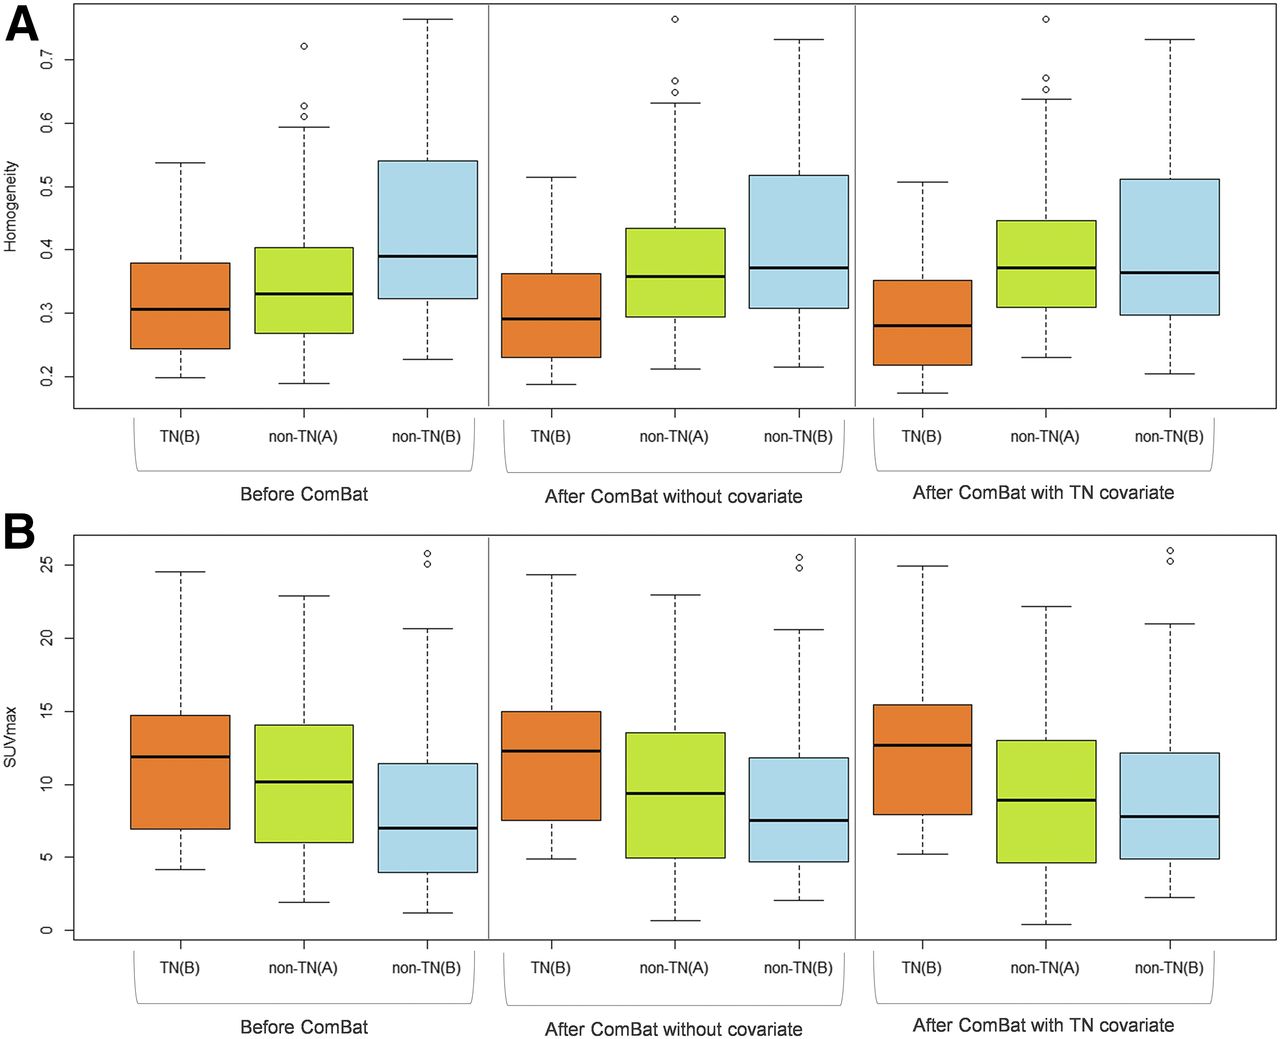
When we removed the TN lesions from department A and applied harmonization for departments A and B, the P values for distinguishing between TN lesions in department B and non-TN lesions in department A decreased for 8 of 9 features compared with P values obtained before harmonization (Fig. 4; Supplemental Fig. 4; Supplemental Table 2). The P values further decreased when the TN status was set as a covariate of interest in the harmonization; all features were then statistically significant for distinguishing between TN lesions in department B and non-TN lesions in department A (Supplemental Table 2).

Box plots of homogeneity (A) and SUVmax (B) for TN and non-TN lesions before and after harmonization without and with TN status as covariate, for departments A and B separately when all TN are removed from department A to determine transformations.
DISCUSSION
In this study, we demonstrated that it is possible to pool radiomic features and SUV measurements from different PET imaging protocols by applying a harmonization method, ComBat, initially used in genomics. The efficiency of the method was illustrated using measurements of healthy liver tissue and breast lesions on 18F-FDG PET images acquired in 2 different departments and with significantly different spatial resolutions (i.e., the same images acquired with and without gaussian smoothing of 9.4 mm in full width at half maximum). In addition, we found that with this method, a lesion-subtype–distinguishing cutoff established using data from one PET scanner is applicable to data from another PET scanner.
Among the methods developed to deal with the batch effect, the ComBat harmonization has already been used to normalize histopathologic images for cancer diagnosis (31) and cortical-thickness measurements from MR images (32). The method has several advantages. It is easily accessible, practical (thanks to an R function available for free), and fast. It is a department-specific harmonization that is based only on patient data acquired in the different departments, and it does not require any phantom experiment, making it suitable for retrospective data analysis. An additional advantage is that it applies directly to the radiomic features and not to the PET images from which those features are calculated. Therefore, it does not reduce the quality of an image set to match the lower quality of other sets. Without covariates of interest, affine transformations are used to harmonize the features. The transformations are different for each feature, each VOI type, and each department, so that the transformed data lie in a common space in which the department effects have been removed or at least reduced. Because the transformations are estimated and applied to the measured data themselves, the transformed data can be pooled afterward without the need for learning sets. The only constraint is that data from the different departments must be available so that the transformations can be identified. In the context of radiomic modeling, this implies that when a published predictive radiomic model is based on data from a certain department, that department must make available the radiomic feature values used to establish the model, as well as the model equations and coefficients, if the model is to be applicable to data from a different department.
Despite continuous and commendable efforts by the international community and societies to produce guidelines for harmonized imaging procedures (33–35), the acquisition and reconstruction protocols for PET images are not yet standardized. The method we propose offers a solution to performing multicenter studies even when data have been acquired under different conditions. ComBat harmonization is usable not only for radiomic textural features but also for SUV measurements. In our data, we observed that SUVmax distributions in the liver differed between departments A and B (P = 0.05) before harmonization but overlapped better after harmonization (Table 2; Fig. 2). Similarly, all SUV P values were greater than 0.2 between non-TN lesions from department A and TN lesions from department B (Table 3), meaning that SUV measurements failed to distinguish TN from non-TN lesions. After harmonization, SUV P values were less than 0.007 between non-TN lesions from department A and TN lesions from department B, close to the P values observed when distinguishing between TN and non-TN lesions in department A (P ≤ 0.006) and in department B (P ≤ 0.02). This harmonization method is therefore useful for SUVs in a multicenter investigation or for retrospective analysis of PET images acquired on different scanners at the same institution or on one scanner but with different acquisition and reconstruction parameters. Supplemental Figure 3 demonstrates how harmonization greatly reduced the differences in SUVs or feature values between departments A-S and A, although some differences remained for individual lesions. Residual differences after harmonization are also due to the strong smoothing in A-S data, which induces some information loss that obviously cannot be recovered using harmonization.
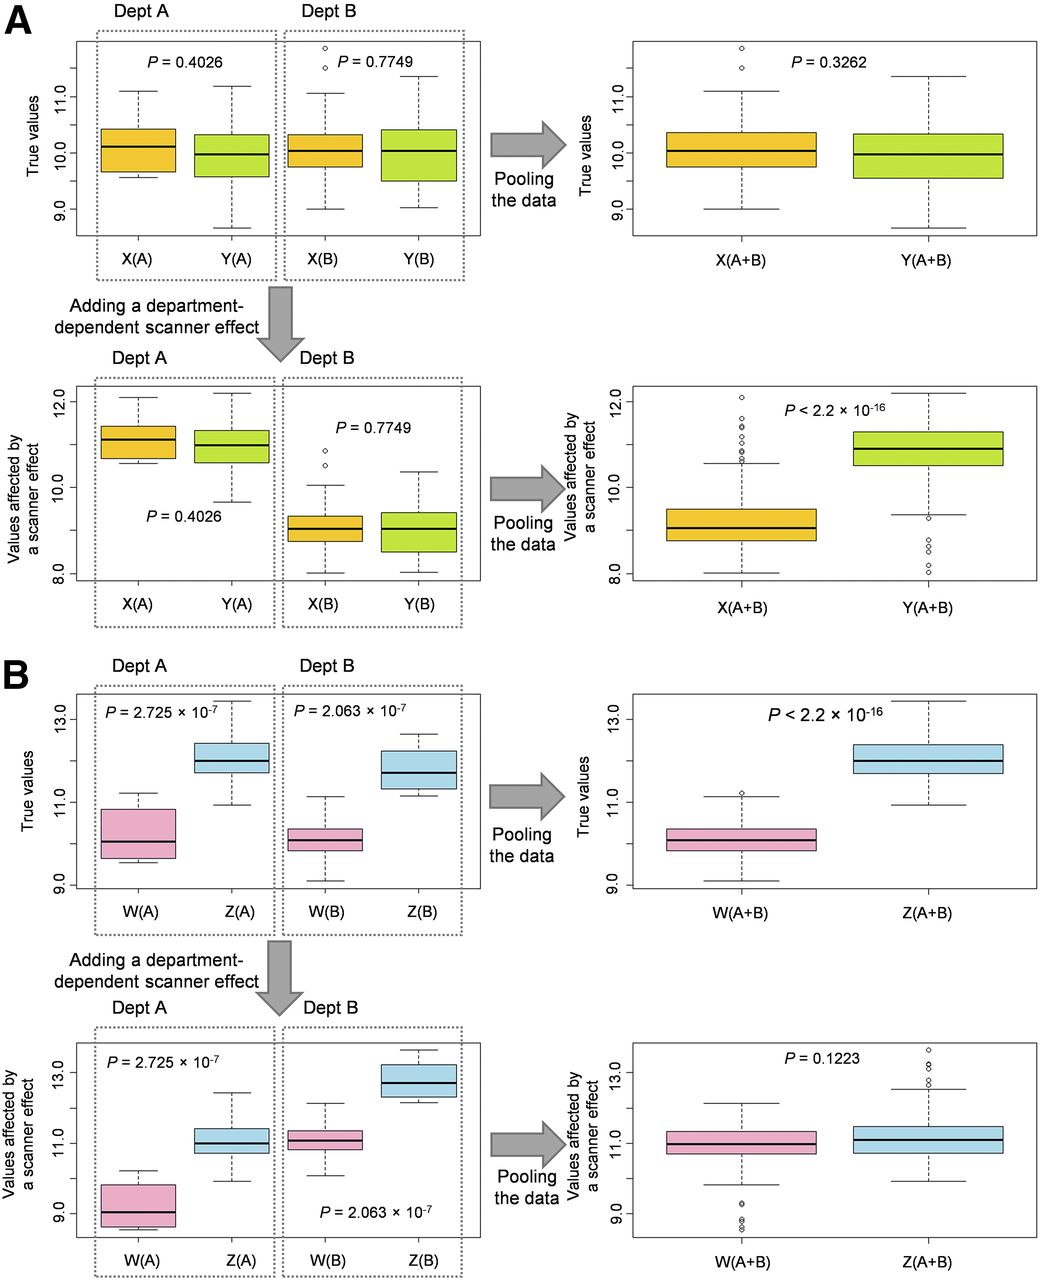
In each of the 3 PET image–based radiomic studies that included more than 200 patients (Fig. 1)—one to evaluate somatic mutations (9), another to predict prognosis in non–small cell lung cancer (10), and a third to predict treatment response in esophageal cancer (11)—the PET images came from different PET scanners but the scanner effect was not explicitly accounted for. Many studies have reported the impact of acquisition and reconstruction parameters on radiomic features. Ignoring the scanner effect when pooling data from different centers can affect the results in two ways: either making the results more significant than they are or hiding significant differences (Fig. 5).

Simulated pooling of data from different imaging protocols (one protocol for department A and another for department B). (A) True values for hypothetical lesion types X and Y as randomly drawn from normal distributions, with mean of 10 and SD of 0.5 for both types (n = 10 X[A] lesions, 10 Y[B], 100 Y[A], and 100 X[B]). Data pooling showed no significant difference between lesion types, but addition of department-dependent scanner effect (+1 for A and −1 for B) did show significant difference. (B) True values for hypothetical lesion types W and Z as randomly drawn from normal distributions, with respective means and SDs of 10 and 0.5 for W and 12 and 0.5 for Z (n = 10 W[A] lesions, 10 Z[B], 100 Z[A], and 100 W[B]). Data pooling showed significant difference between lesion types, which was no longer present after addition of department-dependent scanner effect (−1 for A and +1 for B).
Although entropy was the most robust feature in previous publications (Supplemental Table 4 of Orlhac et al. (22)), we observed a shift in entropy in liver tissue among the 3 departments (Supplemental Fig. 1A), with higher entropy in department A than in department B or A-S (P < 0.0001; Table 2). The shift was no longer present after harmonization (P > 0.7), suggesting that even when a feature is robust with respect to different imaging protocols, a scanner effect can still be present and require compensation in multicenter studies.
If covariates of interest are properly set (Eq. 1), ComBat harmonization may be used even if the patient groups have different characteristics, as explained by Fortin et al. (32). ComBat harmonization therefore removes the center effect without altering the biologic information conveyed by the radiomic features. When patient characteristics are very different between departments, the ComBat harmonization procedure should define any covariates that are to be protected—that is, are not to enter the harmonization process. For example, when removing the TN lesions from department A, we observed better discrimination between TN lesions from department B and non-TN lesions from department A (Supplemental Table 2) if TN status was defined as a covariate (using the X design matrix (Eq. 1)) than when no covariate was defined. Yet, with ComBat harmonization being a data-driven technique, it is preferable to use clinically and biologically similar datasets whenever possible.
ComBat has been described in a parametric version, with assumptions about the statistical distribution of the model parameters, and in a non-parametric version (25). Because our data did not closely fulfil these assumptions, we used the nonparametric version instead.
Differences between images from different PET systems could also be due to calibration differences. We performed a test (data not shown) to ensure that the image differences removed by ComBat harmonization could not have been sufficiently removed by simple corrections involving a rescaling or offset factor estimated from healthy liver.
A limitation of our study was the small number of patients in each department, although the number was consistent with most PET radiomic studies (Fig. 1). Studies of other imaging protocols and other cancer types are needed to more extensively validate the radiomic use of ComBat harmonization. The minimum number of patients required per department should also be further explored, especially in the nonparametric setting. ComBat has been specifically designed to be robust to small samples (25,32) and has been used in genomics with as few as 25 samples in each batch (25).
CONCLUSION
Using ComBat harmonization, a procedure initially described for genomic analysis, we showed that radiomic feature values and SUVs from images acquired in different departments or under different conditions could be pooled for further analysis. Harmonization preserved the individual variations in healthy liver tissue and breast lesions while removing the imaging-protocol effect. This method is easily available and does not require any feature recalculation since it applies directly to the radiomic feature values as opposed to the images. The ComBat harmonization approach appears to be a promising way to build radiomic models using data pooled from different departments. This harmonization method is also useful to apply a radiomic model derived from images acquired in one department to images acquired in another department.
DISCLOSURE
This work was supported by the “Lidex-PIM” project funded by the IDEX Paris-Saclay, ANR-11-IDEX-0003-02. No other potential conflict of interest relevant to this article was reported.
Footnotes
Published online Jan. 4, 2018.
- © 2018 by the Society of Nuclear Medicine and Molecular Imaging.
REFERENCES
- Received for publication August 2, 2017.
- Accepted for publication December 3, 2017.


Jump to section
Related Articles
Cited By...
- Stacking Ensemble Learning-Based [18F]FDG PET Radiomics for Outcome Prediction in Diffuse Large B-Cell Lymphoma
- Impact of ComBat Harmonization on PET Radiomics-Based Tissue Classification: A Dual-Center PET/MRI and PET/CT Study
- Effects of Tracer Uptake Time in Non-Small Cell Lung Cancer 18F-FDG PET Radiomics
- Quantitative Radiomics Features in Diffuse Large B-Cell Lymphoma: Does Segmentation Method Matter?
- A Guide to ComBat Harmonization of Imaging Biomarkers in Multicenter Studies
- 18F-FDOPA PET for the Noninvasive Prediction of Glioma Molecular Parameters: A Radiomics Study
- Pretreatment 18F-FDG PET/CT Radiomics Predict Local Recurrence in Patients Treated with Stereotactic Body Radiotherapy for Early-Stage Non-Small Cell Lung Cancer: A Multicentric Study
- Introduction to Radiomics
- Tumor Subregion Evolution-Based Imaging Features to Assess Early Response and Predict Prognosis in Oropharyngeal Cancer
- Reply to E. Laffon et al.
- Radiomics: Data Are Also Images
- Optimized Feature Extraction for Radiomics Analysis of 18F-FDG PET Imaging