


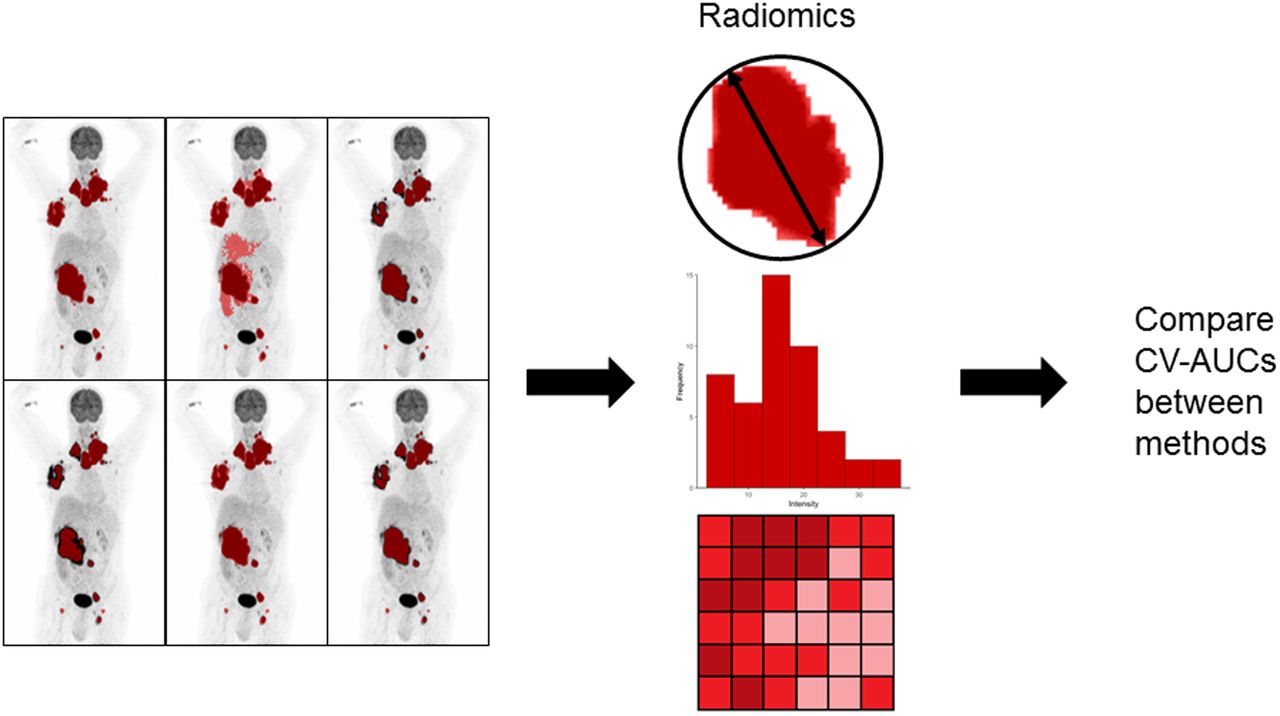
Visual Abstract

Abstract
Radiomics features may predict outcome in diffuse large B-cell lymphoma (DLBCL). Currently, multiple segmentation methods are used to calculate metabolic tumor volume (MTV). We assessed the influence of segmentation method on the discriminative power of radiomics features in DLBCL at the patient level and for the largest lesion. Methods: Fifty baseline 18F-FDG PET/CT scans of DLBCL patients with progression or relapse within 2 years after diagnosis were matched on uptake time and reconstruction method with 50 baseline PET/CT scans of DLBCL patients without progression. Scans were analyzed using 6 semiautomatic segmentation methods (SUV threshold of 4.0 [SUV4.0], SUV threshold of 2.5, 41% of SUVmax, 50% of SUVpeak, a majority vote segmenting voxels detected by ≥2 methods, and a majority vote segmenting voxels detected by ≥3 methods). On the basis of these segmentations, 490 radiomics features were extracted at the patient level, and 486 features were extracted for the largest lesion. To quantify the agreement between features extracted from different segmentation methods, the intraclass correlation (ICC) agreement was calculated for each method compared with SUV4.0. The feature space was reduced by deleting features that had high Pearson correlations (≥0.7) with the previously established predictors MTV or SUVpeak. Model performance was assessed using stratified repeated cross validation with 5 folds and 2,000 repeats, yielding the mean receiver-operating-characteristics curve integral for all segmentation methods using logistic regression with backward feature selection. Results: The percentage of features yielding an ICC of at least 0.75, compared with the SUV4.0 segmentation, was lowest for 50% of SUVpeak both at the patient level and for the largest lesion, with 77.3% and 66.7% of the features yielding an ICC of at least 0.75, respectively. Features did not correlate strongly with MTV, with at least 435 features at the patient level and 409 features for the largest lesion for all segmentation methods having a correlation coefficient of less than 0.7. Features correlated strongly with SUVpeak (at least 190 at patient level and 134 for the largest lesion were uncorrelated to SUVpeak, respectively). Receiver-operating-characteristics curve integrals ranged between 0.69 ± 0.11 and 0.84 ± 0.09 at the patient level and between 0.69 ± 0.11 and 0.73 ± 0.10 at the lesion level. Conclusion: Even though there are differences in the actual radiomics feature values derived and selected features among segmentation methods, there is no substantial difference in the discriminative power of radiomics features among segmentation methods.
Diffuse large B-cell lymphoma (DLBCL) is the most common subtype of non-Hodgkin lymphoma. To improve the outcome of patients with DLBCL, early identification of patients at risk of treatment failure is of the utmost importance, as 25%–40% of patients experience relapse or progression in the first years after diagnosis (1). Recent data suggest that baseline radiomics features are promising biomarkers to predict treatment outcome in DLBCL (2–4), as they can predict outcome beyond metabolic tumor volume (MTV) and the international prognostic index (5).
Radiomics features can be calculated from the baseline 18F-FDG PET/CT scans and capture detailed and quantitative information on, for example, texture, intensity, and shape of lesions. Currently, radiomics analyses in lymphoma are based on predefined tumor segmentations. Segmentations are usually performed using absolute SUV thresholds (6) or percentages of SUVmax or SUVpeak (2,7). For the calculation of radiomics features, some studies use the hottest lesion (4), whereas others use the largest lesion (3,8) or tumor segmentations at the patient level (2,9). The largest lesion and MTV at the patient level had the highest predictive value (9). Therefore, in this study we concentrated on the largest lesion and radiomics features extracted from tumor segmentations at the patient level.
One of the main problems with generating a multitude of features is the high false-detection rate caused by multiple testing. Moreover, several features may represent similar characteristics that are often highly correlated and therefore redundant (10). Redundant features may induce a correlation bias (11), and models become difficult to interpret (12).
Therefore, reducing the feature space to a degree feasible for clinical use without losing important information is essential. One method to reduce feature space is hierarchical clustering, based on correlation analysis or distance metrics (13).
Previous DLBCL studies showed that MTV measured with different segmentation methods, albeit at different cutoffs, showed comparable discriminative power to predict survival (6,7). However, it is unclear to what extent the discriminative power of other radiomics features is affected by the method used to segment the lesions. Therefore, our main objective was to assess the effects of applying 6 frequently used segmentation methods on the discriminative power for 2-year time to progression of baseline PET/CT radiomics features in DLBCL both at the patient level and for the largest lesion.
MATERIALS AND METHODS
Study Population
For this case-control study, 100 patients with newly diagnosed DLBCL from the HOVON-84 study (Haemato Oncology Foundation for Adults in the Netherlands; European Union Drug Regulating Authorities Clinical Trials Database identifier 2006-005174-42) with baseline PET/CT scans available were included. Fifty patients with progressive disease or relapse within 2 years after diagnosis were matched on scan interval and reconstruction method (European Association of Nuclear Medicine Research GmbH [EARL]/non-EARL) (14) with 50 patients without progression. For this analysis, we combined R-CHOP14 (14-d cycles of rituximab plus cyclophosphamide, doxorubicin, vincristine, and prednisone) and RR-CHOP14 (rituximab-intensified R-CHOP-14), because outcomes were similar between treatment arms (15). The HOVON-84 study was approved by the institutional review board, and all participants gave informed consent.
Quantitative Analysis
Quantitative PET/CT analysis was performed using the quantitative oncology molecular analysis suite (ACCURATE) (16). To match quality criteria, PET and low-dose CT scans should be complete, and liver SUVmean and plasma glucose should be within the ranges suggested by the European Association of Nuclear Medicine guidelines (14). If liver SUVmean was outside the suggested ranges but total image activity was between 50% and 80% of the injected activity, the scans were still included. All scans were reviewed by nuclear medicine physicians, and delineations were performed under their supervision. The following frequently used semiautomatic segmentation methods were applied to delineate lesions: an SUV threshold of 2.5, an SUV threshold of 4.0 (SUV4.0). 50% of SUVpeak (17), 41% of SUVmax, a majority vote segmenting voxels detected by at least 2 methods, and a majority vote segmenting voxels detected by at least 3 methods (supplemental materials; available at http://jnm.snmjournals.org).
Lesions were delineated with a fully automated preselection of lesions with a volume threshold of at least 3 cm3. Lymphoma lesions smaller than 3 cm3 were added by observer selection, and nontumor regions were deleted with single mouse-clicks for all 6 segmentation methods (18). Lesions for which automatic segmentation was successful were added to the patient-level volume of interest. If lesion selection resulted in flooding (i.e., selection of large parts of nontumor regions, such as liver, spleen, or skeleton), the lesion was not added. Adjacent nontumor 18F-FDG–avid regions (e.g., bladder or kidney) were manually removed. For the fixed SUV4.0 method, we also generated segmentations with a volume threshold of at least 3 cm3. Two observers selected the method with the highest visual agreement (best method) for each patient, resolving initial discrepancies in consensus meetings.
Feature Extraction
Four hundred eighty radiomics features (texture [n = 408], morphology [n = 22], intensity-based statistics [n = 18], intensity histogram [n = 24], intensity–volume histogram [n = 6], and local intensity [n = 2]) and 6 conventional PET uptake metrics before rebinning were extracted for both the patient level and the largest lesion for each segmentation method. The patient-level volume of interest included all segmented lesions and was generated by assigning all voxels within the individual lesions to one and all voxels outside any of the segmented individual lesions to zero. At the patient level, 4 additional dissemination features were calculated. All image-processing and feature calculations were performed using RaCat software (19), which complies with the imaging biomarker standardization initiative criteria (20). Details on feature calculation are presented in the supplemental materials.
Statistical Analysis
All statistical analyses were performed for radiomics features at the patient level and for the largest lesion using R (version 4.0.3). The paired Student t test was used to compare the MTV and SUVpeak of all segmentation methods with the best segmentation. On the basis of recent studies, the SUV4.0 segmentation was chosen as a reference (7,18). First, if the distribution of the radiomics feature values had skewness greater than 0.5 for the SUV4.0 segmentation method, they were log-transformed for all segmentations using the natural logarithm. The agreement between radiomics features extracted from different segmentations was quantified by calculating the intraclass correlation (ICC) compared with the SUV4.0 segmentation. ICCs were categorized as having reliability that was poor (<0.5), moderate (0.5–0.74), good (0.75–0.89), or excellent (≥0.90) (21). Two texture features at the patient level and 3 texture features at the lesion level did not show any variation and were therefore excluded.
MTV and SUVpeak have been shown to be predictive in DLBCL (9). To avoid overfitting and to remove redundancy, the feature space was reduced by deleting features that correlated strongly with either MTV or SUVpeak. The Pearson correlation coefficient between MTV and other radiomics features, and between SUVpeak and other radiomics features, was calculated for each segmentation method. A correlation was considered high if the Pearson correlation coefficient was at least 0.7 (22).
For each segmentation method, the mutual correlations between features that did not correlate with MTV and SUVpeak were calculated using Pearson correlation. For clusters of features with high mutual correlations, as identified with hierarchical clustering using Euclidian distance as a distance measure, the feature with the lowest correlation to MTV or SUVpeak was preserved.
Discriminative power (progression vs. nonprogression) was assessed using logistic regression with backward feature selection based on the Akaike information criteria (23). We included all independent features, MTV, and SUVpeak for all segmentations. Stratified repeated cross validation with 5 folds and 2,000 repeats was applied, yielding the mean receiver-operating-characteristic curve integral (CV-AUC) and the SD of AUCs between repeats. Comparing CV-AUCs is a known difficulty because of the inherent dependency of train-test iterations and complex relations between the trained models (24). Currently, there is no valid statistical approach to compare CV-AUCs.
As a sensitivity evaluation, all analyses were repeated for features that were reliable, repeatable, and reproducible in a multicenter setting (25).
RESULTS
Patient characteristics are summarized in Table 1. Sixty-four scans were semiautomatically analyzed and adapted with single mouse-clicks only. Thirty-six scans required manual editing because tumor and nontumor regions were adjacent. SUV4.0 was selected most frequently as the best method for both the patient level and the lesion level (49% and 64%, respectively).
Characteristics of Included Patients
MTV Analysis
The method using an SUV threshold of 2.5 resulted in MTV flooding for 44 patients, leading to exclusion of this method for further analysis. At the patient and lesion levels, MTV was highest for the segmentation using a majority vote segmenting voxels detected by at least 2 methods and was lowest for the method using 50% of SUVpeak (Table 2). Using the best visual segmentation as a reference, MTV was significantly higher for the segmentation using a majority vote segmenting voxels detected by at least 2 methods and was significantly lower using all other segmentation methods (all P < 0.05; Table 2; Fig. 1). SUVpeak was comparable among segmentation methods (all P > 0.05).
SUVpeak and MTV per Segmentation Method

Maximum-intensity PET projections of patient with lesion segmentations indicated in red for all applied methods using SUV scale of 0–10. 41%max = 41% of SUVmax; A50P = 50% of SUVpeak; MV2 = majority vote segmenting voxels detected by ≥2 methods; MV3 = majority vote segmenting voxels detected by ≥3 methods; SUV2.5 = SUV threshold of 2.5.
Patient Level
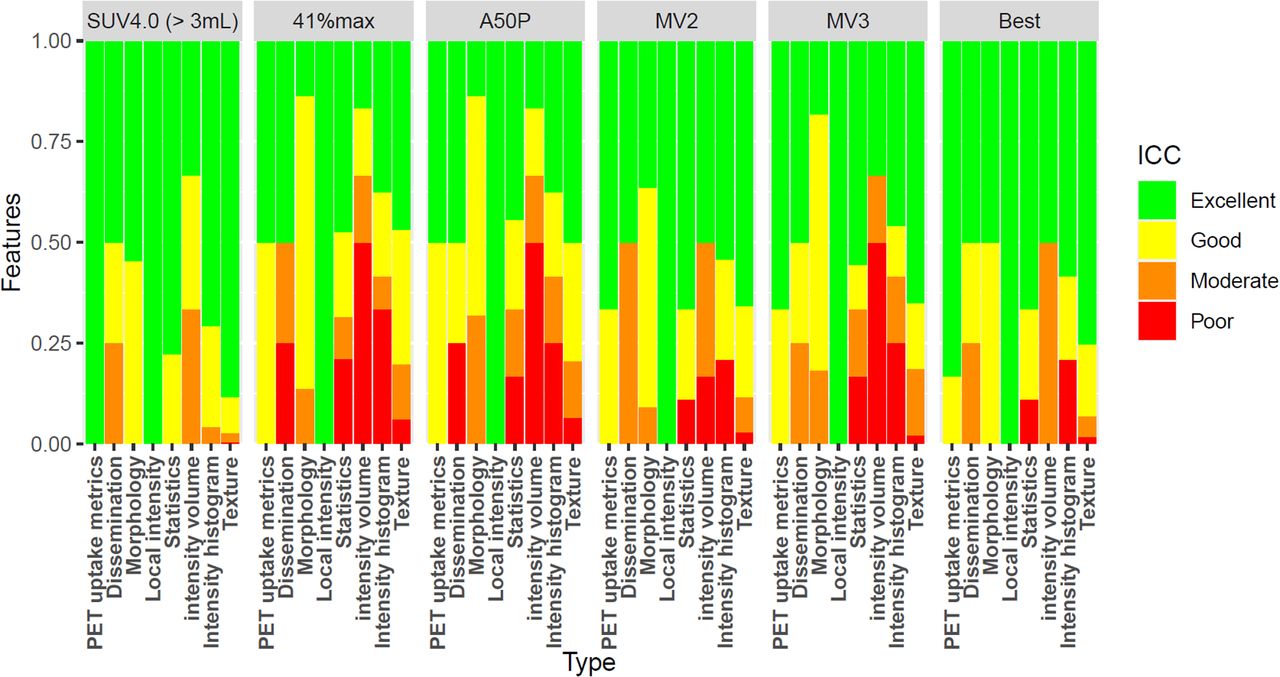
Radiomics features based on a SUV4.0 preselection with a 3-cm3 volume threshold resembled the features of the SUV4.0 segmentation most, with excellent reliability for 414 features (84.8%), followed by the best segmentation. For the segmentation using 50% of SUVpeak, similarity was lowest, with only 218 features (44.7%) having excellent reliability (Fig. 2; Supplemental Table 1).

Percentage of radiomics features yielding excellent, good, moderate, or poor ICC agreement between SUV4.0 segmentation and the other methods at the patient level. 41%max = 41% of SUVmax; A50P = 50% of SUVpeak; MV2 = majority vote segmenting voxels detected by ≥2 methods; MV3 = majority vote segmenting voxels detected by ≥3 methods.
For all segmentation methods, at least 435 features (89.3%) did not correlate strongly with MTV (Table 3), of which 433 (88.9%) did not correlate strongly with MTV for any segmentation method. At least 190 features (38.9%) did not correlate strongly with SUVpeak, of which 175 (35.9%) did not correlate strongly with SUVpeak for any segmentation. One hundred ninety-seven features (40.5%) did not correlate with MTV and SUVpeak for at least 1 method, of which 125 (25.7%) correlated neither with MTV nor with SUVpeak for any segmentation method. For each segmentation method, at least 25 features (5.1%) did not show high mutual correlations and did not correlate with MTV or SUVpeak. After backward feature selection, the SUV4.0 segmentation method yielded a CV-AUC of 0.74 ± 0.10; 41% of SUVmax had the highest CV-AUC (0.84 ± 0.09), the visually best segmentation method had the lowest CV-AUC (0.69 ± 0.11). Selected features after backward selection differed among segmentation methods and varied between 4 and 20 features (Table 3; Supplemental Table 2). For all segmentation methods, the morphologic feature “center of mass shift” and the texture feature “first measure of information correlation” were retained in the linear regression model.
Number of Independent Features per Segmentation Method, Number of Included Features, and Predictive Value at Patient Level for All Extracted Features (n = 488) and All Reliable, Repeatable, and Reproducible Features (n = 103)
Largest Lesion
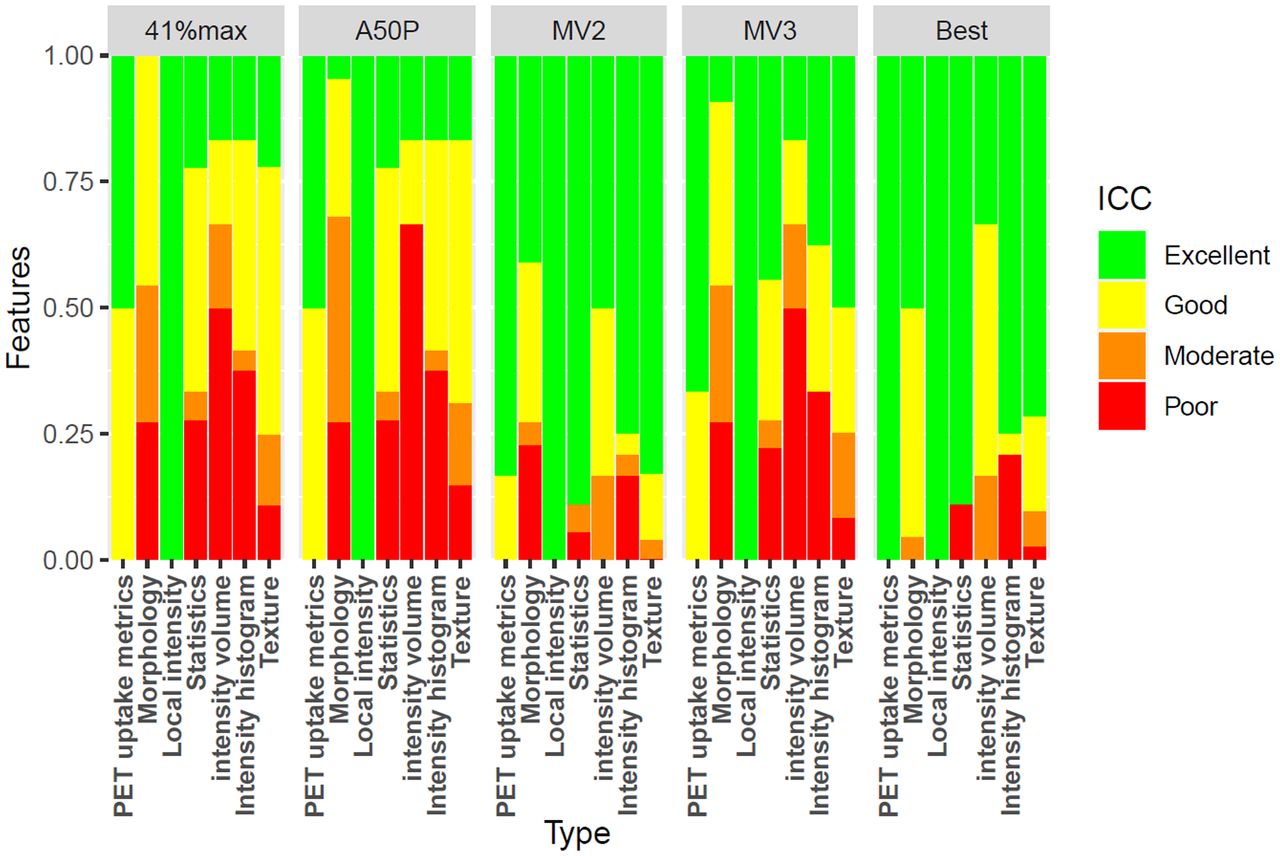
Radiomics features of the segmentation using a majority vote segmenting voxels detected by at least 2 methods resembled those of the SUV4.0 method most, with excellent reliability for 389 features (80.5%). For the segmentation using 50% of SUVpeak, similarity was lowest, at only 83 features (17.2%) with excellent reliability (Fig. 3; Supplemental Table 3).

Percentage of radiomics features yielding excellent, good, moderate, or poor ICC agreement between SUV4.0 segmentation and the other methods for the largest lesion. 41%max = 41% of SUVmax; A50P = 50% of SUVpeak; MV2 = majority vote segmenting voxels detected by ≥2 methods; MV3 = majority vote segmenting voxels detected by ≥3 methods.
For all segmentations, at least 409 features (84.9%) did not correlate strongly with MTV (Table 4), of which 404 (83.8%) did not correlate strongly with MTV for any segmentation method. At least 134 features (27.8%) did not correlate strongly with SUVpeak, of which 130 features (27.0%) did not correlate strongly with SUVpeak for any segmentation. One hundred forty-nine (31.0%) features did not correlate with MTV or SUVpeak for at least 1 method, of which 61 features (12.7%) correlated neither with MTV nor with SUVpeak for any segmentation method. For each segmentation method, at least 19 features (4.0%) did not show high mutual correlations and did not correlate with MTV or SUVpeak. After backward feature selection, SUV4.0 had the highest CV-AUC (0.73 ± 0.10), whereas a majority vote segmenting voxels detected by at least 3 methods and the best segmentation method had the lowest CV-AUC (0.69 ± 0.11). Selected features after backward selection differed among segmentation methods and varied between 5 and 11 features (Table 4; Supplemental Table 4). For all segmentation methods, the texture feature “first measure of information correlation” was retained in the linear regression model, and the intensity histogram feature “minimum histogram gradient” was retained in all models except for the SUV4.0 segmentation method.
Number of Independent Features per Segmentation Method, Number of Included Features, and Predictive Value for Largest Lesion for All Extracted Features (n = 483) and All Reliable, Repeatable, and Reproducible Features (n = 99)
When starting from a selection with reliable, repeatable, and reproducible features, similar results were found both at the patient level and for the largest lesion (Table 3; Table 4).
DISCUSSION
This study showed that the discriminative power is largely independent of segmentation method. However, there are large differences in radiomics feature values derived using different segmentation methods, as shown by ICC agreement values.
Both MTV and SUVpeak have been shown to be predictive in DLBCL (9). Our study showed that most radiomics features are independent of MTV for both the patient level and the largest lesion. Hatt et al. (26) showed that textural features, which comprise more than 80% of our radiomics features, already provide clinical complementary information in addition to MTV in lesions larger than 10 cm3, with an increasing complementary prognostic value for larger MTVs, disputing the threshold for texture features of 45 cm3 (27). With only 4 patients with MTVs smaller than 10 cm3 for the largest lesion, and 1 patient with an MTV smaller than 10 cm3 at the patient level, it is to be expected that most features are independent of MTV. However, many features correlated with SUVpeak, in which case they are redundant.
Currently, there is no consensus on the best segmentation method for delineating lesions in DLBCL 18F-FDG PET/CT studies. Therefore, it is essential to study the sensitivity of radiomics features in relation to segmentation method. In several solid cancers, radiomics features, especially morphologic and texture features, are influenced by the delineation method (28–31). The number of extracted features in these studies varied widely, between 9 and 480. We extend these findings by showing that for the largest lesion in DLBCL, up to 31% of the texture features, and 68% of the morphologic features, were highly sensitive to the segmentation method, as shown by the reliability of features compared with SUV4.0 segmentation. DLBCL lesions usually are large, heterogeneous, and bulky. Larger lesions are known to exhibit higher hypoxia, necrosis, or anatomic and physiologic complexity—characteristics that logically translate to higher complexity in the spatial 18F-FDG distribution and hence sensitivity to segmentation method, leading to lower reliability of features among applied methods. Furthermore, as variations in segmentation methods have a strong effect on the outer contour of the segmentation, thus influencing the shape of the segmentation, a high sensitivity to segmentation methods for morphologic features could be expected. Because of the higher MTV, the radiomics features at the patient level were less influenced by segmentation method, with up to 20% of the texture features, and 32% of the morphology features, being sensitive to segmentation method. Because of the low similarity of some of the features between segmentations, it is not advisable to use regression coefficients from other studies that applied other segmentation methods.
However, even though values are not interchangeable, in our study the discriminative power at the lesion and patient levels was comparable among segmentations. Contrary to what we expected, choosing the segmentation method that visually best selected the tumors did not result in a higher CV-AUC. These results are in line with previous studies exploring the predictive value of radiomics features using different segmentations for other cancer types. None of these studies found significant differences in predicting outcome (28,32), metastasis, or lymph node invasion (30) using different segmentation methods. However, ICC agreement values, correlations with MTV, correlations with SUVpeak, and mutual correlations differed among segmentation methods, resulting in different preselections of features for the logistic regression model. Even though discriminative power is comparable, different features are predictive of outcome when applying different segmentation methods.
When using only previously defined reliable, repeatable, and reproducible features, discriminative power was slightly lower for all segmentation methods. However, the CIs of CV-AUCs using only reproducible features overlapped with the CIs of CV-AUCs using all features. Therefore, using only reproducible features does not affect discriminative power. In clinical practice and multicenter studies, variable image qualities are encountered. Therefore, some features that have high predictive values may in reality be difficult to measure reliably. It is thus advisable to only use reproducible features, especially in multicenter settings.
To our knowledge, this was the first study that assessed the influence of segmentation methods on PET radiomics features and their predictive power, other than MTV, in DLBCL. By applying multiple frequently used methods on the same patients, we could directly compare the effect of segmentation methods on quantitative PET radiomics features. We chose to calculate linear relations among radiomics features using Pearson correlation because we used logistic regression as a classifier, and the logistic regression model calculates linear relations with included features. This probably led to fewer included features in the logistic regression model compared with the application of Spearman correlation as data reduction method. One of the limitations of this study was that not all scans were scanned according to the EARL protocol; this inconsistency might affect the discriminative power and repeatability of features (25). Because we matched events and non-events on reconstruction method there were no difference in EARL compliance between groups. However, this matching does not preclude an effect of the reconstruction method on the discriminative power. Use of harmonization methods such as ComBat to retrospectively increase uniformity in large datasets has definitely been shown to be worthwhile (33,34). Therefore, ComBat-based data alignment would be a successful approach toward harmonizing these differences. Unfortunately, in our study the number of patients per center was too small to allow application of ComBat. Moreover, in view of the equivalent discriminative power seen in our data among various segmentation methods, ComBat-based data alignment would be a successful approach toward harmonizing databases of radiomics features analyzed using different segmentation methods. In our cohort, patients presented with high MTVs; therefore, these results need to be validated for other cohorts with smaller lesion sizes.
CONCLUSION
This study found no substantial difference in the discriminative performance of radiomics features extracted using different segmentation methods. However, there are differences in the actual radiomics feature values derived and in the selected features among segmentation methods. Until consensus on a segmentation method for DLBCL is reached, it is advisable to use only prediction models that are built using data with the same segmentation methods.
DISCLOSURE
This work was financially supported by the Dutch Cancer Society (VU-2018-11648) and partially by the research program STRaTeGy (14929), which is financed by The Netherlands Organization for Scientific Research. No other potential conflict of interest relevant to this article was reported.
KEY POINTS
QUESTION: What is the influence of segmentation methods on the discriminative power of baseline radiomics features in DLBCL?
PERTINENT FINDINGS: There is no difference in the discriminative power of radiomics features among segmentation methods. However, different features are selected when applying different segmentation methods.
IMPLICATIONS FOR PATIENT CARE: It is advisable to only use prediction models that are build using data with the same segmentation methods.
Footnotes
Published online July 16, 2021.
- © 2022 by the Society of Nuclear Medicine and Molecular Imaging.
REFERENCES
- Received for publication February 12, 2021.
- Revision received June 3, 2021.


