


Abstract
This information statement from the Society of Nuclear Medicine and Molecular Imaging, American Society of Nuclear Cardiology, and European Association of Nuclear Medicine describes the performance, interpretation, and reporting of hot spot imaging in nuclear cardiology. The field of nuclear cardiology has historically focused on cold spot imaging for the interpretation of myocardial ischemia and infarction. Hot spot imaging has been an important part of nuclear medicine, particularly for oncology or infection indications, and the use of hot spot imaging in nuclear cardiology continues to expand. This document focuses on image acquisition and processing, methods of quantification, indications, protocols, and reporting of hot spot imaging. Indications discussed include myocardial viability, myocardial inflammation, device or valve infection, large vessel vasculitis, valve calcification and vulnerable plaques, and cardiac amyloidosis. This document contextualizes the foundations of image quantification and highlights reporting in each indication for the cardiac nuclear imager.
PREAMBLE/BACKGROUND
Since the inception of stress myocardial perfusion imaging (MPI) in 1973 (1), the field of nuclear cardiology has focused on cold spot imaging for the interpretation of myocardial ischemia and infarction. In cold spot imaging, areas of decreased radiotracer uptake are identified relative to areas of presumed normal myocardial radionuclide uptake. Images are scaled to the peak myocardial counts, and the relative degree of decreased radiotracer intensity is described as abnormal segments of myocardium. Semiquantitative visual descriptors have been defined, and quantitative software products have been introduced to characterize the location, extent, and severity of abnormalities. The nuclear physician has become facile with cold spot MPI with respect to recommendations, performance, interpretation, and reporting results.
Hot spot imaging has been an important part of nuclear medicine, particularly for oncology or infection imaging, where the images are interpreted based on the areas of maximum intensity (‘hot spot’). For example Fluorine-18 (18F) fluorodeoxyglucose (FDG) positron emission tomography (PET) is indicated in the guidelines of diagnosis, treatment, and response to therapy for lymphoma (2). Hot spot imaging is increasingly used in nuclear cardiology to identify myocardial and vascular inflammation, cardiac native and prosthetic valve infection, implanted device infection using PET, and identification of cardiac amyloidosis using both PET and single photon emission computed tomography (SPECT). Herein, we provide an information statement on cardiovascular hot spot imaging from the Society of Nuclear Medicine and Molecular Imaging, the American Society of Nuclear Cardiology, and the European Association of Nuclear Medicine. The purpose of this document is to assist nuclear medicine and nuclear cardiology practitioners in recommending, performing, interpreting, and reporting the results of cardiovascular hot spot imaging (Table 1).
Indications for Hot Spot Imaging
DEFINITION OF STANDARD UPTAKE VALUE AND REGION OF INTEREST
Hot spot imaging techniques rely on providing metrics depicting the intensity of radiotracer uptake in a lesion or area that are not dependent on image scaling. Many different metrics have been described. The most commonly used clinical parameter for quantifying radiotracer activity within a tissue or lesion using PET (and increasingly with SPECT) is the standard uptake value (SUV). SUV is a semi-quantitative parameter measured on attenuation-corrected images which is defined as the tracer activity normalized to the injected activity (in MBq/kg) and the volume of distribution [typically the patient’s body weight (in kg)], adjusted for radiation decay (3):
Lean body mass (SUV-lean, SUL) can be used instead of body weight to account for the lower uptake of FDG by adipose tissue, and may minimize differences seen between males and females (4). SUV can be measured in grams per mL of tissue, though 1 g is frequently assumed to be equivalent to 1 mL and SUV is most commonly described as unitless (3).
Maximum SUV (SUVmax) represents the SUV of the voxel with the highest activity within a region of interest (ROI), and SUVmean is the averaged SUV of all voxels within a ROI (Fig. 1, Table 2). SUVmax is more commonly used for the evaluation of tumors, cardiac sarcoidosis, and infection on 18F-FDG PET/CT scans due to the thought that it is less dependent on the placement and drawing of the region of interest. Particularly in an area of heterogeneous tissue or tracer distribution, SUVmax may be affected by noise and may not accurately represent the real tissue activity. Indeed, a study of reproducibility of these measures found that test-retest variability is actually lower with SUVmean measurements when compared with SUVmax (5). SUVpeak is also available in some software packages, which is defined as the average SUV in a small region of interest around the high-uptake part of a lesion. SUVpeak has a larger volume with more voxels than SUVmax, thus is less affected by image noise. Software packages define the size, shape, and location of the ROI used to calculate SUVpeak differently, making comparison across software vendors difficult. For example, SUVpeak may be centered around SUVmax or around the region which yields the highest SUVpeak value.

Schematic of hot spot quantification. Visual representation of hot spot measurements including SUV and ROI. Note that the location of SUVpeak varies among software, and may be centered on SUVmax or on the region yielding the highest SUVpeak (as pictured here).
Definition of Quantitative Measurements
In order to account for differences in radiotracer uptake in various tissues, target to background ratio (TBR) can be used instead of individual SUV as a hot spot imaging parameter. TBR is typically defined as the ratio of the target SUV to the background SUV (e.g., blood pool or liver). In 18F-FDG PET/CT, blood pool SUV demonstrates less variability than liver SUV and may be a more accurate reference (6,7). TBR can be applied to any application, but it is commonly used for the measurement of the uptake in the coronary arteries, valves, and aorta. An advantage of using a ratio of two measurements on the same PET acquisition is that it partly corrects for variability from the use of different imaging systems and image reconstruction protocols and from errors in measurement of estimated radiotracer activity.
Cardiac metabolic volume (CMV, measured in cm3), defined as the volume of tissue in a lesion that is above a certain SUV threshold, is also used in cardiovascular applications to describe the overall lesion burden. Several commercially available software packages are able to automatically calculate lesion SUV measurements as well as metabolic volume. Cardiac metabolic activity (CMA, measured in grams) includes both the amount and volume of activity and is calculated as the CMV multiplied by the mean SUV of voxels above the pre-defined SUV threshold. The potential advantage of this measure is that it combines both the intensity and the volume of involvement. Some studies suggest that metabolic volumes and activity may be more prognostic in tumor imaging (8) and more diagnostic of cardiac sarcoidosis (9,10) than the simple SUVmax calculation. A concept similar to the CMA can be also extended to other applications. In vascular inflammation, a measurement of coronary 18F-sodium fluoride (NaF) burden along the whole-vessel, termed coronary microcalcification activity, can be quantified and represents the volume and activity of coronary artery inflammation and microcalcification above background (11).
Lesion size is frequently considered to include the halfway points between the maximum lesion activity and the surrounding background activity (12). Appropriate ROI determination is important in hot spot imaging, particularly when SUVmean or metabolic volume or activity is calculated. For example, cardiac sarcoidosis stems from granulomatous inflammation of the myocardium that does not generally follow or correspond to territories supplied by specific coronary arteries. Therefore, the ROI is the entire myocardium, and automated cardiac-specific software can identify this ROI and calculate SUV, CMV, and CMA within this region.
IMAGING AND IMAGE PROCESSING
Acquisition, reconstruction, and processing of hot spot images using either PET or SPECT are the basis for being able to provide clear interpretation and clinical recommendations. Understanding the technical aspects of imaging and image processing is essential, and detailed reviews of imaging systems and parameters of different types of PET and SPECT cameras have been published (13,14). Below, image acquisition and reconstruction, sources of error, and definitions of the ROI and SUV are described in detail.
Image Acquisition
Patients are typically imaged in the supine position, and preferably with the arms up. For PET, the field of view (FOV) may vary depending on the imaging protocol and clinical question, and may include cardiac only, chest, skull base to mid-thighs, skull vertex to mid thighs, or skull vertex to feet. In this sense some institutions may opt for a combination of a dedicated cardiac scan followed by a whole-body PET/CT acquisition. After an initial scout to delineate the FOV, a low-dose non-contrast CT scan is acquired for attenuation correction (AC) of the subsequent PET emission scan. PET acquisition consists of static or dynamic imaging in three-dimensional mode. Additionally, a diagnostic CT with intravenous and/or oral contrast may be acquired if clinically indicated, which should be performed according to corresponding CT procedural protocols. For rapid multi-bed protocols, acquisition time can range between 1 and 4 minutes per bed position depending on the scanner type (15).
Nowadays, nearly all PET scanners are hybrid systems with CT. Modern day PET scanners also incorporate time-of-flight (TOF) technology, which takes into account the difference in photon arrival time along the line-of-response, leading to higher contrast-to-noise ratios (16). Moreover, digital PET/CT systems utilize silicon photomultiplier tubes and promise an even higher sensitivity with spatial resolutions under 4 mm because of a longer axial FOV and improved coincidence timing resolution (17).
Image Reconstruction
Most PET and SPECT images are reconstructed with iterative methods, primarily maximum likelihood expectation maximization (18) (ML-EM) and ordered subsets (19) expectation maximization (OS-EM) methods and their variants. The goal of these algorithms is to find the most likely image given the acquired raw dataset presented. An image set is constructed, forward-projected, compared with acquired data, back-projected, and updated. The process is iterated upon until the image with the maximum probability is produced based upon the Poisson mathematical equation. Iterative reconstructions naturally take photon counting statistics into consideration, leading to much lower image noise compared with the older filtered back projection reconstruction method. More importantly, iterative reconstruction allows the incorporation of physical factors (such as attenuation, scatter, and resolution loss) into the forward and back-projection process in order to correct for those factors. In particular, the corrections of attenuation and scatter are the prerequisites for absolute tracer quantification of PET and SPECT imaging.
Although iterative reconstruction can achieve satisfactory quantification, several cautions are needed. First, as the iteration number increases, resolution and image contrast improve, but image noise also increases. This is particularly important for most hot spot quantification, where SUVmax is typically measured from a single voxel inside a ROI with the highest SUV. Increased image noise may artifactually increase SUVmax due to the increased likelihood that a single voxel value can be overestimated. This effect is more prominent for larger lesions with more voxels inside the ROI, where the chance of an overestimated voxel increases. On the other hand, a smaller number of iterations in the reconstruction leads to lower noise, but this potentially introduces blurring of small objects. Therefore, SUVmax may be underestimated as the reconstruction is at risk of under converging with low resolution and contrast. Consequently, there is an intrinsic trade-off between SUV overestimation due to noise and SUV underestimation due to under-convergence in iterative reconstruction. Alternative iterative reconstruction frameworks, such as Bayesian penalized likelihood (PL) reconstruction, have been investigated to improve convergence for lesion activity. One such algorithm utilizes voxel-wise regulation of the iterative steps with a user-defined penalization factor (20). That is to say, the algorithm attempts to balance the increased convergence at higher iterations while penalizing the equation for increased noise in an attempt to balance convergence and noise.
Another caution is the widely used resolution recovery in iterative reconstruction through the incorporation of point spread function (PSF). With PSF, the convergence of iterative reconstruction is generally slower as compared to that without PSF, but PSF reconstruction eventually leads to high contrast and resolution that cannot be achieved without PSF (21). Though the image looks smoother with PSF reconstruction, which more effectively incorporates neighboring voxels, there is no significant difference for background variability and reproducibility (22). In the context of hot spot quantification, PSF reconstruction generally gives higher SUV and SUVmax. However, it has been shown that PSF leads to edge artifacts in large organs. For small ROIs, such edge artifacts could merge and form a ‘‘peak’’, resulting in overestimation of SUVmax (21).
Phantom scans, such as using NEMA IQ phantom with multiple hot spot sizes, are recommended to be performed prior to human imaging. With known hot spot concentration in phantom hot spots, the quantitative accuracy can be determined for each scanner’s reconstruction parameter setting.
In summary, the widely used iterative reconstruction methods with physics data corrections lead to improved quantitative accuracy, though careful parameter optimization is needed for the task of hot spot quantification.
Calibration
A prerequisite for performing quantitative PET and SPECT studies is the accurate calibration of the scanner to ensure the validity of the quantitative results and comparability of SUV across different scanners. Calibration of a PET or SPECT scanner is the process of establishing the relationship between the true radiotracer activity concentration (23) and the count rate per volume as measured by the scanner, such that the results may be expressed quantitatively in terms of kBq/ml. This is achieved by comparing the results in terms of image voxel values reconstructed by the scanner with phantoms of known activity concentrations at a frequency guided by the manufacturer’s recommendation. In addition, a scanner should be cross-calibrated against a peripheral device, i.e., an activity (dose) calibrator; that is, the activity measured by the scanner should be directly compared with the injected activity as measured by the activity calibrator being used clinically (24). For example, an investigation of 23 PET/CT scanners demonstrated that all scanners were suitable for visual data analysis, but five were not validated for quantitative studies because concentration measurements differed from those of the activity calibrator by more than 10% (23), resulting in systematic error in SUV. For the purpose of SUV quantification on a single study, accurate cross-calibration between the PET/CT scanner and the activity calibrator is more important than the accuracy of each individual device, because if cross-calibration is accurate, errors will cancel each other out during the process of calculation of SUV (3). Although this process was primarily described for PET, the same process applies to SPECT to quantitative calibration.
Sources of Error and Quality Assurance
Errors in patient and camera position and bolus injection can lead to variability in SUV measurements and errors in interpretation (Table 3). Time from injection to imaging should remain constant, as tumor SUV tends to increase over time from injection to 90 minutes on 18F-FDG PET/CT (25), while blood pool activity clears over time. The most common cause of test-retest variability is differences in time between injection and imaging (3). Radiotracers with shorter half lives like 68Ga-DOTA-peptides are thought to have more variability in SUV measurements when the time from injection to imaging is not consistent. Besides the timing, the net amount of the administered bolus dose is directly used in the SUV calculation. An uncorrected lower net administered dose gives rise to a lower SUV. Therefore, the exact administered dose must be corrected for any residual activity in the syringe or administration system. Extravasation of radiotracer may lead to an incomplete dose administration, resulting in erroneous SUV calculations. In the event of dose extravasation, the lesion-to-background ratio may be used to generate relative SUV counts (24).
Sources of Error in SUV Measurement
The other element to ensure correct SUV assessment is to compensate for radioactive decay during the time interval between activity calibration time and CT acquisition time. PET/CT system software is capable of automatic decay correction, provided the clocks in the PET/CT system are synchronized with those in the activity calibrators (26). Documenting an accurate patient weight during each test is particularly important when assessing changes in SUV over time.
Patient motion as well as respiratory motion can result in SUV calculation errors especially near the diaphragm due to motion blurring and mismatched attenuation correction. Blurring of the focus of hyper-metabolism due to motion may result in erroneously low SUVmax values (27).
Metal object artifact causes erroneous SUV measurements. As SUV is calculated on the attenuation-corrected images, bright band artifact from high-density metal can cause an overestimation of tracer uptake and thus SUV. In these cases (such as identification of infection around implantable cardiovascular devices), SUV calculation may not be accurate. Metal artifact reduction algorithms have been shown in non-cardiac imaging to improve confidence in image interpretation and SUV calculation (28). Review of uncorrected images is needed to visually identify the true radiotracer activity around these metal objects. Similarly, the use of intravenous contrast during the transmission scan should be employed with care if essential for the exam, since it may result in overestimation of attenuation correction resulting in a falsely high SUV.
18F-FDG uptake in brown fat which occurs more frequently in children and younger adults can interfere with image interpretation. Many strategies exist including avoiding cold by maintaining a warm temperature (minimum 24°C or 75°F) of the injection/uptake room during uptake phase and providing a warm blanket (29). Premedication such as oral propranolol, oral diazepam, or intravenous fentanyl have also been used to aid in reducing brown fat uptake (30,31).
An accurate region of interest should be based upon a three-dimensional review of the image set and does not include adjacent hypermetabolic structures or lesions such as a hypermetabolic lymph node or loop of bowel. Partial volume effect may result in underestimated SUVmax calculation, particularly in lesions smaller than 2 cm, due to limited spatial resolution. The use of a recovery coefficient corrected for lesion size has been shown to have a higher sensitivity and specificity for detection of malignant lesions (12). In addition, the techniques which measure the total activity over larger region such as activity above threshold are potentially less affected by partial volume effects.
Patient factors such as glucose level and medications may also affect SUV measurements. Optimal dietary preparation prior to 18F-FDG PET is paramount for study accuracy. In inflammation and infection imaging, proper suppression of physiologic myocardial glucose uptake should be ensured and will be discussed in the coming sections. For myocardial viability studies, glucose manipulation protocols should be used to drive glucose into myocardial cells to assess for maximum viability.
Standardization
Wide variations in PET/CT scanners and their scan acquisition parameters, with newer machines promising better performance using enhanced hardware and software, lead to SUV variability between scanners particularly if no proper standardization is undertaken. A study comparing 5 different scanners found a variation in SUV of up to 47%; however, using standardized protocols reduced this variation to within 22.6% (32). Large variability of SUV is particularly undesirable with respect to threshold values used for diagnosis, serial scanning, and multicenter clinical trials.
PET acquisition parameters, such as acquisition mode, scan duration per bed position, and amount of overlap in bed positions, are settings based on the performance of the scanner, involving many moving parts with trade-offs among signal-to-noise ratio, radiation safety, logistics, and patient comfort. Ultimately, PET acquisition parameters affect PET image quality, and poorer image quality may result in an upward bias of SUV measurements up to 15% (24).
Increasing the sensitivity of the PET scanner by using 3-D acquisition (instead of 2-D acquisition using lead or tungsten septa between crystal rings), lengthening scan duration, and enlarging bed overlap improve signal-to-noise ratio (33). Another factor that affects signal-to-noise ratio is spatial resolution, which is determined by scanner features (e.g., crystal size and arrangement and 2D vs 3D acquisition mode) as well as reconstruction parameters. Lower spatial resolution implies a large amount of spread of the signal around its actual location, the hot spot appears less bright, and the SUV is lower (34). Scan acquisition parameters also determine the amount of noise present in the image. Noise usually provides an overestimate of the true maximum pixel value and SUV but can occasionally underestimate them (34).
In comparison, the CT component of PET/CT acquisition for attenuation correction and anatomical correlation is less complex and several studies show that CT parameters such as the tube current (mA), voltage (kV), and slice thickness have minimal or no effect on SUV quantification, assuming the CT parameters are strong enough to ensure adequate tissue penetration and/or image truncation in obese patients (35,36). Regardless, various guidelines have outlined the appropriate CT acquisition parameters within the framework of 18F-FDG PET/CT studies which should be followed (24,37,38).
Despite the inherent differences in scanner performance, adopting standardization of acquisition parameters across multiple centers are effective in limiting variability of SUV to less than 10% (39,40). This highlights the importance of adherence to guidelines and accreditation of PET/CT scanners to ensure the accuracy and comparability of SUV measured by individual scanner.
Variability in Measurement
The calculation of SUV depends on several factors that may contribute to bias and variability. For serial scans measuring response to therapy, studies have found that the bias in SUV measurement varied over time and among different vendor scanners (41). Utilizing repeated measurements of the same test object, it is reported that the test-retest single site variability for oncologic studies is 3%–5%, and similar among all three major vendor scanners (42). However, in a 68Ge/68Ga phantom study across 10 centers with various scanner vendors, reconstruction methods, and attenuation map generation approaches, SUV variability was in the range of 10% to 25% (43). In addition to physics-related variability, an additional 3% to 4% variability can be expected due to activity-correction factors over time, when there are no other operator errors (44). Moreover, differences among software packages in calculating SUV from stored DICOM images may be substantial and affect the interpretation of SUV across sites (45). In a busy clinical practice, it is important to note that the largest effect on SUVmax variance may be inconsistent time periods between injection time and scan time (46).
For imaging of cardiac inflammation, test-retest variability may be significantly higher due to differences in patient preparation and myocardial glucose utilization. One study found complete discordance in myocardial FDG uptake in 4 out of 15 patients who underwent repeated studies to evaluate for sarcoidosis (25).
One approach to reduce such multi-center variability is standardized radiotracer dosing and uptake delay.
Additionally, joint corrections for cardiac, respiratory, and gross patient motion in combination with utilization of target-to-background ratios can reduce variability (47). Finally, harmonizing the reconstruction and post-filtering parameters facilitated by phantom studies is needed to enforce consistent SUV measurement across scanners (48).
SUV Thresholds and Meaningful Change
Thresholds to consider a lesion metabolically active or abnormal are different based upon the tissue in question and the radioisotope used. For example, in 18F-FDG PET, absolute SUV values or an SUV target-to-background ratio using a background area with constant glucose utilization like the blood pool or liver may be used. Specifics will be discussed later in the sections on disease-specific imaging. A meaningful change in SUVmean in tumor imaging may be as low as 0.5, or 14% change from baseline. This, in part, is based on a study of 26 patients imaged on two separate occasions a few days apart which found a mean difference in SUVmean values of 0.01 ± 0.27 SUV and SUVmax of –0.05 ± 1.14 SUV (5). A 0.5 decrease in SUVmean was also shown to predict improved survival after chemotherapy (49). Meanwhile, the same study suggested that a meaningful change in SUVmax was around 2.2, or around 22% change from baseline. PERCIST guidelines have identified a threshold of at least a 30% change in SUVpeak with an absolute change of at least 0.8 to define partial metabolic response if SUVpeak is decreased or progressive metabolic disease if increased (50). However, no data are currently available on a meaningful change in the assessment of cardiovascular infection or inflammation. Similarly, no data are available on a clinically meaningful change in SPECT-generated SUV. Underlying all of these principles is that SUV is directly related to body weight, so large changes in weight can cause changes in SUV independent of the actual activity in the hot spot. SUL, incorporating lean body mass instead of weight, does not suffer from this potential issue.
In summary, in oncologic literature, a meaningful change of SUVmean is about 15% and SUVmax or SUVpeak is between 20% and 30%. Though, these values are based on small studies. A meaningful change in PET quantitative measurements in cardiovascular imaging is not clear and requires further investigation.
SPECT Quantification
Although our discussions on hot spot imaging and quantification have been primarily focused on PET due to a larger body of literature, similar imaging approaches can also be applied in SPECT imaging using tracers like technetium-99m (99mTc)-pyrophosphate (PYP).
Although acquisition geometries are different, current PET and SPECT systems both use OS-EM and ML-EM iterative reconstruction methods, with similar approaches to incorporate corrections of attenuation, scatter, and resolution loss through forward and back-projection. For CT-based attenuation map generation, although the conversion factors from Hounsfield Units to photon-energy-dependent attenuation coefficients are different between SPECT (e.g., 140 keV for 99mTc) and PET (e.g., 511 keV), the underlying conversion approach of bilinear interpolation is the same (51). Regarding scatter estimation, PET scanners typically use model-based methods, while various SPECT scanners might have energy-based or/and model-based methods available (52). While resolution recovery implementations are similar between PET and SPECT, the resolution kernels used in image reconstruction are typically wider for SPECT as its spatial resolution is generally inferior to that of PET. Similar to PET, a calibration process is needed to convert SPECT image voxel values to units of MBq/kg, so that SUV can be calculated and subsequent ROI measurements similar to PET can be performed. The calibration process can be achieved either through fillable phantom or long half-life traceable source (53).
Both conventional dual-head sodium iodine (NaI) cameras (54–58) and newer systems with cadmium zinc telluride (CZT) detectors (59,60) can be used for quantitation and SUV calculation using SPECT/CT technology. Solid state CZT cameras have the advantage of higher energy resolution and lower effective radiation doses, and these cameras contain either fixed or mobile detector heads. Additionally, small FOV cameras in hot spot imaging can be problematic in negative studies without an identifiable cardiac reference to center the FOV. In amyloid imaging for example, small doses of thallium-201 have been given to identify the heart and center the camera FOV prior to 99mTc-PYP infusion (61).
In addition to SUV quantification with 99mTc-PYP and other bone-seeking tracers, cardiac pyrophosphate activity can be calculated which mimics cardiac metabolic activity used in myocardial inflammation imaging. This measures activity and volume of the 99mTc radiotracer uptake in the heart above thresholds obtained from the left ventricular blood pool, and was demonstrated to have high diagnostic accuracy for ATTR cardiac amyloidosis (62).
Key Points in Imaging and Image Processing:
State-of-the-art hybrid 3D PET/CT systems with TOF and longer axial FOV are best equipped to acquire and perform hot spot imaging.
Iterative reconstruction methods should be fine-tuned to balance convergence and noise, preferably with phantom studies.
Calibration of the scanner with an activity calibrator and phantoms of known activity is essential and should be done at a frequency guided by the manufacturer.
Quality assurance and sources error should be investigated at the lab and patient level.
PET acquisition parameters can affect image quality and SUV measurement.
CT acquisition parameters typically have minimal effect on SUV quantification.
Standardization of imaging techniques can limit variability of SUV measurements to less than 10% across centers.
The largest effect on SUV values in serial studies is variations in time between radiotracer injection and imaging.
Patient preparation is also a major driver of variability in measurements.
Target-to-background ratios are often used to correct for variability across studies.
Many lessons on image acquisition, reconstruction, calibration, sources of error, and standardization in PET imaging apply to SPECT.
INDICATIONS, PROTOCOLS, AND INTERPRETATION OF CARDIOVASCULAR HOT SPOT IMAGING
Indications, radiotracers and administered activity, and imaging protocol considerations for both PET and SPECT modalities are located in the Table 1.
Myocardial Viability
Indications
Viability imaging is indicated for the assessment of patients with left ventricular dysfunction, where information regarding viability would influence the decision to pursue revascularization (63–66). Viability imaging with 18F-FDG PET is able to differentiate viable myocardium (reduced resting perfusion with preserved or upregulated 18F-FDG uptake) which may benefit from revascularization from infarcted myocardium (reduced resting perfusion with reduced 18F-FDG uptake) which would not be expected to regain contractile function (67). This information can help physicians weigh the expected benefits from revascularization against the anticipated procedural risks (68,69). In the surgical treatment for ischemic heart failure (STICH) trial, which included patients with ischemic heart failure (LVEF ≤ 35%) who were randomly assigned to receive medical therapy alone or medical therapy plus CABG, the 10-year follow-up data showed that the rates of all cause mortality, death from cardiovascular causes, and the composite of death from any cause or hospitalization for cardiovascular causes were significantly lower in the CABG group when compared to the medical therapy alone group (70). As to the STICH viability sub-study, unfortunately there were several limitations that lessen its applicability in clinical practice, which included the post hoc nature of the study, lack of randomization of viability imaging, and lack of 18F-FDG PET and/or cardiac magnetic resonance imaging (MRI) for viability assessment (71,72). Since the clinicians were not blinded to the results of viability imaging, they were faced with the potential ethical dilemma of enrolling CAD and LV dysfunction patients with viability into a randomized trial where revascularization was not guaranteed. This becomes particularly more difficult when the standard clinical practice and American College of Cardiology/American Heart Association (ACC/AHA) practice guidelines (Class IIA, Level of Evidence B) suggest significant symptomatic and/or survival benefit among heart failure patients with significant myocardial viability that undergo revascularization (73). The PET and Recovery Following Revascularization (PARR)-2 trial assessed whether 18F-FDG PET-guided revascularization improved outcomes in patients with ischemic cardiomyopathy and LVEF ≤ 35%, in whom the decision to pursue revascularization was not already made (74). While the primary outcome was not significantly reduced in the PET arm (HR 0.78, P = 0.15), it was significantly reduced in patients managed according to PET recommendations (HR 0.62, P = 0.019) (74) and in patients managed with PET guidance at experienced centers with ready access to 18F-FDG PET (75). Therefore, assessment of viability may have clinical utility in this selected population.
Protocol
Ensuring appropriate patient preparation is critical to the accuracy of hot spot imaging techniques. This is particularly true for 18F-FDG PET imaging protocols since different manipulations of myocardial substrate utilization are required. For 18F-FDG PET viability imaging, the goal is to maximize myocardial glucose uptake (64,76). This can typically be accomplished with a fasting period of at least 6 hours followed by a glucose load and insulin supplementation, with different preparations previously described (64). Diabetic myocardium may be less likely to respond to insulin, though protocolized intravenous glucose and insulin utilization may improve image quality. Aside from the euglycemic-hyperinsulinemic clamp (64), acipimox and trimetazidine (neither medication approved for use in the U.S.) may also be given to reduce serum free fatty acid levels and promote myocardial 18F-FDG uptake (77). After radiotracer injection, incubation time is typically 45 to 60 minutes until image acquisition and can be up to 90 minutes in diabetics.
Image Interpretation
Quantification of myocardial viability is commonly assessed using visual methods, with ‘‘normal’’ 18F-FDG uptake being scaled to areas with ‘‘normal’’ perfusion. Myocardial viability is typically interpreted in reference to myocardial perfusion as measured by SPECT (such as using 99mTc-sestamibi) or PET (such as using nitrogen-13 (13N)-ammonia or rubidium-82 (82Rb)). When FDG uptake is greater than perfusion in a given segment, that segment is felt to be viable (perfusion-metabolism mismatch). One definition states that 18F-FDG uptake in a myocardial segment of ≥ 50% of the maximal uptake in a region with normal perfusion and wall motion should be considered viable (78). In contrast, segments demonstrating matched decrements in perfusion and metabolism are considered non-viable (64). Automated quantification of these mismatched (viable) and matched (scar) scores can reduce inter- and intra-observer variability and are associated with prognosis (79). Absolute quantification of myocardial glucose metabolism is not thought to be helpful to increase accuracy due to patient-to-patient variability in glucose manipulation prior to imaging (64), though this is an area for future research.
Myocardial Inflammation
Indications
18F-FDG PET for inflammation or infection imaging is based on the high expression levels of glucose transporters and hexokinase in activated neutrophils and macrophages in an affected lesion. However, inflammation or infection is not an approved indication of 18F-FDG in the United States, which is only indicated for PET imaging of cancer, cardiac metabolism (viability), and epileptic seizures (80).
Cardiac sarcoidosis is the most frequently assessed etiology of myocardial inflammation with 18F-FDG PET. This is a disease characterized by non-caseating granuloma formation, and cardiac involvement is reported to involve only 2% to 5% of patients with systemic sarcoidosis (81,82), even though autopsy studies indicate a considerably greater prevalence of 27% (83). There is also evidence indicating that sarcoidosis can be clinically isolated to the heart (84). Cardiac involvement may range from silent myocardial granulomas to symptomatic conduction disturbances, ventricular arrhythmias, progressive heart failure, and sudden death, and accounts for 13% to 25% of disease-related deaths (83). 18F-FDG PET aids in the diagnosis, prognosis, management, and assessment of treatment response in cardiac sarcoidosis, and is recommended for clinical use (85,86). Treatment is typically with immunosuppression which has been shown to decrease quantitative SUV measurements (87,88), and reduction in 18F-FDG uptake is associated with improved LVEF (89). Whole-body 18F-FDG PET imaging also allows for identification of involved non-cardiac tissue which may be easier to access for biopsy.
Myocarditis can also be identified using 18F-FDG PET imaging, and there is good agreement between 18F-FDG PET and cardiac MRI findings (90). 18F-FDG PET may be complementary and incremental to MRI by improving the sensitivity of MRI in mild or borderline myocarditis and increasing specificity in chronic myocarditis.
Protocol
Resting perfusion or scar imaging using SPECT, PET, or cardiac MRI is coupled with metabolism 18F-FDG PET. Assessment of inflammation or infection employs a strategy of suppression of myocardial glucose utilization (91). Prolonged fasting (92), high-fat and low-carbohydrate diets (93–95), and heparin administration (96,97), have been proposed as methods to shift the myocardium to predominantly free fatty acid metabolism. Recent guidelines have suggested a combined approach, including some or all of these components (64). Patient preparation with combined high-fat low-carbohydrate diets followed by period of fasting have demonstrated an 84% to 100% success rate (98–101). Ensuring patient compliance to preparation with a combination of written instructions, phone call reminder prior to preparation, food diary, and glucose monitoring is recommended in addition to assessment of myocardial uptake pattern. In addition, strenuous exercise should be avoided for at least 12 hours prior to the exam. In diabetics, blood glucose would ideally be close to normal level (i.e., < 11 mmol/L or < 180 mg/dL), as high serum glucose levels may interfere with the detection of inflammatory and infectious sites due to competitive inhibition between 18F-FDG uptake and circulating D-glucose (102). 18F-FDG should be injected no sooner than 4 hours after subcutaneous injection of rapid-acting insulin or 6 hours after subcutaneous injection of short-acting insulin, and is not recommended on the same day after injection of intermediate acting and/or long-acting insulin (37). In hospitalized patients, it is important to review all medications for sources of carbohydrate exposure and heparin which may influence image quality. Additionally, some protocols include the use of intravenous heparin of 50 IU/kg approximately 15 min prior to 18F-FDG injection; however, its net clinical impact in suppressing myocardial glucose utilization remains unclear.
After radiotracer injection, patients should rest quietly until imaging commences 60 to 90 minutes later. The time interval between 18F-FDG injection and image acquisition is critical if quantification using SUV is intended, but less important for visual reading only. Administered activity or scan time per bed position can be reduced in modern, high-sensitivity scanners with time-of-flight capabilities. Conversely, for patients weighing more than 90 kg, it is recommended to increase the scan time per bed position, instead of further increasing the administered activity. Low-dose CT attenuation correction is typically used with 18F-FDG, but a respiration-averaged low-dose CT can be considered, as this will likely give better alignment between PET and CT over the heart (37).
Whole-body 18F-FDG PET imaging is particularly useful to identify systemic sarcoidosis or septic embolism, mycotic aneurysms, and the portal of entry in infection imaging. For cardiac sarcoidosis, it is highly recommended to complement inflammation imaging with perfusion (nuclear) or scar imaging (MRI) in order to assess the presence of both active inflammation and scar (85). Adding gated cardiac PET is optional. This may improve image quality, particular in coronary atherosclerosis assessment and infective endocarditis (103), but additional supporting literature for 18F-FDG is scarce.
Image Interpretation
Interpreting 18F-FDG PET for cardiac inflammation requires systematic review and integration of perfusion imaging (if performed), 18F-FDG imaging, and hybrid FDG/CT fused imaging (Figures 2, 3). A commonly employed method involves a four-step process:

Example of a patient with cardiac sarcoidosis. Panel A Rubidium-82 and 18F-FDG PET images in a patient with systemic sarcoidosis demonstrating a mismatched defect in the left ventricular septum, mid to distal inferior wall, and basal to mid anterior wall Right ventricular uptake is also noted. Panel B–D 18F-FDG PET images showing FDG avid hilar lymphadenopathy (B) and cardiac uptake (C, D). Myocardial SUVmax, SUVmean, SUVpeak, CMV, and CMA are calculated.

Serial studies in a patient with cardiac sarcoidosis. Fused 18F-FDG and CT images in a patient with biopsy-confirmed sarcoidosis and ventricular tachycardia showing heterogeneous cardiac uptake (Panel A). A repeat study 6 months later after receiving immunosuppressive therapy demonstrated resolution of myocardial inflammation (Panel B).
(1) Perfusion image interpretation for defects and cardiac size/function (including resting blood flow if performed)
(2) Review of relative intensity (normalized) FDG images in the conventional cardiac display along with hybrid 18F-FDG PET/CT fusion images in an SUV scale
(3) Integration of perfusion and 18F-FDG PET/CT data
(4) Review of ‘extra-cardiac’ 18F-FDG PET/CT (thoracic and/or limited whole-body) for assessment of ‘extra-cardiac’ sarcoidosis activity
Integration of 18F-FDG and myocardial perfusion interpretation can be described by the following general patterns: both normal perfusion and metabolism, abnormal perfusion or metabolism, or abnormal perfusion and metabolism. These findings can be then classified into additional categories: (1) Normal: normal perfusion and lack of 18F-FDG myocardial uptake, (2) Early disease: no perfusion defect with focal 18F-FDG uptake, (3) Mismatch pattern: perfusion defect with increased corresponding 18F-FDG uptake, (4) Fibrosis/scar: perfusion defect with no 18F-FDG uptake. Two other patterns which involve increased myocardial 18F-FDG uptake can be noted: one with normal perfusion and the other with abnormal perfusion in a segment separate from the 18F-FDG uptake (104). The accuracy of these final two patterns to diagnose active cardiac sarcoidosis is lower and should be interpreted with caution, as many of these patients will not have the disease (105). A review of the axial fused 18F-FDG/CT images using an 0 to 7 g/mL SUV scale allows for identification of the presence, location, and intensity of cardiac 18F-FDG uptake. SUV-scaled interpretation can be helpful in low-intensity 18F-FDG images that would be artifactually intensified using normalized cardiac displays. Readers should be cautioned to avoid interpretation solely from standard nuclear cardiology software systems that only display normalized, non-SUV scaled 18F-FDG images as there is difficulty in assessing the total degree of cardiac and extracardiac disease activity and normalization artifacts in the intensity of the 18F-FDG signal.
The optimal SUV-based metric for 18F-FDG PET/CT for cardiac sarcoid interpretation is not known.
There are several quantitative metrics for assessment of cardiac SUVs (Table 2) (9,89,106–108). Though data supports their use, there is no single method or SUV threshold that is perfectly capable to distinguish active CS from normal myocardium or nonspecific uptakes. A simple approach is to measure SUVmax in the myocardium or TBR and use it to follow studies serially to assess for progression or regression. However, this does not take into account the extent of myocardial inflammation. A second approach is to measure the extent and severity of 18F-FDG uptake by segment (107). A third approach automated in several cardiac software packages is to measure the CMV and/or CMA above an SUV thresh-old (9,87). Finally, a coefficient of variation can be measured (ratio of standard deviation of myocardial SUV to average SUV) which examines the heterogeneity of FDG uptake. Some measure of quantification is particularly important for serial studies (Fig. 2C, D), though no data currently exists regarding a meaningful change in SUV or metabolic volume in patients with cardiac sarcoidosis.
The location of metabolic activity is also important to review, as the presence of 18F-FDG signal in the septum is associated with heart block and in the right ventricle with a higher incidence of ventricular tachycardia and worse outcomes (99,109). Review of the extracardiac field of view can be important to provide valuable evidence of active inflammation in the right ventricle, atria, and extra-cardiac structures. Importantly, 18F-FDG uptake in the lymph nodes of the lung or other extra-cardiac sites increases the likelihood that abnormal 18F-FDG myocardial uptake is due to sarcoidosis and may identify a site for higher-yield biopsy to detect non-caseating granulomas. In addition, readers should describe pathological 18F-FDG uptake which may be unrelated to cardiac sarcoidosis or myocardial inflammation such as lung nodules, breast tissue, and hepatic lesions.
Cardiac or Device Infection
Indications
A. Left ventricular assist device (LVAD): the body of the LVAD pump is connected to the left ventricular apex through the titanium inflow cannula and to the ascending aorta through a Dacron polyester outflow graft which is sometimes covered in polytetrafluoroethylene. The LVAD is powered by external batteries which are connected to the pump by a driveline (covered in polyester velour) which is tunneled from the pump body, through the abdominal soft tissue, and exits out a site in the abdominal skin. 18F-FDG PET is suggested for confirming and localizing an infectious site and may be valuable for predicting clinical outcome and guiding therapy (110,111).
B. Cardiovascular implantable electronic devices (CIED): 18F-FDG PET is helpful for differentiating superficial CIED pocket infection from deep pocket infection which usually requires invasive management. Oftentimes, cardiac providers are concerned about infection involving intra-cardiac CIED leads, though 18F-FDG PET is relatively less sensitive for evaluation of these infections given the generally small size of a lead tip vegetation, cardiac motion, and blood pool 18F-FDG activity (112).
C. Valves: 18F-FDG PET can increase the sensitivity of Duke Criteria for the diagnosis of prosthetic valve endocarditis without compromising its specificity (113). Evidence for 18F-FDG PET in native valve endocarditis is less strong. Whole-body 18F-FDG PET may also identify an extra-cardiac infectious source or embolic event (114).
D. Response to therapy: 18F-FDG PET can be used for the evaluation of treatment response in infections with LVAD, CIED, and prosthetic valve. As a functional imaging modality, it is expected to show much earlier response to therapy than morphological changes as seen on CT or echocardiogram, and can aid in guiding patient management (115,116).
E. Leukocyte (white blood cell) imaging: Leukocyte imaging is approved for imaging infection including cardiac device infection. Overall, its sensitivity is lower than 18F-FDG PET/CT, but relatively more specific. Thus, it is helpful for excluding cardiac device infection when findings on 18F-FDG PET/CT are equivocal (117).
Protocols
Imaging protocols for 18F-FDG PET imaging of cardiovascular devices, CIEDs, and prosthetic valves are similar to those employed in cardiac inflammation. Patient preparation to suppress myocardial glucose utilization is important to avoid myocardial spillover of counts to the target region of interest. In addition, whole-body imaging can be useful to identify remote sites of infection source or embolization.
Leukocytes can be radiolabeled either with 99mTc-hexamethylpropyleneamine oxime (99mTc-HMPAO, 370–555 MBq) or with 111In-oxine (10–18.5 MBq) and protocols have been previously described (102). 99mTc-HMPAO is generally preferred, because of the better image quality (higher count statistics and spatial resolution), and lower radiation exposure (0.011 mSv/MBq of 99mTc-HMPAO versus 0.36 mSv/MBq 111In-oxine). Image acquisition includes planar acquisitions at 30 minutes (early images), 4-6 hours (delayed images), and 20 to 24 hours (late images) after reinjection of radiolabeled leukocytes. A SPECT/CT acquisition is mandatory as part of the standard imaging protocol and it is usually acquired 4–6 hours and/or 20–24 hours after injection. Planar acquisitions will always include whole body images and anterior and posterior views of the thorax and any other region of interest (i.e., central nervous system, abdomen) when searching for septic emboli. Late acquisitions are particularly relevant in cardiovascular infections since background activity related to blood pool spill-over strongly hampers the detectability of lesions. SPECT/CT performed at 4–6 hours provides better image quality and might be repeated at 20–24 hours if planar images (and SPECT images) at 4–6 hours are negative (102). Hybrid SPECT/CT images acquired on high-sensitivity CZT cameras may improve target to background contrast and help to overcome limitations of low count statistics with late acquisitions and reduce image noise due to better energy resolution (118).
Image Interpretation
As in 18F-FDG PET imaging for cardiac inflammation, interpretation of LVAD, device, and valve infection begins with the review of quality metrics like patient preparation and image co-registration. The non-contrast CT scan is reviewed to identify the device in question and to look for any abnormalities such as malposition or fluid collection/abscess formation. In LVAD infection, the co-registered 18F-FDG images are reviewed to identify abnormal radiotracer uptake around the driveline, pump body, and inflow and outflow cannulas (Fig. 4). Nonattenuation-corrected images are important to review, as attenuation correction may create artifacts around metal objects and produce false positive 18F-FDG uptake (111). Review of images to identify intrathoracic 18F-FDG- avid lymphadenopathy or other loci of infection is also important. In CIED infection, care is taken to assess for 18F-FDG uptake in the device pocket and along the length of any intravascular or cardiac leads. Small abnormalities, for example a vegetation on a pacemaker lead, may not be identifiable on this type of imaging given the small size, movement of the vegetation, and interference from blood pool counts (102). There is difficulty in interpreting LVAD, CIED, and valve infections in the setting of recent surgical implantation, as there is a varying degree of inflammation post-operatively that can be identified with 18F-FDG imaging that does not signify active infection. Additionally, operative use of biologic surgical adhesive agents like BioGlue may lead to 18F-FDG uptake that signifies an ongoing inflammatory reaction to the adhesive as opposed to true infection. As of yet, metrics to quantify 18F-FDG uptake have not been published, but TBR may be helpful to quantify in cases of serial studies.

LVAD driveline and pump pocket infection. CT (A), 18F-FDG (B), and fused (C) images demonstrating diffuse 18F-FDG uptake around the extrathoracic and intrathoracic driveline (arrow) as well as surrounding the body of the pump. This patient had a HeartMate 3 device, wound cultures grew methicillin resistant staphylococcus aureus, and blood cultures were negative.
The interpretation of leukocyte scintigraphy should start with a visual quality control performed on whole body images and chest planar acquisitions to assess for: (1) the absence of high blood pool activity (suggesting the labeling of a substantial amount of erythrocytes) hampering interpretation even on delayed and late acquisitions, (2) liver uptake higher than spleen uptake, and (3) persistent pulmonary uptake (both 2 and 3 suggest leukocyte activation during the labeling procedure) (102). The signal kinetics between the acquisitions at 4 to 6 and 20 to 24 hours are important features for interpretation: any stable or visually increased site of uptake (either contrast or size) over time, confirmed on SPECT/CT, is highly suggestive of active infection. The exception is organs of high radiolabeled leukocyte recruitment where embolic events are seen as photopenic area. Semi-quantitative evaluation is also feasible, despite the fact that it has only been validated in musculoskeletal infections (119) and no data are currently available for IE/CIED infections (102). The effect of antimicrobial therapy should reduce the signal intensity over time in leukocyte scintigraphy; thus, stable uptake is considered significant. Finally, the effect of recent surgery has less influence on leukocyte scintigraphy in comparison with 18F-FDG PET/CT (117,120).
Large Vessel Vasculitis
Indications
18F-FDG PET can detect inflammation in large vessels including the aorta and cranial vessels in vasculitis such as Takayasu and Giant Cell Arteritis (GCA, Fig. 5). Inflammatory and metabolic changes often precede anatomic changes noted on CT or MRI. In addition, screening of patients with polymyalgia rheumatica without clinical signs of vasculitis may discover evidence of vascular inflammation consistent with GCA in as many as 50% of patients (121). Fever of unknown origin can also be assessed with 18F-FDG PET to search for vasculitis (122).

Example of large vessel vasculitis. 18F-FDG PET whole-body image demonstrating Giant cell arteritis of middle and large arteries and polymyalgia rheumatica of the shoulders, hips, pelvic region, lumbar spine, and knees.
Protocols
Cardiac and whole-body vascular imaging is performed with 18F-FDG PET/CT to assess for large vessel vasculitis (including GCA, aortitis, and Takayasu arteritis), with a similar protocol to that for cardiac inflammation. The standard protocol for vasculitis imaging involves an incubation time of 60 minute between intravenous radiotracer administration and acquisition (38,123), though more delayed acquisitions (i.e., 120 minute interval) will increase the vascular-to-blood pool ratio and could make the measured vascular uptake more accurate in certain cases (124). Standardization of the time interval is essential, especially when using semi-quantitative analyses and when comparing 18F-FDG uptake on follow-up studies and across scanners.
Image Interpretation
Interpretation of vasculitis imaging is typically performed on a visual grading scale in comparison to liver uptake. No uptake (grade 0) is when vascular uptake is below mediastinum, low-grade uptake (grade 1) is below liver, intermediate-grade uptake (grade 2) is equal to liver, and high-grade uptake (grade 3) is above liver. Grade 2 and 3 are considered positive studies for vasculitis. A total vascular score can also be calculated which integrates the grade found at 7 different vascular regions (range of scores from 0 to 21) (123). Vascular uptake in vasculitis is typically a smooth linear pattern involving the aorta and its main branches, while uptake in atherosclerosis is typically patchy and more predominant in the iliofemoral arterial system (122,123). Soft tissue radiotracer uptake should also be assessed, as polymyalgia rheumatica frequently correlates with synovitis of the shoulders and hips (Fig. 5) (125). Like in other indications, quantitative measures including SUVmax and TBR have been studied. TBR with a background of vena cava blood pool or liver has been recommended to avoid noise sometimes associated with absolute SUV measurements (123).
Valve Calcification and Vulnerable Coronary Plaques
Indications
Currently valve and vascular microcalcification imaging is performed in clinical research protocols; however, there are several potential future clinical applications. Noninvasive imaging of biological activity within vascular plaques represents an alternative method for identifying degenerating valves and rupture-prone plaques, potentially providing complementary information to the anatomical techniques which focus on identifying structural features.
Several prior studies have attempted to use 18F-FDG as a marker of coronary plaque inflammation. Increased 18F-FDG signal has been reported along the course of coronary arteries in patients with known disease and patients with acute coronary syndromes (126,127). The reliable detection of 18F-FDG in coronaries is hindered by avid 18F-FDG uptake in the highly metabolically active myocardium, despite efforts to reduce this effect (128, p18). 18F-NaF is economical, easy to manufacture, and has a modest effective radiation dose (∼4.3 mSv for 250 MBq) (129), making it readily translatable to the clinic. Increased 18F-NaF activity can be localized to individual coronary plaques that have ruptured or are high-risk for rupture (130). When 18F-NaF positive plaques were examined by IVUS and histology, they had multiple high-risk features including large necrotic core, increased inflammation, and micro-calcification. Moreover, 18F-NaF was found to be an independent predictor of myocardial infarction in an outcomes study of 293 patients. In fact, patients without 18F-NaF uptake in the coronary vasculature (90 of 293) did not have myocardial infarction after a mean of 3.5 years follow-up (131).
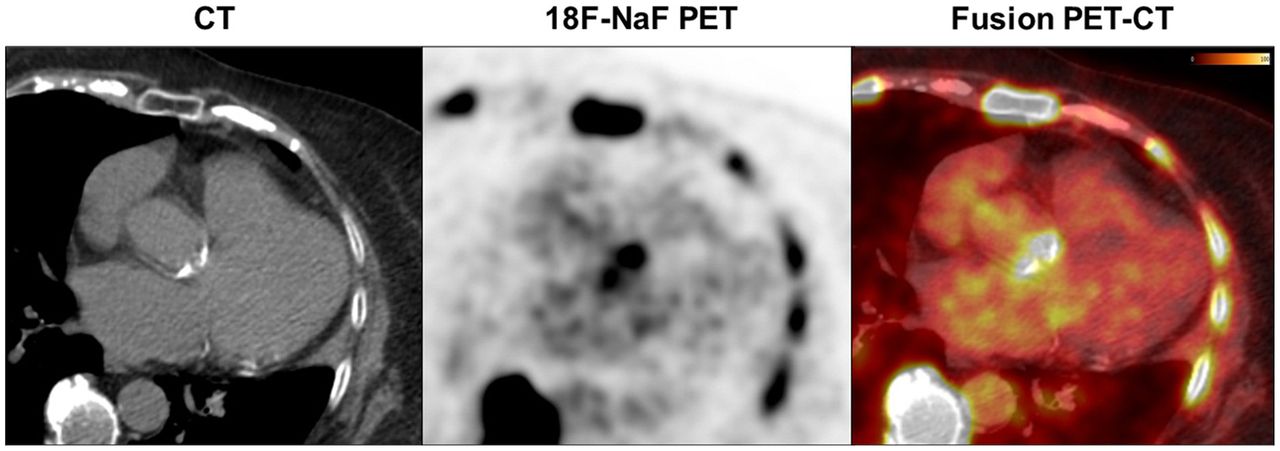
18F-NaF PET hot spot imaging is also useful in aortic valve imaging (Fig. 6) in both native and bioprosthetic valves. In a study of 101 subjects with aortic stenosis, 91% had increased 18F-NaF uptake, but only 35% showed increased 18F-FDG uptake (132). Importantly, the 18F-NaF aortic valve uptake is a marker of active calcification and disease progression in patients with aortic stenosis. With repeat CT scans of patients within 1-year, aortic valve calcification increased and baseline 18F-NaF uptake correlated closely with the change in calcium score (r = 0.75; P < 0.01) and was primarily observed in previously non-calcified regions (133). This finding was further confirmed after CT imaging at 2 years from the baseline PET scan (134, p1). These studies demonstrate the utility of 18F-NaF PET as the early sign of future valve calcification and rapid progression of aortic stenosis. After valve replacement, one of the key concerns is the calcification of the bioprosthetic leaflets. In a prospective study, 80 patients after aortic valve replacement received baseline 18F-NaF PET/CT, with follow-up at 2 years. The 18F-NaF uptake measured by TBR was the only predictor of bioprosthetic valve dysfunction, outperforming patient demographics, echocardiographic, and CT findings (135). Thus, this radiotracer may be clinically indicated in the future for the monitoring of patients with aortic stenosis or bioprosthetic valves.

Vascular/valve calcification. A patient with severe aortic stenosis demonstrating aortic valve calcification on CT as well as 18F-NaF uptake in the area of the aortic valve on PET images.
Protocols
For 18F-NaF PET/CT, a time interval of 60 minutes is recommended in vascular and in heart valve imaging (38). Whole-body acquisition from head to knee (optionally including the feet) is recommended along with a non-contrast CT for attenuation correction and anatomical localization. Contrast-enhanced CTA is useful for identifying stenotic vascular lesions, including the vulnerable plaque evaluation and potential paravalvular leakage (136). Detection on PET of smaller vascular structures in the head and neck region can be improved by increasing the acquisition time per bed position to improve image quality, and applying larger image matrices (thus smaller voxels) (137). This will reduce the partial volume effect of smaller structures, provided appropriate high-resolution image reconstruction settings are chosen (i.e., minimal image filtering during reconstruction and appropriate number of iterations/subsets to ensure sufficient convergence and/or contrast recovery by the iterative reconstruction process). When available, time-of-flight information should be used during reconstruction.
Image Interpretation
The first step in image interpretation is to ensure that precise co-registration is achieved with the PET and the CT (128). Visual and quantitative assessment of radiotracer uptake in the coronary vasculature is then assessed. Various quantitative approaches have been applied, typically utilizing a TBRmax (ratio of SUVmax in the region to the SUVmean of the background). However, the definitions of the background regions vary between studies (128,130,133,134,138). It has been found that the measure of TBRmean is more reproducible for valve imaging; however, this approach is dependent on exact anatomical definition (139). Quantification of whole-vessel coronary 18F-NaF burden is possible, providing an overall measure of coronary atherosclerosis analogous to mimicking the approach for the coronary artery calcium scoring. This measurement of coronary micro-calcification activity >1.56 has been shown to be prognostic of myocardial infarction after multivariable analysis in the first outcome study using this modality (131).
Cardiac Amyloidosis
Indications
Cardiac amyloidosis is caused by the myocardial accumulation of misfolded protein deposits, termed amyloid fibrils. The two main types are AL-type, derived from misfolded immunoglobulin light chains, and ATTR-type, derived from misfolded transthyretin proteins. SPECT imaging with bone tracers is preferred for the assessment of ATTR amyloidosis, as it is able to non-invasively diagnose ATTR amyloidosis in the context of negative blood and urine testing for a plasma cell disorder (140,141). Radiotracers available for use include 99mTc-PYP, 99mTc-3,3-diphosphono-1,2-propanodicarboxylic acid (DPD), and 99mTc-hydroxymethylenediphosphonate (HMDP), which likely bind calcium contained in the extracellular space in patients with ATTR cardiac amyloidosis, though some cases of AL amyloidosis may also exhibit cardiac radiotracer uptake (140).
PET agents have also been investigated in cardiac amyloidosis. Qualitative and quantitative evaluation of 18F-NaF PET, a bone-seeking PET agent, was found to be inferior to 99mTc-PYP in the detection of ATTR cardiac amyloidosis (142). Imaging agents that directly bind to amyloid fibrils such as Carbon-11 (11C) Pittsburgh Compound B (PIB), 18F-florbetapir, 18F-flutametamol, and 18F-florbetaben have demonstrated promise in clinical amyloidosis research studies (140). In general, AL demonstrates a higher retention of these specific PET compounds as compared with ATTR cardiac amyloidosis (143).
Protocols
No specific patient preparation instructions are required for SPECT or PET imaging in cardiac amyloidosis. Protocols for 99mTc-PYP imaging have been described in multisocietal expert consensus recommendations (140,144), and include planar and SPECT acquisitions between 1 and 3 hours. However, the evidence base for this imaging test has been advancing rapidly. The importance of SPECT imaging in suspected ATTR cardiac amyloidosis has been increasingly recognized (140,145,146). SPECT imaging allows differentiation of radiotracer activity in the myocardium from blood pool, which can improve diagnostic accuracy (145,146). Current multisocietal recommendations require SPECT image acquisition and interpretation at a time point of 2 or 3 hours after radiotracer injection (147). Several studies have demonstrated that SPECT imaging interpretation does not differ significantly between 1 and 3 hours post-injection (145,146,148), and the multisocietal document includes 1-hour imaging as optional, particularly in experienced centers. Utilizing CT attenuation correction offers the potential benefit of more accurately localizing uptake to either the blood pool or myocardium. The use of SPECT with CT attenuation correction has additional benefits by allowing absolute quantification of cardiac uptake (54,55,57–59).
Image Interpretation
Image interpretation begins with reviewing the anterior and lateral planar images of the chest and grading the degree of myocardial tracer uptake using the 4-point visual scoring system, widely known as the Perugini score. This score was validated at 3-hour post-injection on planar 99mTc-DPD imaging and uses tracer uptake by the ribs adjacent to the heart as reference: Grade 0 = no myocardial uptake; Grade 1 = myocardial uptake less than bone uptake; Grade 2 = myocardial uptake comparable to bone uptake; and Grade 3 = myocardial uptake more than bone uptake (149). A visual score of 0 is not suggestive of TTR amyloidosis, 1 is considered equivocal, and grade 2 or 3 is considered consistent with ATTR cardiac amyloidosis (150). The semi-quantitative method of heart-to-contralateral lung ratio (H/CL ratio) at 1-hour post-injection on planar imaging is suggestive of ATTR cardiac amyloidosis if the H/CL ratio is ≥ 1.5 (151). Studies using 99mTc-DPD have utilized ROIs over the heart, kidneys, and bladder to generate heart/whole-body ratios and retention to determine a threshold for cardiac involvement of ATTR amyloidosis (149).
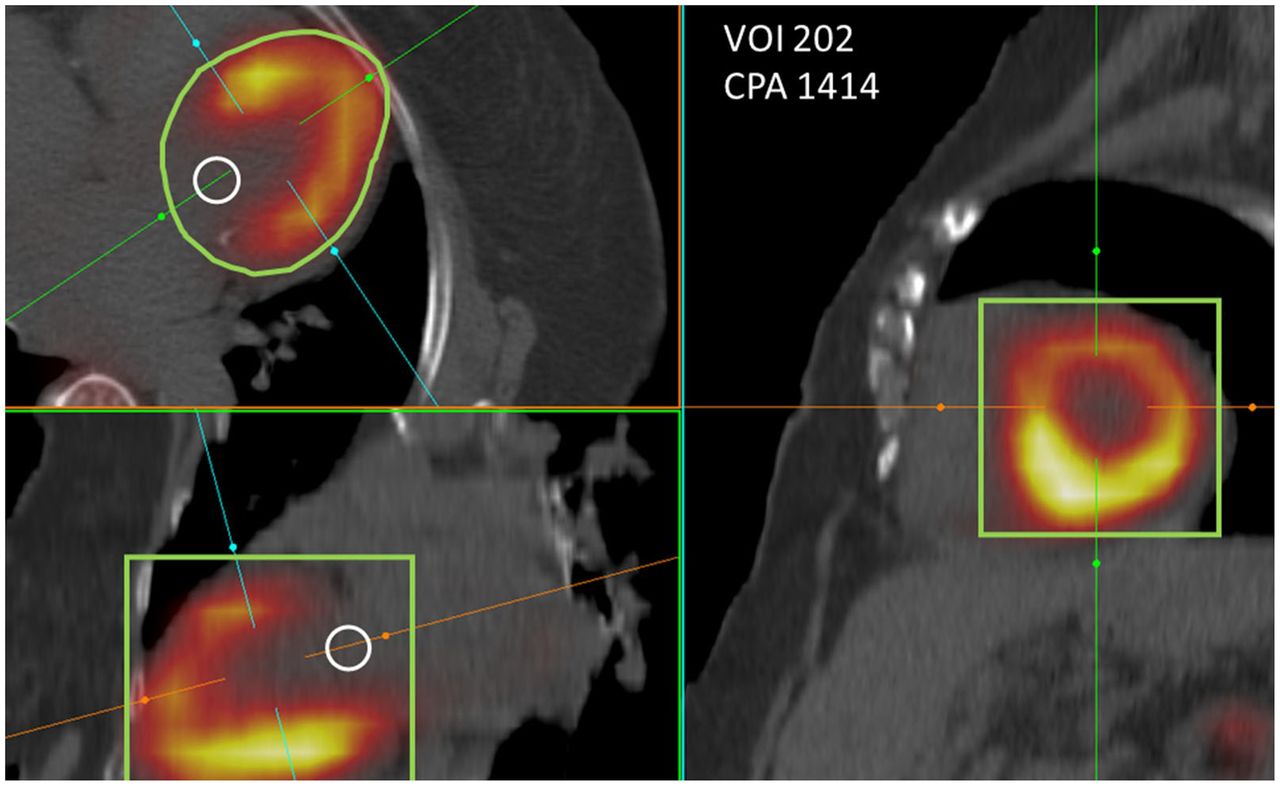
However, these planar images must be supplemented with SPECT to ensure that visualized radiotracer is localized to the myocardium and not the blood pool. Several studies have demonstrated significant false positive and negative rates of planar-only imaging (145,146). While SPECT images are currently interpreted qualitatively (i.e., presence or absence of myocardial radiotracer uptake), several groups have explored the feasibility of absolute quantification of cardiac 99mTc-PYP/DPD uptake using SPECT/CT to reflect the amyloid burden in the myocardium with encouraging results (Fig. 7) (54–57,59,60). Quantifying myocardial activity relative to background activity is also possible. The possibility is made even more distinct with newer SPECT/CT technology using CZT detectors and processing software (59). Further studies are underway to refine the process of quantification using SPECT/CT and advance it from the realm of research to clinical application, such as following disease progression or regression.

Example of a patient with cardiac amyloidosis. Tc-PYP SPECT/CT images showing radiotracer localized to the myocardium. Example of SPECT quantification using SUVmax, volume of involvement (VOI in cm3), and cardiac pyrophosphate activity (CPA in grams of tissue).
PET imaging in cardiac amyloidosis is interpreted using a retention index, but specific cutoffs for ATTR vs AL vs controls are still under investigation. Though, it appears clear that these radiotracers demonstrate more intense uptake above controls in patients with AL amyloidosis (as compared with ATTR amyloidosis) (152).
EXTRA-CARDIAC FINDINGS
Encountering incidental findings during cardiac imaging examinations is a common occurrence. Many studies have documented and analyzed these unexpected findings which may sometimes carry vital diagnostic information for coexisting pathology, unrelated to the cardiac imaging indication. Common areas of normal or benign 18F-FDG uptake include low levels in the distal esophagus, gastrointestinal tract, lower thoracic spinal cord, and thymus. High levels or focal 18F-FDG uptake in these or other areas may represent infection, inflammation, or malignancy and warrant further investigation. Malignancies may take up the 99mTc radiotracer as can rib fractures and other bone or bone marrow conditions. CTs used for attenuation correction should also be reviewed for incidental findings in the field of view, and suspicious findings must be included in the report with a description of an appropriate follow-up strategy (153).
CONCLUSION
Novel indications for cardiovascular hot spot imaging are emerging, and it is important for providers to apply the lessons learned from oncologic hot spot imaging to every day practice. It is essential to understand the concept of the region of interest, SUV, target-to-background ratios, and myocardial metabolic volume and activity. Hot spot imaging currently centers around the identification of myocardial viability, inflammation, infection, vasculitis, micro-calcifications, cardiac amyloidosis, and innervation. Continued research for these and other indications using currently available and novel radiotracers are ongoing.
DISCLOSURE
Dr. Sperry has received research support and speaking honoraria from Pfizer, and consults for BridgeBio and Alnylam. Dr. Robert Miller receives consulting fees and research support from Pfizer. Drs. Akin, Bravo, Chen, Dilsizian, Khor, Slart, Verberne have no disclosures to report. Dr. Bateman has research grants from Bracco, GE Healthcare, and Spectrum Dynamics, consults for GE Healthcare, receives royalties from SPECT and PET software products, and has equity interest in Cardiovascular Imaging Technologies. Dr. Miller has grant support from Eidos, Pfizer, and Alnylam, and consults for Eidos, Pfizer, and Roivant. Dr. Hyafil has consultancy and speaking fees from Blue Earth Diagnostics, Bracco Imaging, Curium, GE Healthcare, Nao-gen, and Pfizer. Dr. Slomka has research grant support from Siemens and the NIH (R01HL089765R01HL135557, R35HL161195) and software royalties from Cedars-Sinai. Dr. Liu reports research contract with Siemens Medical Solutions.
Footnotes
This article is being jointly published in The Journal of Nuclear Medicine (10.2967/jnumed.122.264311) and The Journal of Nuclear Cardiology (https://doi.org/10.1007/s12350-022-02985-8).
Published online Jul. 21, 2022.
- © 2022 by American Society of Nuclear Cardiology and the Society of Nuclear Medicine and Molecular Imaging.
REFERENCES
- 1.↵
- 2.↵
- 3.↵
- 4.↵
- 5.↵
- 6.↵
- 7.↵
- 8.↵
- 9.↵
- 10.↵
- 11.↵
- 12.↵
- 13.↵
- 14.↵
- 15.↵
- 16.↵
- 17.↵
- 18.↵
- 19.↵
- 20.↵
- 21.↵
- 22.↵
- 23.↵
- 24.↵
- 25.↵
- 26.↵
- 27.↵
- 28.↵
- 29.↵
- 30.↵
- 31.↵
- 32.↵
- 33.↵
- 34.↵
- 35.↵
- 36.↵
- 37.↵
- 38.↵
- 39.↵
- 40.↵
- 41.↵
- 42.↵
- 43.↵
- 44.↵
- 45.↵
- 46.↵
- 47.↵
- 48.↵
- 49.↵
- 50.↵
- 51.↵
- 52.↵
- 53.↵
- 54.↵
- 55.↵
- 56.
- 57.↵
- 58.↵
- 59.↵
- 60.↵
- 61.↵
- 62.↵
- 63.↵
- 64.↵
- 65.
- 66.↵
- 67.↵
- 68.↵
- 69.↵
- 70.↵
- 71.↵
- 72.↵
- 73.↵
- 74.↵
- 75.↵
- 76.↵
- 77.↵
- 78.↵
- 79.↵
- 80.↵
- 81.↵
- 82.↵
- 83.↵
- 84.↵
- 85.↵
- 86.↵
- 87.↵
- 88.↵
- 89.↵
- 90.↵
- 91.↵
- 92.↵
- 93.↵
- 94.
- 95.↵
- 96.↵
- 97.↵
- 98.↵
- 99.↵
- 100.
- 101.↵
- 102.↵
- 103.↵
- 104.↵
- 105.↵
- 106.↵
- 107.↵
- 108.↵
- 109.↵
- 110.↵
- 111.↵
- 112.↵
- 113.↵
- 114.↵
- 115.↵
- 116.↵
- 117.↵
- 118.↵
- 119.↵
- 120.↵
- 121.↵
- 122.↵
- 123.↵
- 124.↵
- 125.↵
- 126.↵
- 127.↵
- 128.↵
- 129.↵
- 130.↵
- 131.↵
- 132.↵
- 133.↵
- 134.↵
- 135.↵
- 136.↵
- 137.↵
- 138.↵
- 139.↵
- 140.↵
- 141.↵
- 142.↵
- 143.↵
- 144.↵
- 145.↵
- 146.↵
- 147.↵
- 148.↵
- 149.↵
- 150.↵
- 151.↵
- 152.↵
- 153.↵
- 154.
- 155.
- 156.
- Received for publication February 7, 2022.
- Accepted for publication April 19, 2022.


