


Article Figures & Data
Figures
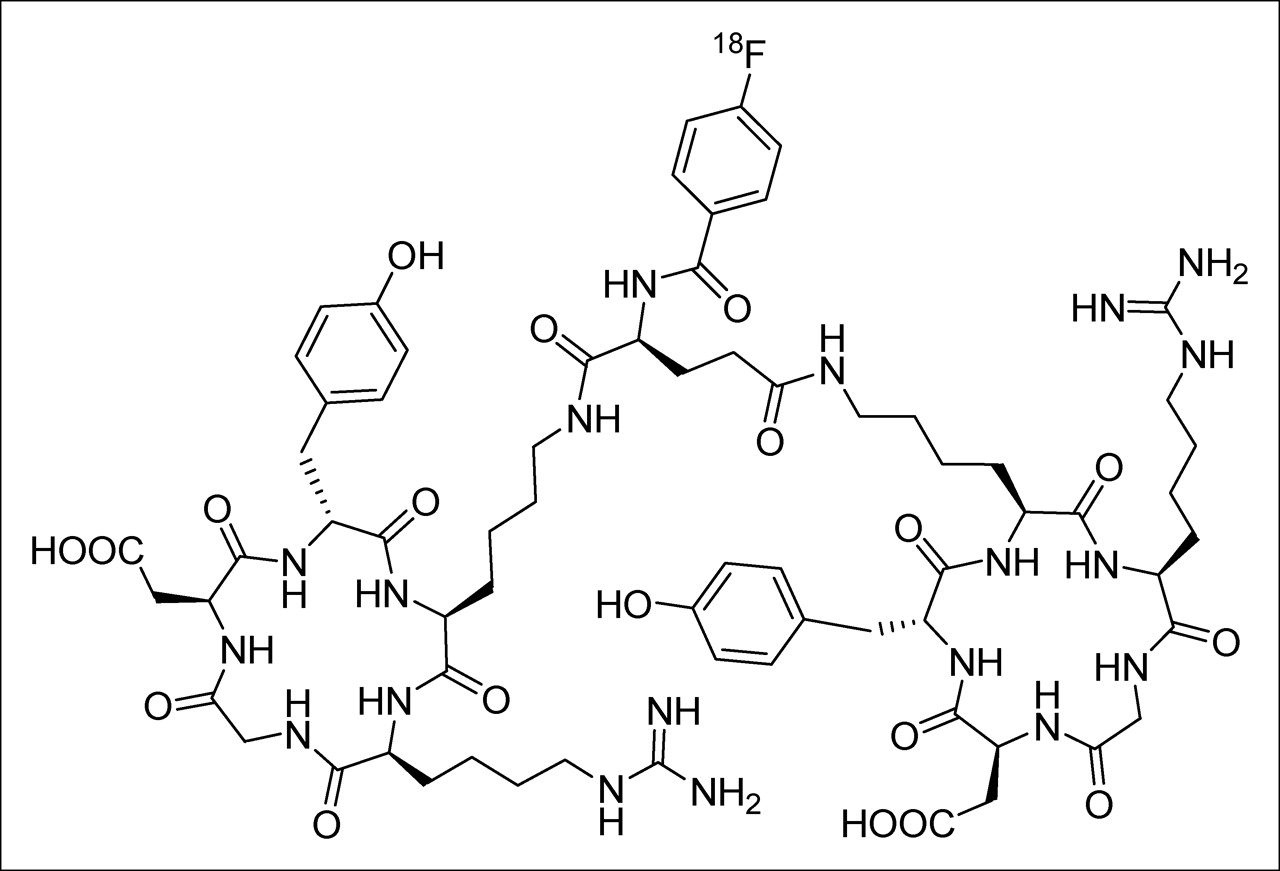
- FIGURE 1.
Schematic structure of 18F-FB–E[c(RGDyK)]2 (18F-FRGD2).
- FIGURE 2.
Analysis of non–small cell lung cancer A549 tumor tissue integrin level by SDS-PAGE/autoradiography. NP-40–solubilized tumor tissue lysate (30 μg) was incubated with 1 × 10⁵ cpm of 125I-echistatin for 2 h and increasing concentrations of echistatin. After separation on 0.6% SDS-PAGE, an autoradiogram was obtained (A) and each radioactivity band was quantified by using a PhosphoImager system (B). Scatchard transformation of the sigmoid curve generated tissue receptor density (number of receptors/mg tissue) (C).
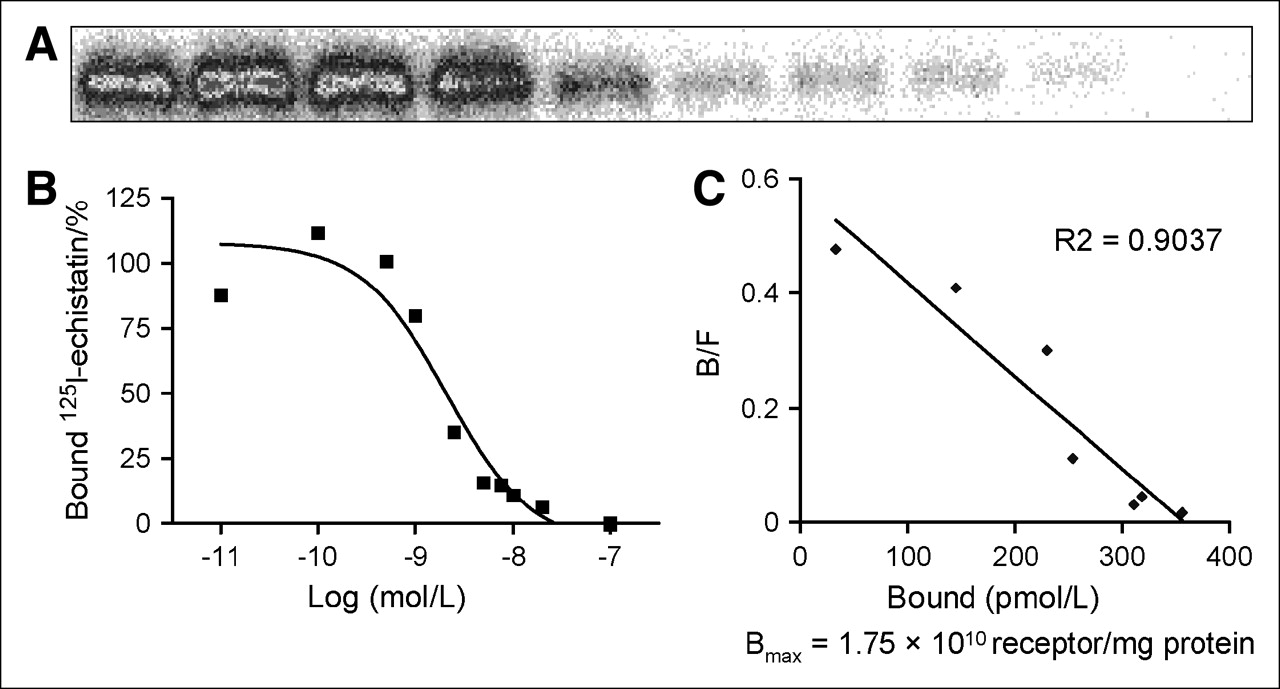
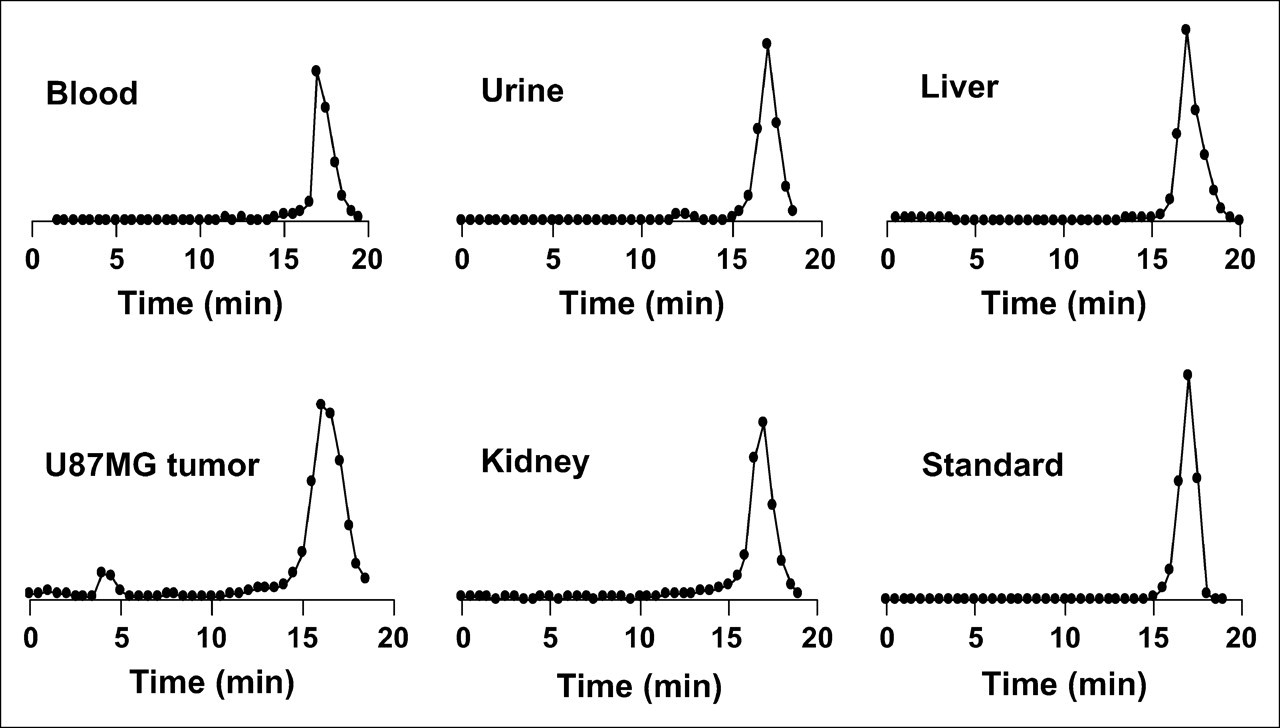
- FIGURE 3.
Representative HPLC profiles of the reference compound 18F-FRGD2, the soluble fractions of blood and urine samples, tumor, kidney, and liver homogenates collected 1 h after tracer injection. Dimeric RGD peptide tracer is metabolically stable in most organs and tissues.
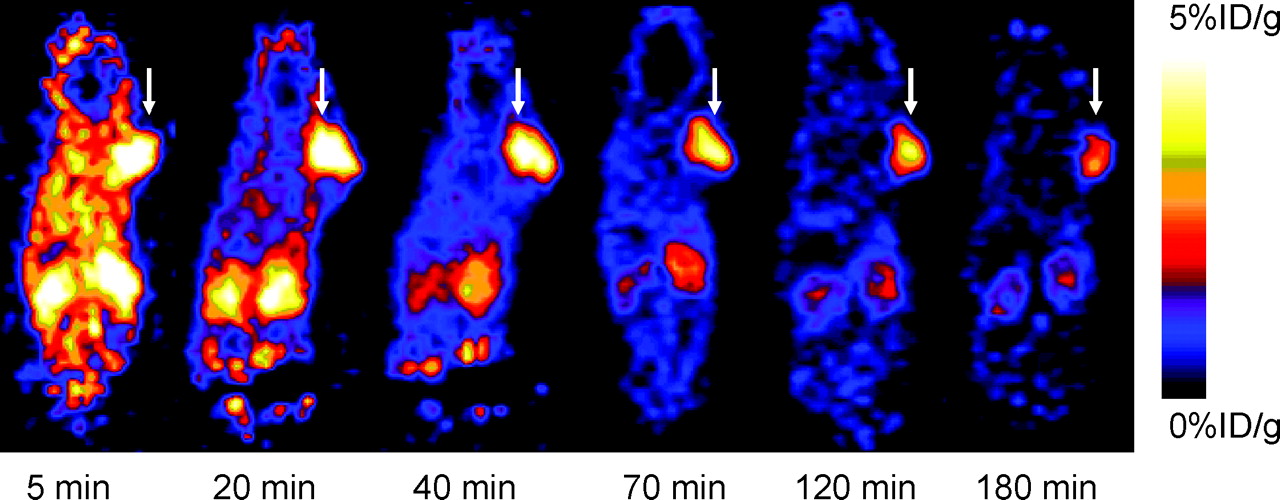
- FIGURE 4.
Dynamic microPET study of U87MG tumor-bearing mouse over 60 min after injection of 18F-FRGD2 (3.7 MBq [100 μCi]), static scans at 2- and 3-h time points were also conducted to complete the tracer kinetic study. Decay-corrected, whole-body coronal images that contain the tumor are shown. (Reprinted with permission of BioTechniques to reproduce parts of Figure 6.)
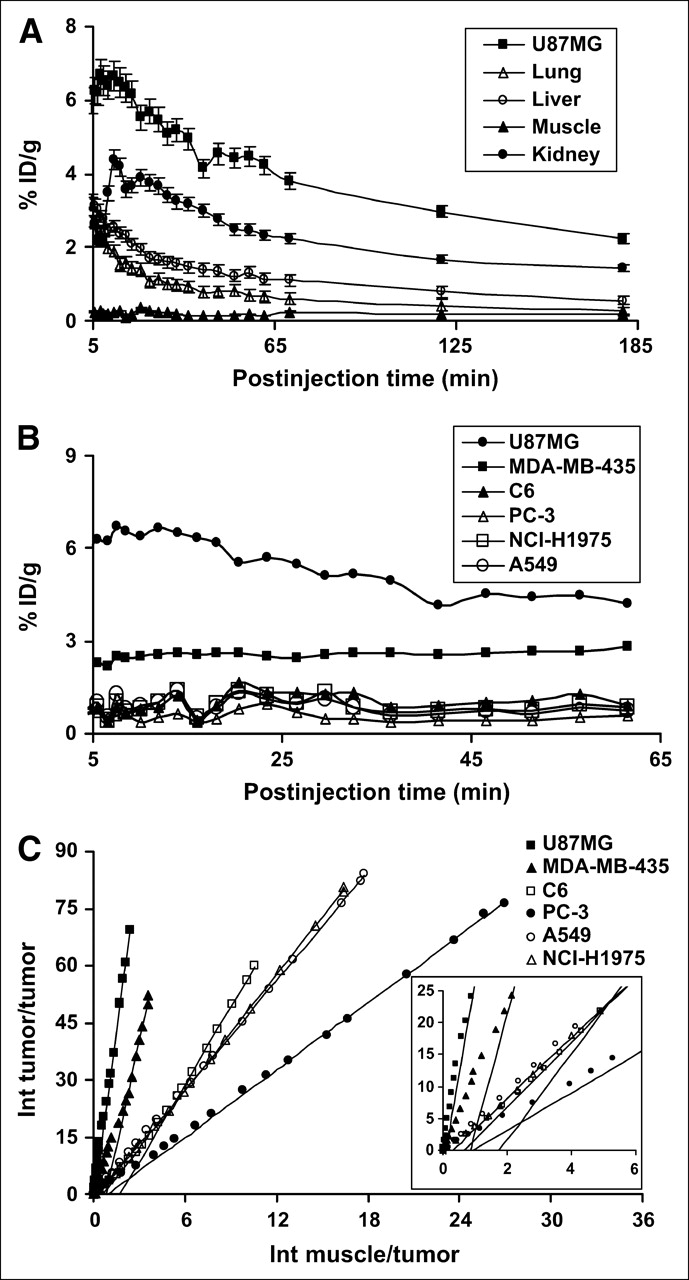
- FIGURE 5.
(A) Time–activity curves derived from 60-min dynamic and 70-min, 120-min, and 180-min static microPET study. ROIs are shown as mean %ID/g ± SD (n = 3). (B) Comparison of tumor uptake in nude mice derived from 60-min dynamic microPET scans. (C) Logan plots derived from 60-min dynamic microPET data, which showed excellent linearity of normalized integrated (Int) tumor activity vs. normalized integrated muscle tissue activity effective for time >25 min. Slopes of fits represent DVRs. (Reprinted with permission of BioTechniques to reproduce parts of Figure 6.)
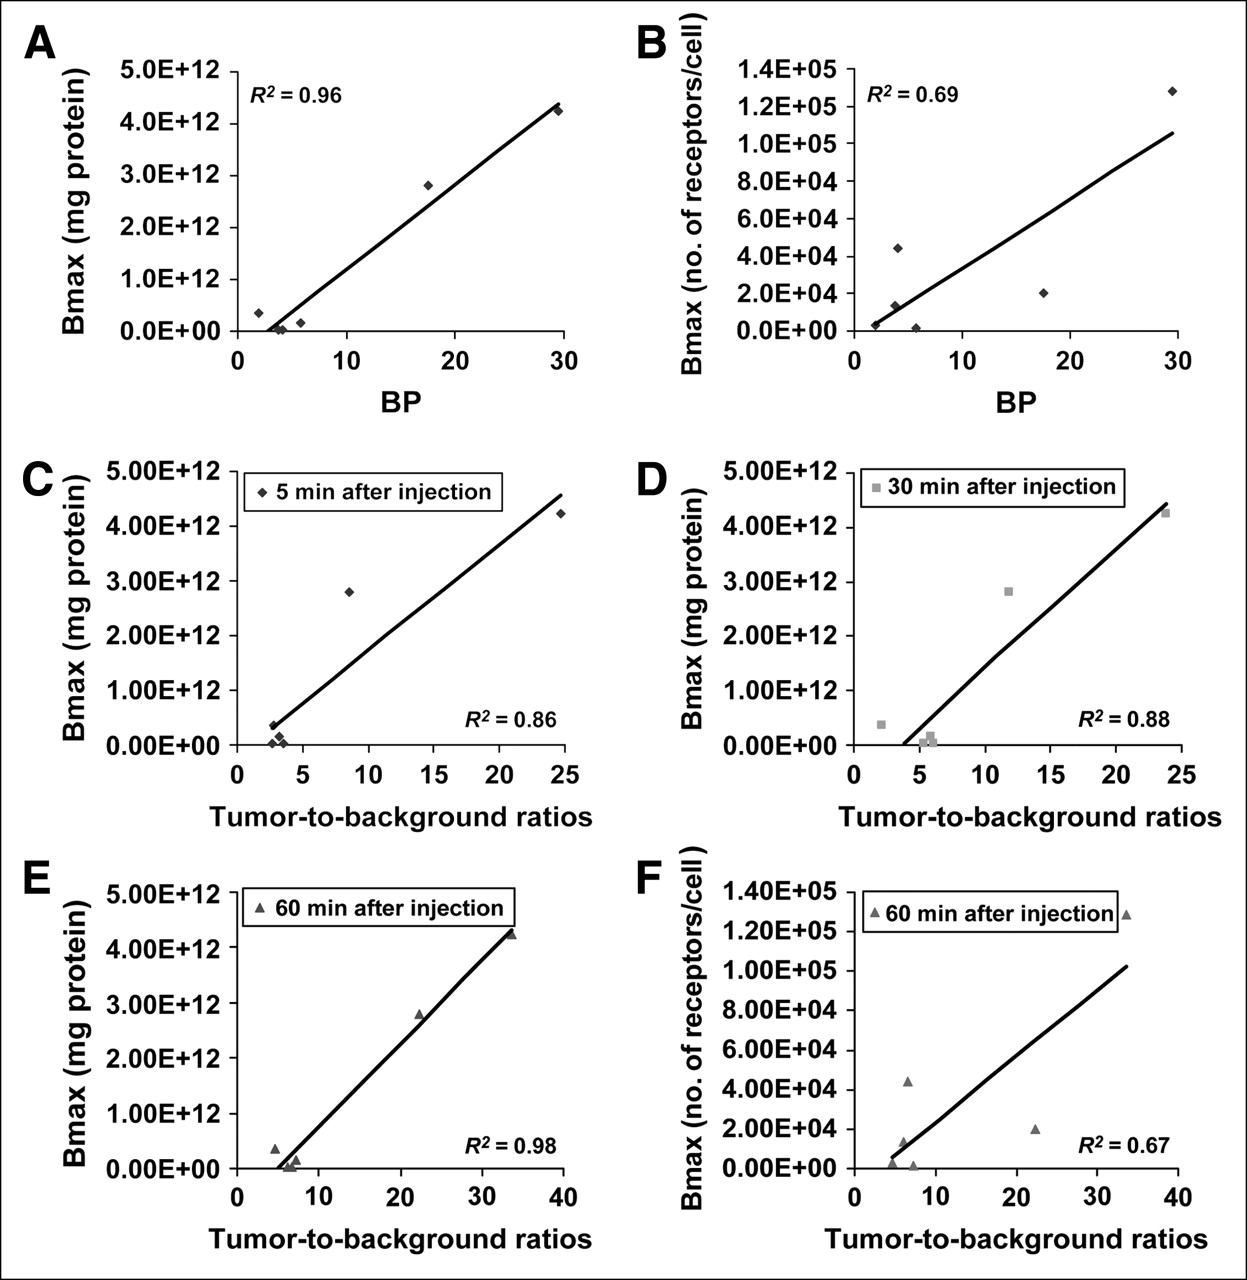
- FIGURE 6.
Correlation analysis is shown between tumor tissue receptor density (number of receptors/mg protein measured from SDS-PAGE/autoradiography using 125I-echistatin as radioligand) vs. BP (calculated from Logan plot transformation of dynamic microPET data) (R2 = 0.96) (A); tumor cell integrin expression (number of receptors/cell measured from whole-cell receptor-binding assay) vs. BP (R2 = 0.69) (B); tumor tissue receptor density vs. tumor-to-background ratios (calculated from time–activity curves derived from dynamic microPET). Coefficient of determination R2 is about 0.86, 0.87, and 0.98 at 5, 30, and 60 min after injection of 18F-FRGD2, respectively (C–E); tumor cell receptor density vs. tumor-to-background ratio at 60 min after injection of 18F-FRGD2. Coefficient of determination R2 is 0.67 (F). Data derived from 6 tumor models (U87MG, C6, MDA-MB-435, PC-3, NCI-H1975, and A549) illustrate excellent linear relationship between tumor tissue receptor density vs. BP and tumor tissue receptor density vs. tumor-to-background ratio at 1 h after injection. (Reprinted with permission of BioTechniques to reproduce parts of Figure 6.)


Tables
- TABLE 1
Receptor Density for U87MG, MDA-MB-435, C6, PC-3, NCI-H1975, and A549 Tumor Cells Determined by Cell-Binding Assay (n = 3) and Corresponding Tumor Tissues Measured by Ex Vivo SDS-PAGE/Autoradiography
Tumor type Cell receptor density (no. of receptors/cell) Tumor receptor density (no. of receptors/mg protein) U87MG (1.28 ± 0.46) × 105 4.24 × 10¹² MDA-MB-435 (1.99 ± 0.26) × 104 2.80 × 10¹² C6 (1.48 ± 0.28) × 103 1.51 × 10¹¹ PC-3 (2.76 ± 0.95) × 103 3.58 × 10¹¹ NCI-H1975 (4.42 ± 0.59) × 104 2.35 × 10¹⁰ A549 (1.34 ± 1.25) × 104 1.75 × 10¹⁰ - TABLE 2
Extraction Efficiency and Elution Efficiency Data and HPLC Analysis of Soluble Fraction of Tissue Samples at 60 Minutes After Injection
Fraction Blood Urine Liver Kidney U87MG Extraction efficiency (%) Unsoluble fraction* 6.9 ND 12.6 16.5 21.7 Soluble fraction† 93.1 ND 87.4 83.5 78.3 Elution efficiency (%) Nonretained fraction‡ 2.1 0.2 37.1 14.5 15.2 Wash water§ 0.6 0.7 3.0 1.6 3.0 Acetonitrile eluent¶ 97.2 99.1 59.9 83.8 81.8 HPLC analysis (%) Intact tracer 90.6 95.5 93.5 87.8 79.9 ↵* Amount of activity that was retained in pellets.
↵† Amount of activity that was extracted to PBS solution.
↵‡ Amount of activity that could not be trapped on C18 cartridge.
↵§ Amount of activity that was eluted from C18 cartridge using 2 mL water.
↵¶ Amount of activity that was eluted from C18 cartridge using 2 mL acetonitrile with 0.1% TFA.
ND = not determined.


Jump to section
Related Articles
Cited By...
- 18F-FPRGD2 PET/CT Imaging of Integrin {alpha}v{beta}3 in Renal Carcinomas: Correlation with Histopathology
- Integrin-Targeted Molecular Imaging of Experimental Abdominal Aortic Aneurysms by 18F-labeled Arg-Gly-Asp Positron-Emission Tomography
- In Vivo PET/CT in a Human Glioblastoma Chicken Chorioallantoic Membrane Model: A New Tool for Oncology and Radiotracer Development
- Interrogating Tumor Metabolism and Tumor Microenvironments Using Molecular Positron Emission Tomography Imaging. Theranostic Approaches to Improve Therapeutics
- Specific biomarkers of receptors, pathways of inhibition and targeted therapies: pre-clinical developments
- Monitoring Tumor Response to Antiangiogenic Sunitinib Therapy with 18F-Fluciclatide, an 18F-Labeled αV{beta}3-Integrin and αV{beta}5-Integrin Imaging Agent
- 18F-FPPRGD2 and 18F-FDG PET of Response to Abraxane Therapy
- PET of Malignant Melanoma Using 18F-Labeled Metallopeptides
- Noninvasive Imaging of {alpha}V{beta}3 Function as a Predictor of the Antimigratory and Antiproliferative Effects of Dasatinib
- Engineered Knottin Peptides: A New Class of Agents for Imaging Integrin Expression in Living Subjects
- Monoclonal antibody 14C5 targets integrin {alpha}v{beta}5
- Multimodality Molecular Imaging of Tumor Angiogenesis
- Integrin-targeted imaging and therapy with RGD4C-TNF fusion protein
- Preparation of a Promising Angiogenesis PET Imaging Agent: 68Ga-Labeled c(RGDyK)-Isothiocyanatobenzyl-1,4,7-Triazacyclononane-1,4,7-Triacetic Acid and Feasibility Studies in Mice
- Imaging of VEGF Receptor in a Rat Myocardial Infarction Model Using PET
- 18F-Labeled BBN-RGD Heterodimer for Prostate Cancer Imaging
- Application of PET/CT in the Development of Novel Anticancer Drugs
- microPET of Tumor Integrin {alpha}v{beta}3 Expression Using 18F-Labeled PEGylated Tetrameric RGD Peptide (18F-FPRGD4)
- Use of a Peptide Derived from Foot-and-Mouth Disease Virus for the Noninvasive Imaging of Human Cancer: Generation and Evaluation of 4-[18F]Fluorobenzoyl A20FMDV2 for In vivo Imaging of Integrin {alpha}v{beta}6 Expression with Positron Emission Tomography
- Small-Animal PET of Tumor Angiogenesis Using a 76Br-Labeled Human Recombinant Antibody Fragment to the ED-B Domain of Fibronectin
- 64Cu-Labeled Tetrameric and Octameric RGD Peptides for Small-Animal PET of Tumor {alpha}v{beta}3 Integrin Expression
- Small-Animal PET of Melanocortin 1 Receptor Expression Using a 18F-Labeled {alpha}-Melanocyte-Stimulating Hormone Analog
- PET Imaging of Colorectal Cancer in Xenograft-Bearing Mice by Use of an 18F-Labeled T84.66 Anti-Carcinoembryonic Antigen Diabody
- PET of Vascular Endothelial Growth Factor Receptor Expression
- Favorable Biokinetic and Tumor-Targeting Properties of 99mTc-Labeled Glucosamino RGD and Effect of Paclitaxel Therapy
- How molecular imaging is speeding up antiangiogenic drug development
- In vitro and In vivo Characterization of 64Cu-Labeled AbegrinTM, a Humanized Monoclonal Antibody against Integrin {alpha}v{beta}3
- Positron Emission Tomography As an Imaging Biomarker
- A Thiol-Reactive 18F-Labeling Agent, N-[2-(4-18F-Fluorobenzamido)Ethyl]Maleimide, and Synthesis of RGD Peptide-Based Tracer for PET Imaging of {alpha}v{beta}3 Integrin Expression