


Abstract
Myocardial infarction (MI) leads to left ventricular (LV) remodeling, which leads to the activation of growth factors such as vascular endothelial growth factor (VEGF). However, the kinetics of a growth factor's receptor expression, such as VEGF, in the living subject has not yet been described. We have developed a PET tracer (64Cu-DOTA-VEGF121 [DOTA is 1,4,7,10-tetraazadodecane-N,N′,N″,N‴-tetraacetic acid]) to image VEGF receptor (VEGFR) expression after MI in the living subject. Methods: In Sprague–Dawley rats, MI was induced by ligation of the left coronary artery and confirmed by ultrasound (n = 8). To image and study the kinetics of VEGFRs, 64Cu-DOTA-VEGF121 PET scans were performed before MI induction (baseline) and on days 3, 10, 17, and 24 after MI. Sham-operated animals served as controls (n = 3). Results: Myocardial origin of the 64Cu-DOTA-VEGF121 signal was confirmed by CT coregistration and autoradiography. VEGFR specificity of the 64Cu-DOTA-VEGF121 probe was confirmed by in vivo use of a 64Cu-DOTA-VEGFmutant. Baseline myocardial uptake of 64Cu-DOTA-VEGF121 was minimal (0.30 ± 0.07 %ID/g [percentage injected dose per gram of tissue]); it increased significantly after MI (day 3, 0.97 ± 0.05 %ID/g; P < 0.05 vs. baseline) and remained elevated for 2 wk (up to day 17 after MI), after which time it returned to baseline levels. Conclusion: We demonstrate the feasibility of imaging VEGFRs in the myocardium. In summary, we imaged and described the kinetics of 64Cu-DOTA-VEGF121 uptake in a rat model of MI. Studies such as the one presented here will likely play a major role when studying pathophysiology and assessing therapies in different animal models of disease and, potentially, in patients.
- myocardial infarction
- angiogenesis
- vascular endothelial growth factor (VEGF)
- VEGF receptor (VEGFR)
- PET
- 64Cu
Myocardial infarction (MI), one of the most significant consequences of coronary artery disease (CAD), leads to an upregulation of different growth factors (1,2) that can lead to tissue remodeling. Vascular endothelial growth factor (VEGF) is the most prominent member of a family of growth factors that has been strongly associated with angiogenic stimuli in different pathophysiologic situations (3–8) and likely plays a role in left ventricular (LV) remodeling after MI. Previous studies have shown that MI leads to an initial increase in the expression of VEGF and subsequent increase in the expression of the VEGF receptors (VEGFRs) (1,9).
Currently, most of the information we have with regard to biologic pathways involved in myocardial LV remodeling after MI derives from ex vivo tissue analysis (1,2,9). Study of biologic pathways in the living subject would permit a more physiologic assessment of these pathways as well as longitudinal monitoring of changes that may occur. However, until recently, it was not possible to assess biologic pathways in the living subject. Advances in the development of molecular imaging probes have allowed scientists to start addressing these questions (10–12). Recently, efforts have been made to develop new probes to image and study biologic pathways in the living subject after MI. Using molecular imaging strategies, investigators have shown that after MI there is an upregulation of matrix metalloproteinases (MMPs), in particular MMP-2 and MMP-9 (13,14). Furthermore, significant efforts have been made to image some of the effects of LV remodeling after MI, such as myocardial neovascularization. Specifically, Meoli et al. have demonstrated an increased expression of αvβ3 integrin (a transmembrane protein that is only expressed in newly formed vessels) after MI (15). In addition, using 111In-VEGF121, Lu et al. showed an increase in VEGF expression in ischemic muscle (16). However, the biologic pathways that underlie the remodeling response after MI remain to be determined. To better define the factors that may be involved in the neovascularization response after MI, our laboratory has recently developed a PET probe that binds to VEGFRs in the living animal (17). We have recently shown, using small-animal tumor models, the feasibility of assessing the presence of VEGFR in normal and disease states (17). The use of noninvasive imaging modalities will permit us, for the first time, to monitor receptor expression in the intact subject.
Thus, we hypothesize that MI will be associated with an increase in the expression of VEGFR and that such expression can be serially monitored using PET.
MATERIALS AND METHODS
Protocol Design
Protocols were approved by the Stanford Animal Research Committee and conformed with the Guide for the Care and Use of Laboratory Animals (18). Animals were divided into 2 groups: sham operated (n = 3) and MI (n = 8). On day −4, animals underwent high-resolution ultrasound for assessment of baseline cardiac function. On day 0, coronary artery ligation was induced in MI animals, whereas control animals where sham operated. Three days after surgery, cardiac function was reevaluated to confirm the presence and to assess the extent of MI. Dedicated small-animal PET (Siemens Medical Solutions, Inc.) imaging was performed on days −4, 3, 10, 17, and 24 after the induction of MI. At different time points, animals were euthanized and tissue was harvested for ex vivo studies (for histology and autoradiography).
Induction of MI
Induction of MI was done as described earlier by our laboratory (19). Adult female Sprague–Dawley rats (weight, 150–200 g; Charles River Laboratories) were used for this study. On the day of surgery, anesthesia was induced with isoflurane (5%) and the animals were intubated for mechanical ventilation. The anesthesia was then maintained with isoflurane (2%). MI was induced by ligation of the left anterior descending coronary artery 2–3 mm from the tip of the left auricle with a 7-0 polypropylene suture. This resulted in myocardial blanching and ST-segment elevation on an electrocardiogram monitor (EC-60 model; Silogic). In the sham-operated animals, a suture was placed in the myocardium (without ligating the left coronary artery).
Assessment of LV Contractility with Echocardiography
Cardiac function was assessed as described (19). Briefly, rats received isofluorane (2%) for general anesthesia and were placed on the scanning table. Echocardiographic images were obtained using a dedicated small-animal high-resolution-imaging unit and a 30-MHz linear transducer (Vevo 770; Visualsonics) (20). Using the parasternal short-axis view, LV end-diastolic and LV end-systolic diameters (LVEDD and LVESD, respectively) were measured, and LV fractional shortening was calculated as = (LVEDD − LVESD)/LVEDD × 100, as described. All measurements were averaged on 3 consecutive cardiac cycles (19).
PET Probe Synthesis
Radiosynthesis of 64Cu-DOTA-VEGF121.
All commercially available chemical reagents were used without further purification. DOTA (1,4,7,10-tetraazadodecane-N,N′,N″,N‴-tetraacetic acid) was purchased from Macrocyclics, Inc., and Chelex 100 resin (50–100 mesh) was purchased from Aldrich. PD-10 columns were purchased from GE Healthcare. 64Cu was obtained from the University of Wisconsin–Madison.
The detailed procedure for the synthesis of 64Cu-DOTA-VEGF121 has been reported earlier (17). DOTA-VEGF121 was purified using a PD-10 column and concentrated by Centricon filter units (Ultracel YM-10; Millipore). 64Cu labeling was performed in 0.1 M sodium acetate buffer (NaOAc, pH 6.5) at 40°C using 10 μg of DOTA-VEGF121 per 37 MBq (mCi) of 64Cu. The radiolabeling yield of 64Cu-DOTA-VEGF121 was 87.4% ± 3.2%, with a specific activity of 3.2 ± 0.1 GBq/mg and a radiochemical purity of >98%. To determine the specificity of this probe for the VEGFR we performed cell-binding assays. The detailed procedure for the cell-binding assay has been reported earlier (17,21,22). Receptor-binding affinity of VEGF121 and DOTA-VEGF121 was analyzed by the porcine endothelial cells (PAE)/KDR cell-binding assay using 125I-VEGF165 as the radioligand. To determine the serum stability, 64Cu-DOTA-VEGF121 was incubated with complete rat serum at 37°C for up to 4 h. At different time points, aliquots of the mixture were injected onto an analytic high-performance liquid chromatography (HPLC) system (Vydac protein C4 column 214TP54; flow rate, 1 mL/min). The radioactive peaks of 64Cu and 64Cu-DOTA-VEGF121 were each integrated to calculate the percentage of intact tracer.
Radiosynthesis of 18F-FDG.
18F-FDG synthesis was performed at the Stanford Cyclotron Unit, as described (23).
Small-Animal PET Scanning
Scanning was done using methods described earlier (19). Animals were anesthetized with isofluorane (2%) and injected with approximately 37 MBq (1 mCi) of 64Cu-DOTA-VEGF121 via the tail vein and allowed to recover. To determine the best signal-to-background ratio, animals were scanned at 1, 4, 18, and 24 h after injection of the tracer. At the time of scanning, animals were anesthesized with isofluorane (2%) and prone positioned on the microPET R4 rodent model scanning gantry (Siemens Medical Solutions, Inc.). The scanner has a computer-controlled bed and 10.8-cm transaxial and 8-cm axial fields of view (FOVs). The voxel size was 0.845 mm on a side, and the full width at half maximum was 1.66, 1.65, and 1.84 mm for tangential, radial, and axial orientations, respectively. The scanner has no septa and operates exclusively in the 3-dimensional list mode. A 15-min static acquisition was performed with the mid thorax in the center of the FOV, and images were reconstructed using a filtered backprojection (FBP) algorithm. Uptake was calculated as the percentage injected dose per gram (%ID/g) of tissue (19,24,25) using the AMIDE software (26). In each scan, 3 different regions of interest (ROIs), 2 mm in diameter, were drawn over the myocardial uptake within the infarcted area, and the mean %ID/g of tissue was averaged. No correction was performed for partial-volume effects. In addition, signal from the infarcted area was compared with the contralateral myocardium (at the septal level), which was taken as background signal, and expressed as the signal-to-background ratio.
To confirm the myocardial origin of the 64Cu-DOTA-VEGF121–detected signal, we performed viability studies using 18F-FDG (19,27,28). Immediately after the 64Cu-DOTA-VEGF121 scan, animals were kept in the scanning gantry (for image coregistration) and injected with 18.5 MBq (500 μCi) of 18F-FDG (Stanford Cyclotron Unit). One hour after 18F-FDG injection, a 15-min static acquisition was performed with the mid thorax in the center of the FOV, and images were reconstructed using a FBP algorithm (19,24,25).
microCT Scanning
To anatomically localize the tracer signal obtained using PET, animals from both groups were also scanned in a microCT scanner (eXplore RS MicroCT System; GE Healthcare). Immediately after PET, and using fiducial markers for coregistration, animals were transported to the microCT scanning gantry, positioned, and scanned at a voxel resolution of 97 μm (scanning time, 7 min). Images were reconstructed using built-in software (Microview; GE Healthcare). CT and PET datasets were loaded into AMIDE (26), and fiducial markers were coregistered for alignment of datasets.
Validation of VEGF Probe Specificity and Receptor Expression
Mutant Studies.
To test the specificity of the 64Cu-DOTA-VEGF121, we designed a VEGFmutant that does not bind to VEGFR-2. This VEGFmutant was generated through recombinant DNA technology by mutating the amino acid residues involved in VEGFR binding (29). The amino acid residues at positions 63, 64, 67, 82, 83, and 84 were replaced with alanine. 64Cu-DOTA-VEGFmutant was prepared using the same procedure as that used for 64Cu-DOTA-VEGF121. The radiolabeling yield was 93%, with a specific activity of 3.3 ± 0.6 GBq/mg and a radiochemical purity of >98%. The 64Cu-DOTA-VEGFmutant was administered to post-MI rats following the same imaging protocol as that for the experimental and sham-operated group.
Autoradiography.
To further confirm that the signal obtained in PET was of myocardial origin, immediately after scanning animals (n = 3 in each group) were euthanized and the heart was harvested (on day 3). Heart samples were frozen on dry ice and 30-μm slices were obtained (Bright 5030/WD/MR cryomicrotome; Hacker Instruments) and exposed for 6–7 h on a Phosphoimager plate (Perkin Elmer), developed in a Cyclone (Perkin Elmer), and read using Optiquant software (Packard Instrument Co.) (17).
VEGFR Immunostaining.
Myocardial frozen tissue slices (5-μm thick) were fixed with ice-cold acetone for 10 min and dried in air for 30 min. The slices were rinsed with phosphate-buffered saline for 2 min and blocked with 10% donkey serum for 30 min at room temperature. The slices were incubated with rabbit antirat VEGFR-2 antibody overnight at 4°C and visualized using Cy3-conjugated donkey antirat secondary antibody (1:200; Jackson ImmunoResearch Laboratories, Inc.). For VEGFR-1 staining, the tissue slices were incubated with rabbit antirat VEGFR-1 antibody (1:50; Lab Vision Corp.) at room temperature for 1 h and visualized with Cy3-conjugated donkey antirabbit secondary antibody (1:200; Jackson ImmunoResearch Laboratories, Inc.) (17). Immunofluorescence was visualized in an Axiovert 200 M microscope (Carl Zeiss) using a Ds-red filter set (excitation, 545 nm; emission, 620 nm).
Statistical Analysis
Data are expressed as mean ± SEM. Statistical analysis used the unpaired Student t test with unequal variance (for comparison between sham-operated and MI animals) and the paired Student t test for comparison before and after MI. A P value < 0.05 was considered statistically significant.
RESULTS
General Characteristics/Assessment of Cardiac Function
There was no difference in weight or heart rate between sham (n = 3) and MI (n = 8) animals. At baseline (day: −4), animals from both groups had similar myocardial cardiac function, as assessed by fractional shortening (P = 0.17; Table 1). In the experimental group, MI induction led to a defect in 18F-FDG uptake, as assessed by PET (Fig. 1B, white arrow) and akinesis of the anterolateral wall with a significant decrease in cardiac function (assessed by M-mode high-resolution ultrasound on day 10 postoperatively; Fig. 1D and Table 1). On the other side, in sham-operated animals, there was no uptake defect in 18F-FDG PET (Fig. 1A), and cardiac function remained stable compared with baseline (P = 0.13; Fig. 1C and Table 1). The MI procedure had a mortality of 15%, similar to that reported by other investigators (19).
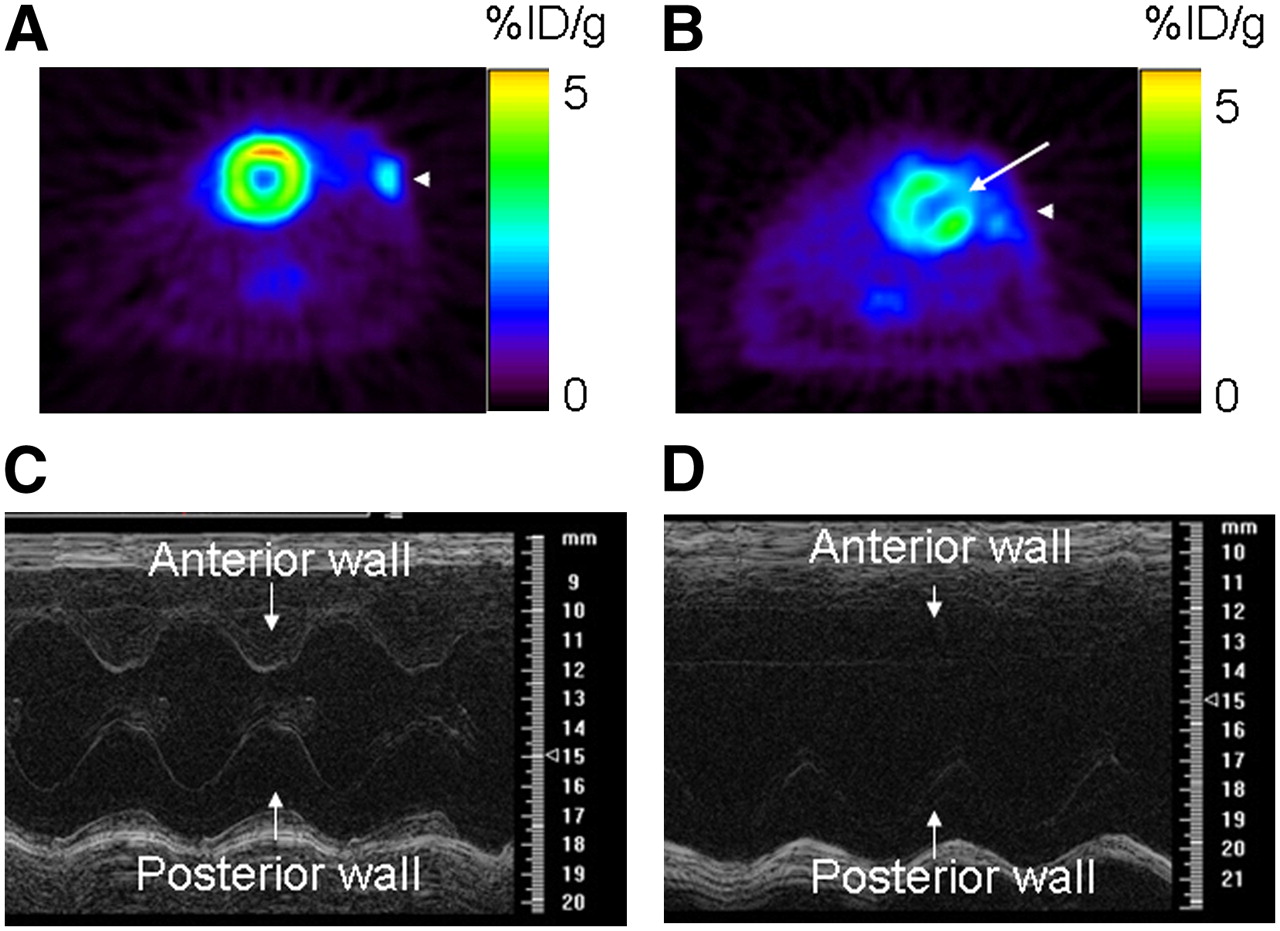
Cardiac functional assessment using 18F-FDG PET and high-resolution ultrasound (at frequency of 30 MHz). (Top) 18F-FDG PET of sham-operated animal (A) and animal after MI (B). Sham operation did not induce any 18F-FDG defect, whereas MI was associated with medium-sized defect in anterolateral wall (white arrow). (Bottom) M-mode ultrasound at midventricle level in sham-operated animal (C) and animal after MI (D). After MI, there was akinesis of anterolateral wall and significant decrease in fractional shortening compared with that of sham-operated animals.
General Group Characteristics at Both Baseline and After Intervention (Either Sham Operation or MI)
Radiolabeling of 64Cu-DOTA-VEGF121 and 64Cu-DOTA-VEGFmutant
64Cu-DOTA-VEGF121 was stable in rat serum, having at least 75% stability 1 h after incubation in rat serum and remaining stable for 4 h, with 3%–5% free 64Cu, and the rest (20%) was composed of partial compound and metabolites. The binding of VEGF121 and DOTA-VEGF121 to endothelial cells expressing VEGFR-2 was assessed using 125I-VEGF165 as the radioligand. The 50% inhibitory concentration (IC50) values were 1.11 and 1.59 nmol/L for VEGF121 and DOTA-VEGF121, respectively. The IC50 values for VEGF121 and VEGFmutant to PAE transfected with VEGFR-1 were 5.4 and 11.3 nmol/L, respectively. The IC50 for VEGF121 to PAE-VEGFR-2 cells was 1.5 nmol/L, whereas the IC50 for the VEGFmutant was in excess of 10 μmol/L. These data show that the VEGFmutant does not bind to VEGFR-2 and only partially binds to VEGFR-1, providing evidence of the specificity of the experimental probe used in this study (64Cu-DOTA-VEGF121).
Assessment of Myocardial VEGFR Expression in Living Rats
To localize the anatomic region of the 64Cu-DOTA-VEGF121 PET–detected signal, we performed microCT on MI animals. The top left panel of Figure 2 shows the microCT image, anatomically separating the myocardium from the chest wall, whereas the top right image shows a representative image of the 64Cu-DOTA-VEGF121 PET image from the same animal (day 3 after MI). In the top center panel, the fused image clearly demonstrates the myocardial origin of the 64Cu-DOTA-VEGF121 signal.

Myocardial origin of 64Cu-DOTA-VEGF121 PET signal after MI. (Top) Representative coregistered images of microCT (left), PET (right), and fused PET/CT image (center) in MI animal clearly demonstrates that the 64Cu-DOTA-VEGF121 signal detected with PET corresponds to anterolateral myocardium (PET and fused images, red arrow) and clearly separated from intercostal muscle layer (microCT image, white arrow). There is also increased uptake in area of surgical wound (PET image, arrowhead). (Bottom) Representative images of 64Cu-DOTA-VEGF121 (left), 18F-FDG (right), and 64Cu-DOTA-VEGF121/18F-FDG fused image (middle). 18F-FDG scan shows that coronary artery ligation resulted in lack of 18F-FDG uptake (yellow arrow) and that uptake of 64Cu-DOTA-VEGF121 occurs in areas supplied by ligated coronary artery (turquoise arrow). Fusion of both scans results in complementation of 18F-FDG and 64Cu-DOTA-VEGF121 signals. There is also increased uptake in area of surgical wound (arrowhead).
As mentioned earlier, in MI animals 18F-FDG (for assessment of myocardial viability; Fig. 2, bottom left) was injected immediately after the 64Cu-DOTA-VEGF121 scan (Fig. 2, bottom right). 18F-FDG and 64Cu-DOTA-VEGF121 images were fused (Fig. 2, bottom center) showing that the 64Cu-DOTA-VEGF121 myocardial signal matched extremely well with the areas of infarcted myocardium, as evidenced by a lack of 18F-FDG uptake. On the other hand, in sham-operated animals, there were no infarcted areas, and thus no lack of 18F-FDG uptake (Fig. 1A). Furthermore, postoperatively, animals (both sham and MI groups) had increased uptake of 18F-FDG at the level of the surgical wound (Figs. 1A and 1B and Fig. 2, arrowheads), consistent with an inflammatory response.
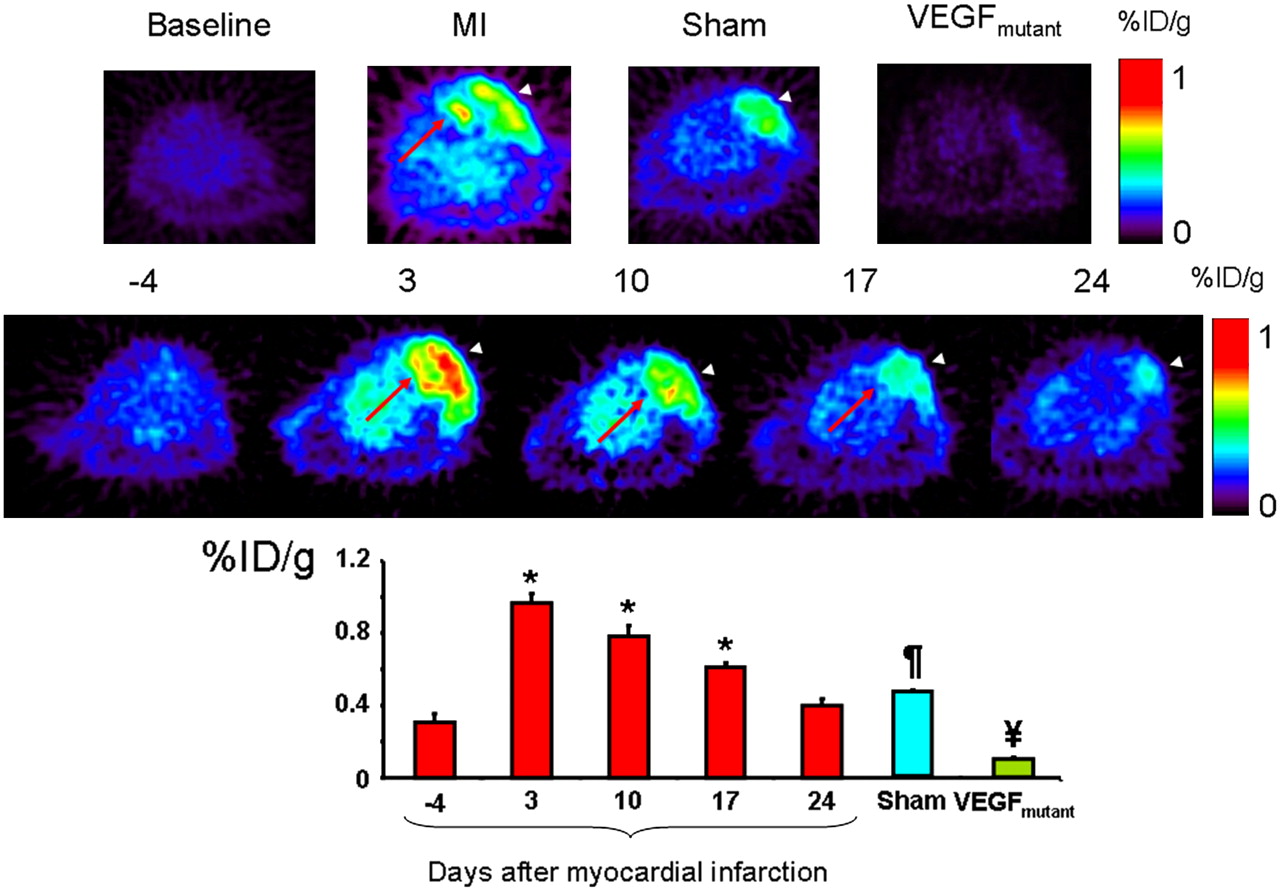
The best 64Cu-DOTA-VEGF121 signal-to-background ratio was obtained 1 h after injection of the tracer and, thus, was used for signal quantification and analysis in this study (1 h, 2.60 ± 0.30; 4 h, 2.43 ± 0.46; no consistent signal could be detected at the 18- and 24-h scans). The top panel of Figure 3 shows representative images of baseline (left, 4 d before MI) with minimal probe uptake and MI animals (middle, left) with probe uptake in the chest wall (white arrowhead), but most importantly, a clearly distinct signal, representing myocardial probe uptake (red arrow). In sham-operated animals (middle, right), the white arrowhead shows probe uptake only at the level of the chest wall-product of the open thoracotomy procedure. The right panel shows a representative VEGFmutant scan with minimal uptake of the probe. The middle panel of Figure 3 shows representative images of the uptake of 64Cu-DOTA-VEGF121 over time, illustrating the increase in uptake on day 3 after MI and the decrease in probe uptake over time. The bottom panel of Figure 3 shows the quantitative analysis from all groups. On day −4 (before MI induction or sham operation), there was no significant myocardial uptake of 64Cu-DOTA-VEGF121 (0.30 ± 0.07 %ID/g; Fig. 3, top left). MI induction was associated with a significant increase in uptake of 64Cu-DOTA-VEGF121 in the anterolateral wall of the myocardium (MI, 0.97 ± 0.05 %ID/g; P < 0.05 compared with baseline, Fig. 3). 64Cu-DOTA-VEGF121 uptake after MI was also significantly different compared with sham (P = 0.01, both on day 3 after intervention) and VEGFmutant (P = 0.001). Similarly to 18F-FDG, animals from both groups had a comparable increase in uptake of 64Cu-DOTA-VEGF121 at the level of the surgical wound (Fig. 3 top panel, white arrowhead), probably reflecting an angiogenic response during the wound healing process (sham, 1.00 ± 0.12 %ID/g; MI, 1.03 ± 0.06 %ID/g; P = 0.39).

(Top) Representative images at baseline (left), animals after MI (middle left), and sham-operated animals (middle right) show difference in myocardial uptake in MI animals compared with baseline and sham animals. Red arrow shows the 64Cu-DOTA-VEGF121 signal from myocardium (seen only in MI animals), and arrowheads show 64Cu-DOTA-VEGF121 signal from the surgical wound (muscle layer), which is present in both sham-operated and MI animals. Right panel shows typical image acquired using VEGFmutant, with minimal uptake, supporting the specificity of 64Cu-DOTA-VEGF121 probe for VEGFRs. (Middle) Representative images correspond to 1 animal of MI group illustrating uptake of 64Cu-DOTA-VEGF121 over time (in days after induction of MI), clearly showing time-dependent effect on uptake of 64Cu-DOTA-VEGF121. Red arrow points to myocardial upake, whereas white arrowhead points to chest wall muscular layer uptake. (Bottom) Quantification of 64Cu-DOTA-VEGF121 after MI over time, expressed in %ID/g of tissue. 64Cu-DOTA-VEGF121 uptake was highest on day 3 postoperatively (compared with baseline, day −4) and continues to be elevated until day 17 postoperatively. 64Cu-DOTA-VEGF121 uptake was also significantly different compared with sham-operated animals and VEGFmutant. *P < 0.05 compared with baseline; ¥P < 0.05 compared with sham and 64Cu-DOTA-VEGF121; ¶P < 0.05 compared with VEGFmutant and 64Cu-DOTA-VEGF121.
In summary, the PET 64Cu-DOTA-VEGF121 myocardial uptake was higher on day 3 postoperatively and decreased over time until it reached baseline levels on day 24 (Fig. 3, bottom). Importantly, the increased tracer uptake was seen only in the areas supplied by the ligated coronary artery and not in remote areas.
Validation of VEGF Specificity and Receptor Expression
VEGF Probe Specificity.
MI was induced in 4 animals using the approach described earlier and animals imaged on day 10 after MI with the 64Cu-DOTA-VEGFmutant. The uptake in the myocardial infarct zone (0.098 ± 0.008 %ID/g) or muscular chest wall was significantly lower than that of 64Cu-DOTA-VEGF121 at a comparable day after MI (0.78 ± 0.06 %ID/g, P < 0.05; Fig. 3, bottom panel). Such observation provides direct and critical evidence that the 64Cu-DOTA-VEGF121 is specific for the VEGFR.
Autoradiography.
Autoradiography of the explanted hearts after 64Cu-DOTA-VEGF121 PET clearly shows that the increase in signal observed with PET comes from the affected myocardium, as evidenced by increased activity in the anterolateral (AL) wall compared with the contralateral (CL) wall (MI: AL/CL wall, 5.24 ± 0.31; Fig. 4A, right). On the contrary, sham-operated animals had no difference in activity between the 2 regions (sham: AL/CL wall, 1.14 ± 0.02; Fig. 4A, left). These results show that the uptake observed is due to true tissue uptake rather than an artifact from changes in contractility of the LV.
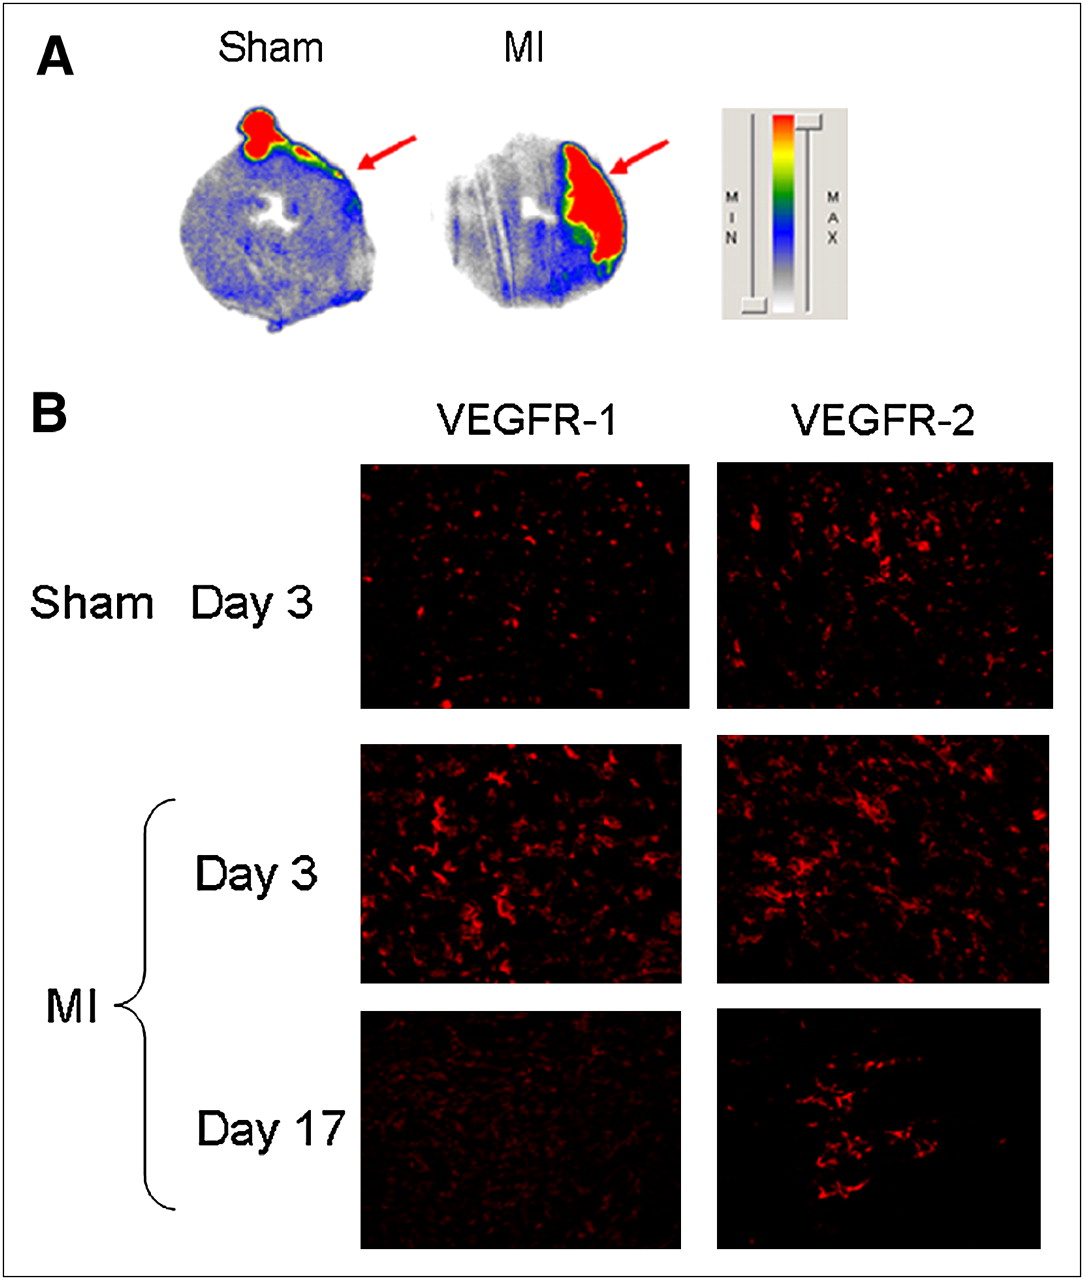
Ex vivo studies. (A) Autoradiography of 30-μm myocardial slices of both sham-operated (left) and MI (right) animals after injection of 64Cu-DOTA-VEGF121 shows increased signal in anterolateral wall of LV of MI animals, whereas no activity is detected in sham group. Red arrows point to area affected by ligated artery (anterolateral wall), clearly showing the myocardial origin of signal observed. (B) Immunofluorescence staining for VEGFR-1 (left) and VEGFR-2 (right) in sham-operated and MI animals (on days 3 and 17 after MI). MI is associated with marked increase in VEGFR-1 and VEGFR-2 immunostaining, which was higher than that of sham animals. VEGFR expression is higher on day 3 and diminishes over time, similar to what it is observed with PET. MIN = minimum; MAX = maximum.
VEGFR Immunostaining.
To further characterize the activation of the VEGFRs after MI, we performed immunofluorescence staining of myocardial tissue slices for VEGFR-1 and VEGFR-2 and observed an increase in the expression of VEGFR-1 and VEGFR-2 after MI compared with sham operation (Fig. 4B). Importantly, the expression of VEGFRs was more pronounced on day 3 and decreased over time (Fig. 4B), following a similar trend to what is seen with noninvasive PET imaging.
DISCUSSION
In the current study we imaged and described, in living subjects, the kinetics of VEGFRs in a rat model of MI. Use of noninvasive imaging strategies, such as the one presented here, that permit the study of biologic pathways in living subjects can provide invaluable in vivo information with regard to the pathobiology of CAD and, because of its noninvasive nature, has the potential to be translated to patients.
Several issues should be addressed with regard to the approach we used in this study. 64Cu has a relatively long half-life (t1/2 = 12.7 h), which precluded us from performing more frequent monitoring of VEGFR expression. In addition, the use of radioactive isotopes with a relatively long half-life is less translatable to patients. On the basis of the results of this study (the best signal-to-background ratio was obtained 1 h after probe delivery), future studies will likely benefit by using radioisotopes with shorter half-lives, such as 18F (t1/2 = 109 min) or 68Ga (t1/2 = 68 min). In that respect, either 68Ga or 18F will be a potential alternative as their half-lives are sufficiently short to provide reasonably low radiation exposure but long enough to allow for radiolabeling of VEGF121.
To image VEGFRs in this study, we used the VEGF121 protein as the substrate for the VEGFR. Previous studies have shown that VEGF121 has high affinity for both VEGFR-1 and VEGFR-2. Thus, on the basis of the in vivo results from this study we cannot conclude whether there is differential activation of VEGFRs after MI. Furthermore, it is also possible that part of the increased uptake observed after MI is due to an inflammatory response, which is a known response to MI (30,31). The intact fraction of 64Cu-DOTA-VEGF121 after incubation with rat serum is at least 75%, based on analytic HPLC, with a very small fraction (3%–5%) of free 64Cu. The remaining fraction (20%) was composed of metabolites and fragments of the tracer. Although they can possibly be taken up by inflammation, which may contribute to a certain fraction of the uptake in the infarct region, the majority will likely be cleared very rapidly on our previous studies using 64Cu-labeled small peptides (32). In addition, our in vivo mutant studies support the concept that the majority of the signal observed is due to the upregulation of VEGFRs and not to other issues, such as vascular protein leakage in a state of inflammation. Furthermore, it is important to note that changes in LV contractility between animals from different groups could act as a confounding variable in the analysis and should be taken into consideration when analyzing the results of this study. However, our ex vivo studies (in which LV contractility does not play a role in the observed uptake) using 125I-VEGF as the detection probe provide evidence of the myocardial location of the detected signal. In vivo mutant studies also demonstrate that the signal detected in MI rats was not due to factors such as increased in vivo regional perfusion but, rather, to an actual increase in the expression of the VEGFRs. Moreover, the increased expression in VEGFRs observed with immunohistochemistry in the myocardial infarcted areas also provides indirect evidence of the upregulation of VEGFRs in MI, with a decrease over time to levels that do not differ from baseline. However, note that, whereas immunohistochemistry is a qualitative methodology used for localization, the in vivo PET data are quantitative and, therefore, should be taken as a better assessment of the VEGFR expression in the myocardium after MI. Our observation corroborates the observations made by Li et al., who described a dynamic and differential activation of VEGFRs after MI (1). It should also be mentioned that no partial-volume correction was done in this proof-of-principle study; thus, its results should not be taken as absolute quantification but, rather, as proof of the increased expression of VEGFR after MI.
The present study used a rat model of MI, with permanent ligation of a coronary artery (19). We chose this model of disease because it allows us to study the remodeling effect that infarction has on the myocardium, without confounding variables (e.g., such as reperfusion injury) that may be observed with variants of this model (transient coronary ligation followed by reperfusion) (33). However, although the permanent ligation animal model (1,19) is commonly used as a surrogate of CAD and MI seen in patients, it may not resemble the actual disease observed in humans. Thus, results from this study should not be extrapolated directly to what occurs in patients but seen, rather, as a first and necessary step toward developing novel imaging modalities that will lead to a better understanding of CAD. Future studies from our laboratory will focus on the translation of this imaging approach to a larger animal model (e.g., porcine) as a preamble for its use in patients. To our knowledge, this imaging approach will be the first one to allow investigation of the expression of growth factor receptors in large animals and then in patients in a noninvasive and longitudinal manner. The understanding of the pathobiology of CAD in patients is critical for the development of novel therapeutic strategies and to better define the role of those that are currently available. Specifically, imaging of the VEGFR has the potential to be used to accurately study the time line of the activation of growth factors in the intact patient during different stages of the disease (diagnosis/prognosis) as well as provide insight on the effects of different therapeutic strategies (e.g., gene/cell therapy).
CONCLUSION
We imaged and described the kinetics of 64Cu-DOTA-VEGF121 uptake in a rat model of MI. Use of molecular imaging strategies to study the biology of CAD and its consequences will be invaluable in providing information on the activation of different biologic pathways and, because of its potential application to patients, will help us to better understand CAD.
Acknowledgments
This research was supported in part by the Mayo Clinical Scholarship (Mayo Clinic College of Medicine, Rochester, MN) and by the Benedict Cassen Postdoctoral Fellowship (Education and Research Foundation for the Society of Nuclear Medicine). This work was also supported in part by grants NCI SAIRP, NHLBI 1 R01 HL078632, and NCI ICMIC CA114747 P50; The Clayton Foundation for Research; and grants NCI R21 CA102123, NIBIB R21 EB001785, DOD W81XWH-04-1-0697, W81XWH-06-1-0665, W81XWH-06-1-0042, and DAMD17-03-1-0143. We also thank the cyclotron team at the University of Wisconsin–Madison for 64Cu production and the Stanford cyclotron team (David Dick and Fred Chin) for 18F-FDG production.
Footnotes
-
COPYRIGHT © 2008 by the Society of Nuclear Medicine, Inc.
References
- Received for publication February 8, 2007.
- Accepted for publication December 6, 2007.


Jump to section
Related Articles
Cited By...
- PET Imaging of VEGFR-2 Expression in Lung Cancer with 64Cu-Labeled Ramucirumab
- Noninvasive Imaging in the Assessment of the Cardiopulmonary Vascular Unit
- A Tyrosine Kinase Inhibitor-Based High-Affinity PET Radiopharmaceutical Targets Vascular Endothelial Growth Factor Receptor
- Molecular Imaging of Vascular Endothelial Growth Factor Receptors in Graft Arteriosclerosis
- Cardiovascular Molecular Imaging: The Road Ahead
- Design of Targeted Cardiovascular Molecular Imaging Probes
- Approaches to Multimodality Imaging of Angiogenesis
- Positron Emission Tomography Imaging of Poststroke Angiogenesis
- The Year in Molecular Imaging
- Multimodality Cardiovascular Molecular Imaging, Part II