


Abstract
For many years the laboratory mouse has been used as the standard model for in vivo oncology research, particularly in the development of novel PET tracers, but the growth of tumors on chicken chorioallantoic membrane (CAM) provides a more rapid, low cost, and ethically sustainable alternative. For the first time, to our knowledge, we demonstrate the feasibility of in vivo PET and CT imaging in a U87 glioblastoma tumor model on chicken CAM, with the aim of applying this model for screening of novel PET tracers. Methods: U87 glioblastoma cells were implanted on the CAM at day 11 after fertilization and imaged at day 18. A small-animal imaging cell was used to maintain incubation and allow anesthesia using isoflurane. Radiotracers were injected directly into the exposed CAM vasculature. Sodium 18F-fluoride was used to validate the imaging protocol, demonstrating that image-degrading motion can be removed with anesthesia. Tumor glucose metabolism was imaged using 18F-FDG, and tumor protein synthesis was imaged using 2-18F-fluoro-l-tyrosine. Anatomic images were obtained by contrast-enhanced CT, facilitating clear delineation of the tumor, delineation of tracer uptake in tumor versus embryo, and accurate volume measurements. Results: PET imaging of tumor glucose metabolism and protein synthesis was successfully demonstrated in the CAM U87 glioblastoma model. Catheterization of CAM blood vessels facilitated dynamic imaging of glucose metabolism with 18F-FDG and demonstrated the ability to study PET tracer uptake over time in individual tumors, and CT imaging improved the accuracy of tumor volume measurements. Conclusion: We describe the novel application of PET/CT in the CAM tumor model, with optimization of typical imaging protocols. PET imaging in this valuable tumor model could prove particularly useful for rapid, high-throughput screening of novel radiotracers.
PET imaging has proved an indispensable tool in oncology research and in clinical oncology (1). 18F-FDG has been widely used to study tumor proliferation and metastasis in vivo, and radiotracers targeting specific proteins expressed on tumor cells are constantly under development (2). In recent years, there has been a substantial growth in the use of combined PET and CT imaging, both in the clinic and for small-animal research. This combination yields functional imaging data with useful anatomic information.
For many years the laboratory mouse has been used as the standard model for in vivo oncology research, particularly in the development of novel PET tracers. However, despite their wide use in oncology research, mouse models obviously require all usual aspects of animal husbandry, necessitating cost and taking up valuable lab space. In particular, rodent models can be limited in their usefulness by difficulty in obtaining exact measures of tumor progression (such as volume) (3). Ethical issues relating to animal suffering and public opinion are also of increasing concern (4). Clearly, an alternative could be useful.
The chicken chorioallantoic membrane (CAM) is a highly vascularized membrane located at the periphery of the chicken embryo, easily accessible by opening a hole in the egg shell (5). Via this access to the CAM, the chicken embryo has become a useful model for oncology research, including the study of metastasis (6–9) and evaluation of the efficacy of anticancer drugs (3,10,11). In a model of glioblastoma, U87-MG human glioblastoma cells are inoculated on the CAM, resulting in growth of tumors with histology very similar to glioblastoma multiforme in patients, with diffuse pleiomorphic infiltrate of fibrillar and stellate cells, with neoangiogenesis, edema, and areas of necrosis (5,12,13). The CAM model requires limited space, limits animal husbandry requirements, reduces costs, and is more ethically sustainable than mouse studies. Additionally, the CAM tumor model has the potential to be the ideal tool for the development and high-throughput screening of novel PET tracers with applications in oncology. Releasing this potential depends on the successful combination of the model with in vivo PET/CT, a combination that to the best of our knowledge has not previously been demonstrated.
Thus, the aim of this study was to apply in vivo PET/CT imaging, for the first time, in a human glioblastoma CAM model. Sodium 18F-fluoride (18F-NaF) was used to validate the combined PET/CT protocol, and tumor glucose metabolism and protein synthesis were imaged using 18F-FDG and 2-18F-fluoro-l-tyrosine (18F-TYR) in both static and dynamic PET imaging protocols.
MATERIALS AND METHODS
U87 Glioblastoma Cell Culture
A U87 glioblastoma cell line was cultured at 37°C and 5% CO2 in minimum essential medium supplemented with 10% fetal bovine serum, 2 mM glutamine, and 1 mM sodium pyruvate (Gibco; Invitrogen, Life Technologies).
U87 Glioblastoma on CAM
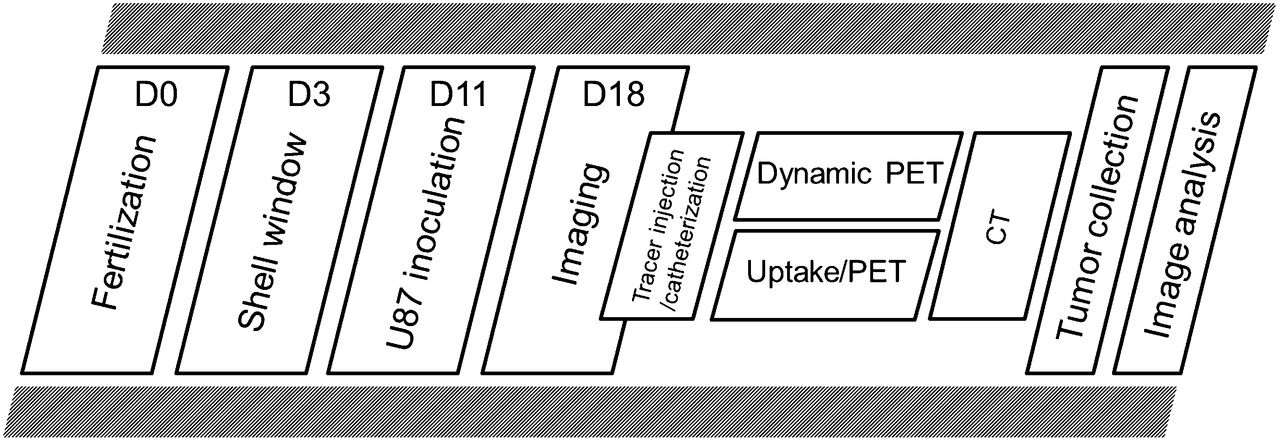
All experimental procedures and protocols used in this investigation were reviewed and approved by the Institutional Animal Care and Use Committee of the University of Liege. An illustrated version of the experimental workflow is shown in Figure 1. Chicken eggs were opened on the third day after fertilization by removal of 7.5 mL of albumin with a needle and syringe and cutting of a 2 × 1 cm window in the shell. Eggs were then sealed with Durapore tape (3M) and kept closed until the implantation day. A temperature of 37°C was constantly maintained, and humidity was maintained at 80%. At the 11th day after fertilization, the eggs were opened, the CAM was gently lacerated, and 5 × 10⁶ human U87 glioblastoma cells in 20 μL of culture medium were deposited within a plastic ring placed on the CAM. The shell window was covered, and the eggs were further incubated for an additional 7 d. At day 18, the tumors grown on the CAM were imaged, followed by tumor collection for manual volume measurement using calipers. After volume measurement, the tumors were fixed in a 4% paraformaldehyde solution (30 min) for further histologic analysis and confirmation of standard morphology (Supplemental Fig. 1; supplemental materials are available at http://jnm.snmjournals.org).

Graphical illustration of experimental workflow.
Radiochemistry
18F-NaF, 18F-FDG, and 18F-TYR were produced on site at the Cyclotron Research Center. 18F-NaF and 18F-FDG were obtained through standard, well-known, procedures (14,15). 18F-TYR was prepared from 2-formyl-5-methoxy-N,N,N-trimethylbenzenaminium trifluoromethanesulfonate following the process recently described for 6-18F-fluoro-l-dopa by Libert et al. (16). The high-performance liquid chromatography purification was conducted on an Xbridge C18 column from Waters (10 × 250 mm; 5 μm). The flow rate was 5 mL/min, and the mobile phase was aqueous acetic acid (0.1%) and ethanol (98.5/1.5).
The fraction containing 18F-TYR (5 mL) was collected into a vial containing 30 mL of NaCl 0.9%, 500 μL of NaCl 10%, and ascorbic acid (20 mg). The total synthesis time was 60 min, and the radiochemical yield (decay-corrected) was 50 ± 5%. The enantiomeric excess was 96% or greater and the specific activity 540 MBq/μmol (20 Ci/μmol) or more.
PET/CT Imaging
On day 18, the shell window was enlarged to allow direct injection of radiotracer (12.2 ± 4.5 MBq/egg in a volume of ∼200 μL) into a CAM blood vessel or catheterization of a CAM vessel for dynamic PET studies. Direct injections were performed under a stereomicroscope and with the aid of a 30-gauge needle attached to silicone tubing. The catheters were prefilled with heparinized saline (50 u/mL), and radiotracers were injected as a bolus over 30 s. During injection and catheterization, the egg was warmed on a heating pad limited to 37°C. For static imaging studies, the egg was returned to the incubator after tracer injection for a 30-min uptake period before imaging. Catheterization of CAM vessels was performed using custom-beveled PE10 tubing attached to a 30-gauge needle, and the syringe was prefilled with heparinized saline. A photograph illustrating the catheter in situ is shown in Supplemental Figure 2.
A Minerve cell system (Equipement Veterinaire Minerve) containing fiducial markers allowed incubation at 37°C during scanning, isoflurane anesthesia (2% in air), and reproducible positioning between modalities. To improve contrast between tumor and underlying structures in the CT data, an iodinated contrast agent (Iobitridol [Guerbet]; 35 mgI/mL in saline, 2 mL before 18F-FDG injection or catheterization) was added to the albumin. For dynamic PET scans, the end cap of the Minerve cell was removed to allow externalization of the catheter for tracer injection (Supplemental Fig. 3). To maintain the sealed environment, the cell was resealed around the exiting catheter with plastic film.
PET studies were performed on a Siemens Concorde Focus 120 microPET (Siemens Medical Solutions). The performance characteristics of this scanner have been reported previously (17,18). PET studies started with a 10-min transmission scan obtained using a 57Co point source with single-event acquisition mode with a 120- to 125-keV energy window. Transmission scanning was performed after 30 min tracer uptake in static imaging studies such that emission scanning started after 45 min of tracer uptake. For static studies, emission data were recorded in list mode for a total of 10 min. For dynamic imaging studies, tracers were injected immediately after the start of the dynamic acquisition protocol and list-mode data acquired for 60 min. Emission data were acquired with an energy window of 350–650 keV and a coincidence-timing window of 6 ns. For dynamic studies, data were reframed with a higher temporal resolution during the initial 10 min (6 × 5, 6 × 10, 3 × 20, 5 × 30, 5 × 60, 8 × 150, and 300 s to end). Images were reconstructed with all corrections except scatter using Fourier rebinning and filtered backprojection with a ramp filter cutoff at the Nyquist frequency. A total of 95 transaxial slices were obtained in a 256 × 256 matrix. The slice thickness was 0.796 mm, and the in-slice pixel size was 0.433 mm.
Micro-CT images were obtained using an eXplore 120 micro-CT (GE Healthcare) with a customized protocol (70 kV, 0.512 mAs, 360 views over 360°, continuous rotation) provided by the manufacturer. The performance characteristics of this scanner have been described previously (19). All data were reconstructed in isotropic voxels of 0.1 mm using the Feldkamp algorithm. The CT dose index 100 associated with a single field of view was 21.44 ± 0.32 mGy (20). Images were coregistered using PMOD (version 3.3; PMOD Technologies), guided by the fiducial markers.
Three-dimensional (3D) visualization of coregistered PET and CT data was used to explore the effectiveness of coregistration and aid localization of tracer uptake in tumor versus chick. For 3D segmentation, egg shell and contrast agent were manually masked to a value of −1,000 HU. Because of the similarity between HU of shell, bones, and contrast agent, automatic segmentation was not possible. The masked image was first filtered using a low-pass median filter (isotropic, 0.3 mm) for noise reduction and was then segmented on the basis of a threshold value (150 HU) using the PMOD (as above) 3D tool to create a surface representation of the skeleton. This allowed clear delineation of tracer uptake in chicken embryo and tumor. The coregistered PET image was overlaid, and a threshold-based volume was created. The threshold for each small-animal PET image varied because of differing injected activity and spatial tracer uptake.
To quantify tumor tracer uptake in dynamic studies, an automatic 3D isocontour detection method was used based on a seeding point in the PET image. The CT data were used to identify the tumor on the CAM and thus guide selection of the seeding point.
Measurement of Tumor Volume
Tumor volume was measured from the CT data using a pixel-based segmentation method (growing region algorithm implemented in Matlab software, version 7.7, http://www.mathworks.com). The volume measured in vivo was compared with a subsequent ex vivo measurement after dissection. The data were first filtered using a Wienner filter (kernel, 5 × 5 × 5 voxels) to reduce noise and variability between voxels belonging to the same structure. To limit segmentation errors, tumor segmentation was performed by selecting a seed voxel in the tumor, by defining a threshold based on the intensity distribution, and by setting a maximum distance in all image directions. The procedure is iterative and searches for voxels in the vicinity of the seed with intensity inside the range defined by the fixed threshold. This allowed generation of a binary mask representing the tumor and the coordinates of the polygon vertices enclosing the tumor-associated voxels from which tumor volume was calculated. The geometric accuracy of measurements from the CT120 system (GE Healthcare) has been studied in our lab, indicating an error of less than 0.3% (19,21). For further validation, the CT tumor volume measurement method described above was compared with an ex vivo manual method. In this manual method, the tumor was dissected from the CAM after imaging (and euthanasia) and measurements taken using a caliper. Tumor volume was estimated assuming an ellipsoid shape and using the formula V = 4/3 × π × (((l × w × h))/8), where l, w, and h are the length, width, and height, respectively, of the tumor.
RESULTS
Static Imaging with 18F-NaF, 18F-FDG, and 18F-TYR
18F-NaF was used for validation of the anesthesia protocol. The restriction of 18F-NaF to the bones facilitated clear assessment of the overlap between PET data and anatomic CT data. Motion between PET and CT scans would result in a mismatch between PET bone uptake and CT data. Coregistration of 18F-NaF PET and CT images revealed an excellent match between bone 18F-NaF uptake and bone structure in the CT image (Fig. 2). Motion during PET or CT due to ineffective anesthesia resulted in blurring in PET data and loss of contrast in CT data. An example of embryo motion and the resulting reduction in image quality (loss of contrast between bones and surrounding tissues) is shown in Supplemental Figure 4. 18F-FDG uptake was clear in the tumor, despite notably high uptake at the major joints in the embryo. Clear distinction of the uptake in joints from that in tumor was highly dependent on the anatomic CT information (Fig. 3). The high level of 18F-FDG uptake in the joints likely reflects high metabolic activity due to growth in the developing embryo. Tumor uptake of 18F-TYR was also evident (Fig. 4), but as for 18F-FDG, uptake was substantial in the embryo, making the CT data invaluable for correct delineation of tumor uptake from background. Delineation of the tumor, soft tissues of the embryo, and surrounding albumin or structures was greatly improved by the addition of iodinated contrast agent. The penetration of the contrast agent into the albumin directly between CAM and embryo provided clear delineation of the tumor (Fig. 5).
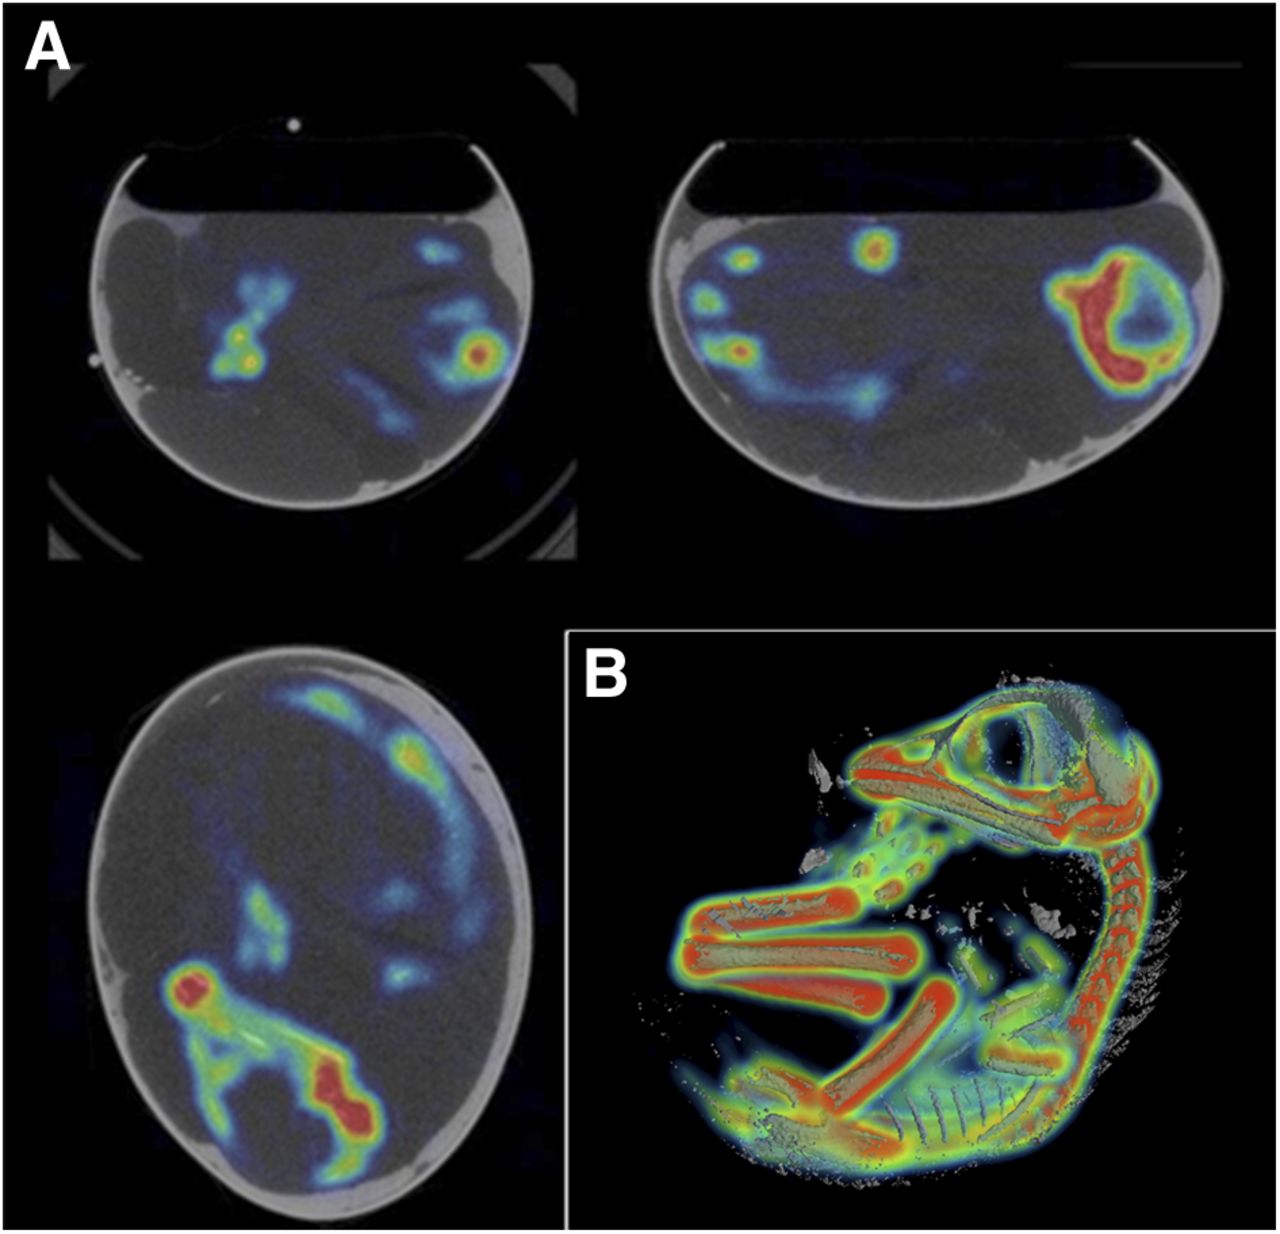
(A) Two-dimensional coregistered PET and CT images of representative chicken embryo in shell after 18F-Na injection (tumor absent). (B) 3D visualization of overlaid PET and CT images for 18F-Na uptake in embryo, enabling clear evaluation of CT and PET data overlap.
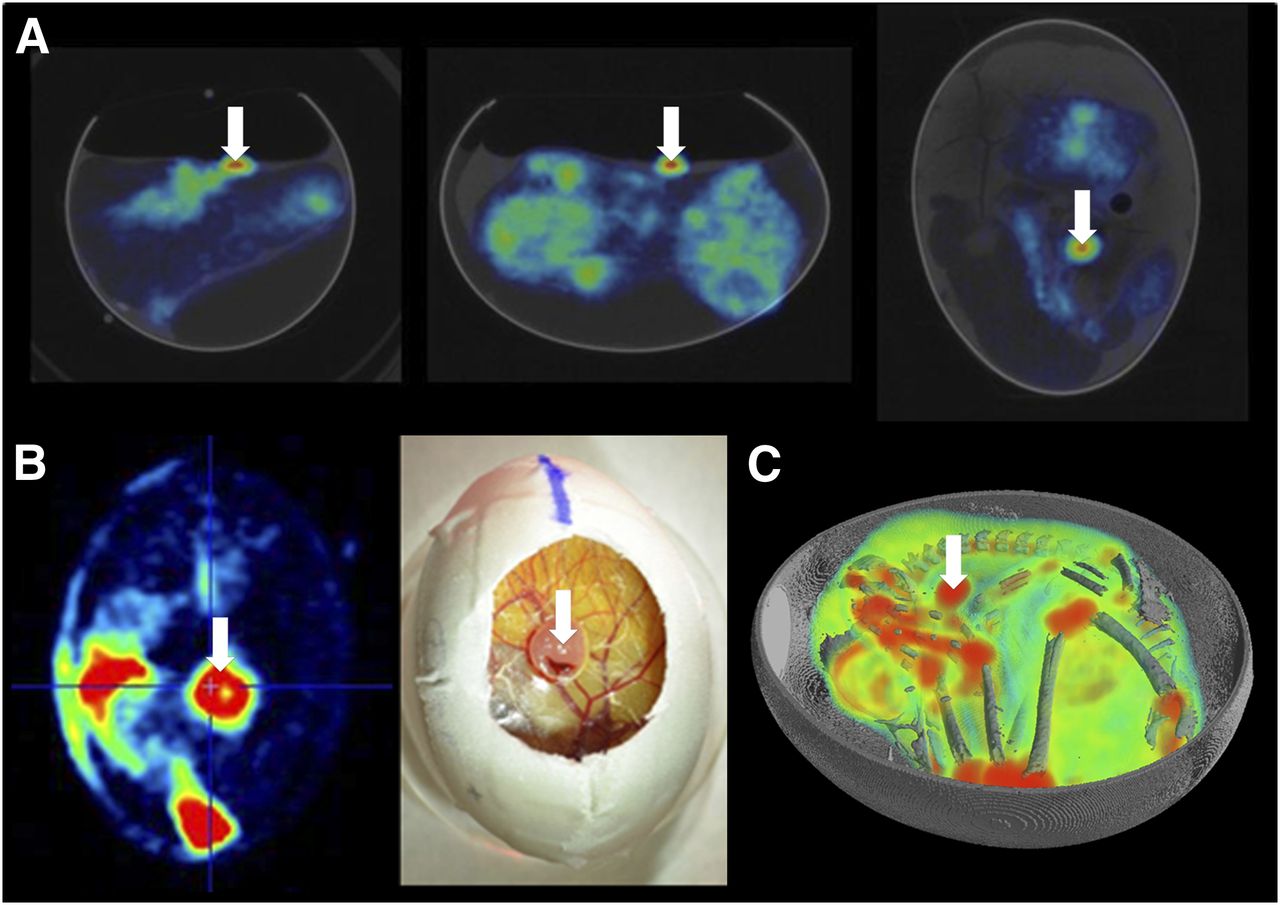
(A) Two-dimensional coregistered PET and CT images of egg after 18F-FDG injection and 45 min tracer uptake. (B) Visual comparison of 18F-FDG uptake in glioblastoma at level of CAM to photograph illustrating tumor localization. (C) 3D visualization of overlaid PET and CT images for 18F-FDG uptake in embryo and U87 human glioblastoma tumor (white arrow).
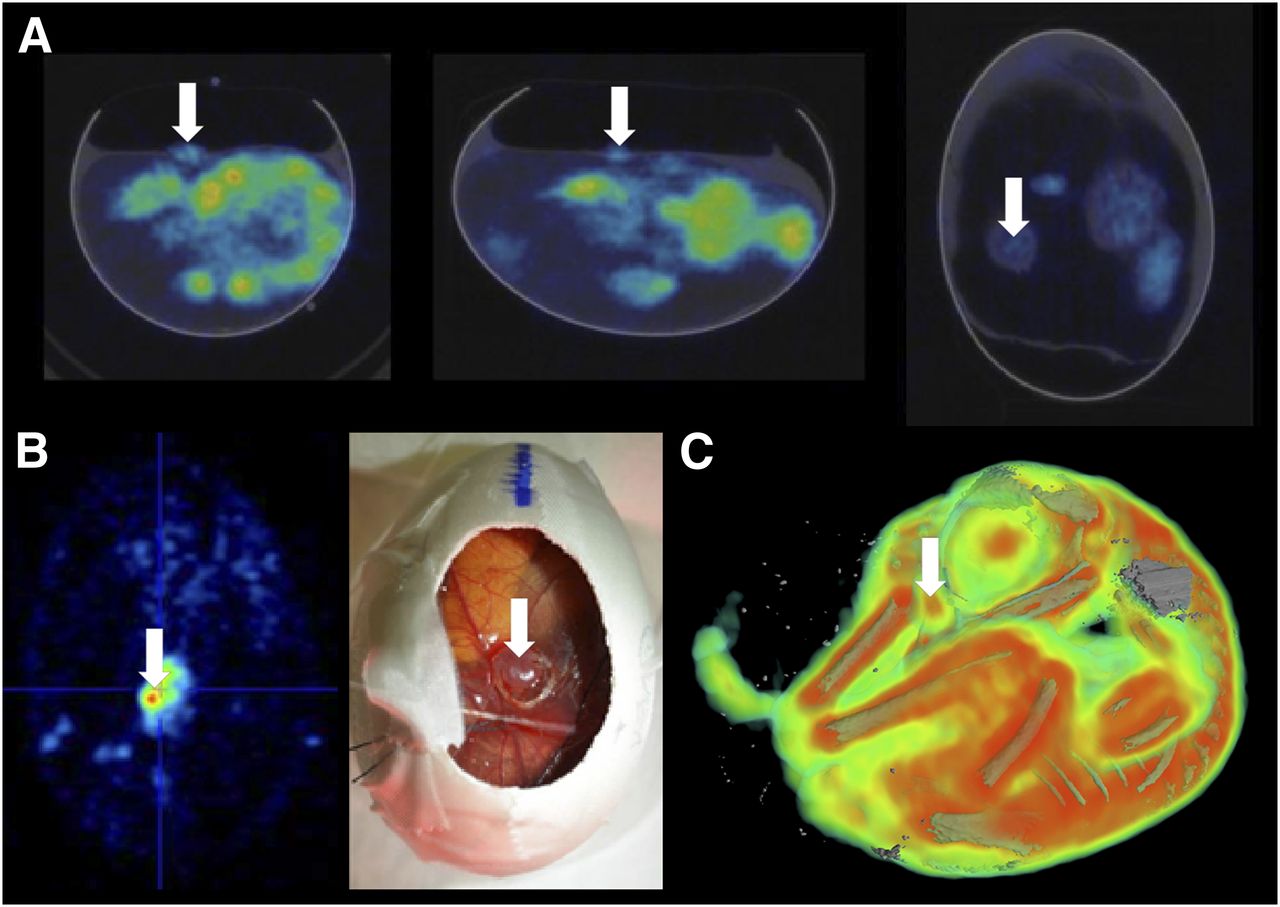
(A) Two-dimensional coregistered PET and CT images of egg after 18F-TYR injection and 45 min tracer uptake. (B) Visual comparison of 18F-TYR uptake in glioblastoma at level of CAM to photograph illustrating tumor localization. (C) 3D visualization of overlaid PET and CT images for 18F-TYR uptake in embryo and U87 human glioblastoma tumor (white arrow; shell masked).
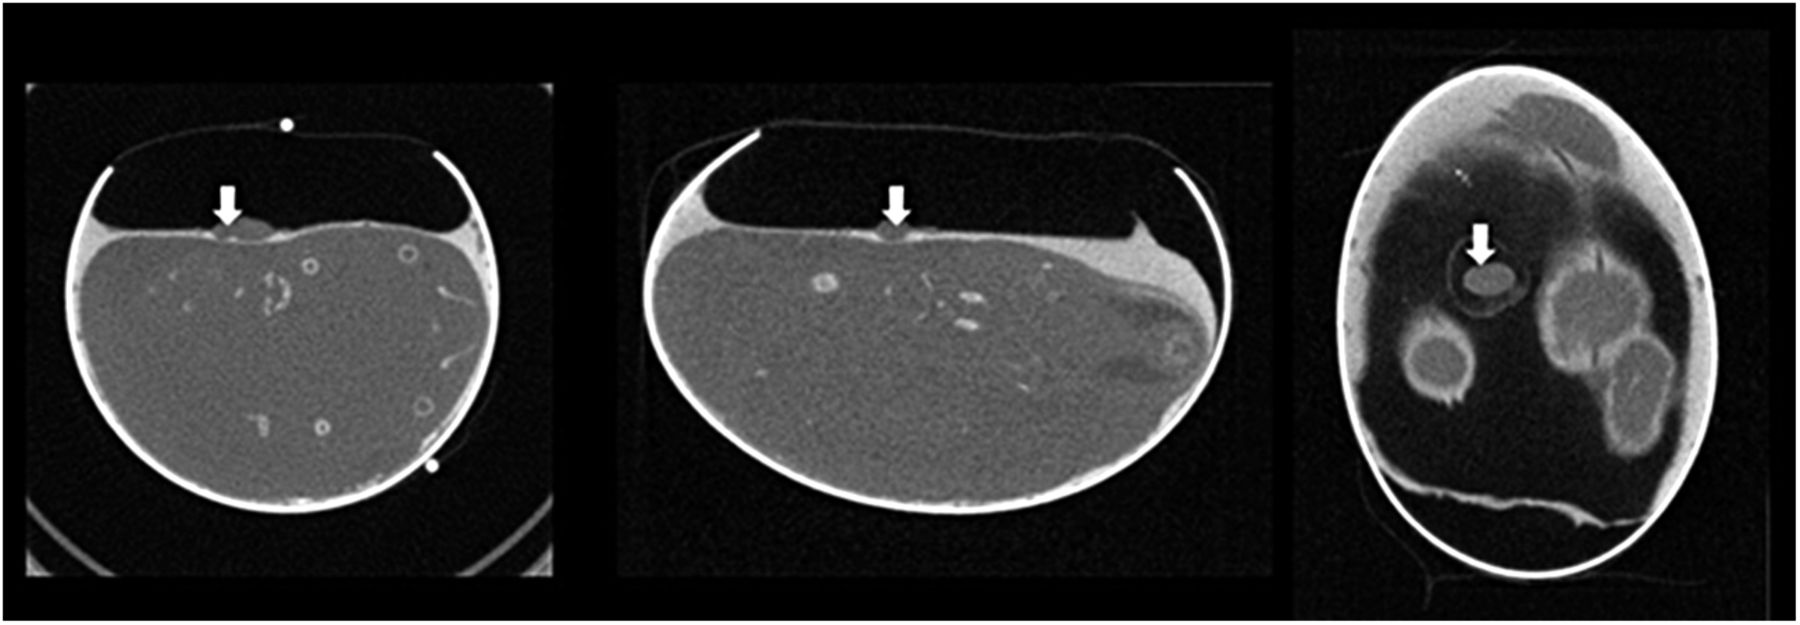
Two-dimensional CT slices showing U87 human glioblastoma (white arrow) on chicken CAM, illustrating delineation of tumor with aid of albumin contrast.
Dynamic Imaging of Tumor Glucose Metabolism with 18F-FDG
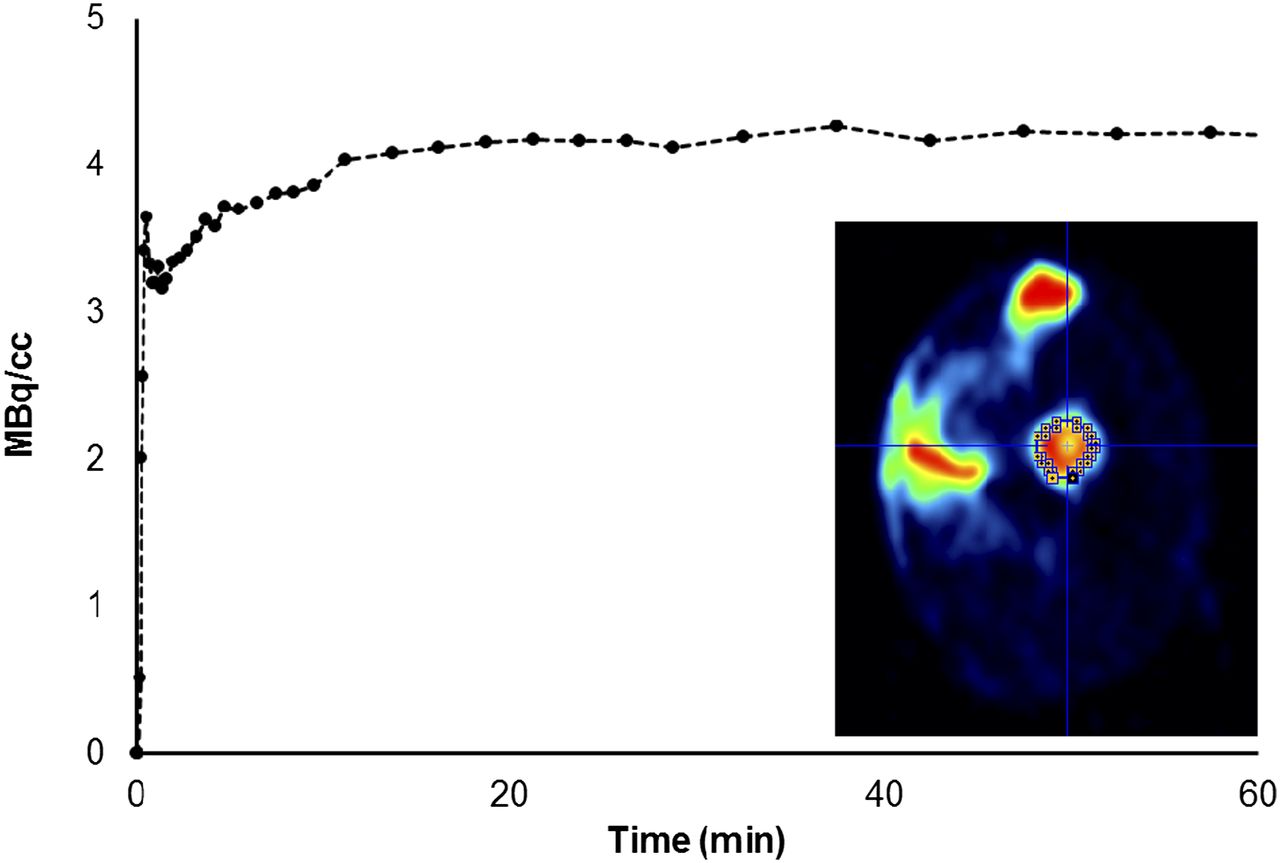
Catheterization of a CAM vessel allowed dynamic PET imaging from the point of bolus tracer injection. The uptake of 18F-FDG in the tumor was rapid and reached a plateau after approximately 15 min, in a fashion similar to the 18F-FDG uptake seen in small-animal studies (22). A time–activity curve for tumor 18F-FDG uptake and the corresponding volume of interest defined on the PET data are shown in Figure 6.

Time–activity curve illustrating uptake of 18F-FDG in U87 glioblastoma on chicken CAM over duration of PET scan. Inset = volume of interest definition for time–activity curve calculation in image analysis software.
Tumor Volume Measurement
The region growing algorithm correctly identified the tumor on all slices in CT images with accuracy but depended on improved delineation of the tumor because of the addition of contrast agent to the albumin. An example of tumor delineation and the resultant bounding volume is illustrated in Supplemental Figure 5. Of 7 tumors tested (7 individual eggs), the delineation between tumor and surrounding tissues was sufficient for automatic volume measurement in 6 (85% success rate). The volume-measurement algorithm could not be applied to the remaining tumor (Table 1, subject 1) because of poor contrast between tumor and surrounding tissues, resulting in the generation of an inaccurate bounding volume after seeding for region growing. Applying the segmentation method to the same tumor (10 repetitions) using different seed voxels resulted in a coefficient of variation (SE over mean) of 6%. The resultant tumor volumes from both manual and automated CT-based methods are shown in Table 1. The ratios between the volumes calculated by in vivo versus ex vivo CT-based methods and ex vivo manual versus in vivo methods were calculated to aid comparison. The mean ratio between in vivo and ex vivo CT-based methods was 1.038 ± 0.050, indicating a high degree of agreement between the methods. In contrast, the mean ratio between ex vivo manual and in vivo methods was 0.695 ± 0.193, indicating that volumes were underestimated using manual measurement.
Measured Tumor Volumes: Comparison Between Measurements from CT Data Versus Manual Caliper Measurements
DISCUSSION
The successful development of novel therapeutic avenues in oncology inevitably depends on the availability of suitable in vivo models and modalities to study the efficacy of new drugs. In recent years, imaging has become an important tool in oncology. Many tumor models and imaging methods have been established and optimized in the mouse. However, drawbacks of murine models include ethical concerns and the large amount of time and resources needed for animal housing. These limitations creates interest in more sustainable, higher-throughput, alternatives. We, and others (3,5), believe that the chicken CAM model can be a true alternative that directly addresses the drawbacks described above. Tumorigenic mammalian cells can be easily implanted on the CAM, and vascularized tumors develop in less than a week (3,5,12). The CAM vasculature offers easy access for injection and catheterization, facilitating drug infusion (automatically if desired) at defined points in time. Although the CAM model is available at a fraction (at least 1/100) of the cost necessary for murine studies, the lack of proven imaging protocols and a lack of knowledge concerning the CAM model among the imaging community clearly hindered the collection of similar in vivo data. To address this issue, the current study sought to demonstrate optimized imaging protocols for CAM-based tumors. To our knowledge, this is thus the first demonstration of successful in vivo PET/CT imaging of CAM tumors, using a CAM model of human glioblastoma as an example.
Imaging with 18F-NaF provided a useful methodologic validation. Imaging of 18F-NaF uptake in chicken embryos has been proposed as a useful model of bone development (23). In this elegant study, the tracer was injected through a catheter penetrating the otherwise intact shell. In the model described here, the window created in the shell to allow tumor implantation also serves to provide direct access to CAM blood vessels, providing exceptionally clear confirmation of successful tracer injection and catheter patency. A drawback of the shell window is the limitation this imposes on the orientation of the egg, although this is balanced by the ability to visually select and manipulate the CAM vessels.
The acquisition of anatomic CT data in addition to PET images of functional tracer uptake allows precise delineation of the tumor tracer uptake from that in the embryo, which could otherwise hamper image analysis. Figures 3 and 4 clearly illustrate the value of CT data in localizing tracer uptake. Although effective coregistration of the images was possible using the shell outline in CT and limits of uptake in PET, the addition of fiducial markers greatly improved accuracy and helped to confirm correct image orientation between modalities. Combined with the effectiveness of the markers, the use of the Minerve small-animal imaging cell made the switch between PET and CT modalities efficient without introducing movement. The anesthesia and warming functions of the cell proved equally useful. Thus, the use of currently available small-animal imaging equipment facilitates imaging in the CAM model.
The combination of 18F-NaF imaging and 3D image reconstruction proved useful in the validation of the imaging and anesthesia protocols. 3D visualization of the coregistered data allowed an exceptionally clear assessment of the overlap between bone structure in CT data and bone 18F-NaF uptake in PET data (Fig. 2). This indicated that isoflurane was a suitable anesthetic to prevent motion in the embryo during scanning and confirmed the accuracy of image coregistration based on the fiducial markers.
Although motion during PET scanning is most problematic if movement of the tumor is induced, motion of the embryo could make it impossible to localize hot spots of tracer activity to structural reference points, which could substantially impede image analysis. Unlike small-animal imaging in rats or mice, the physical orientation of the chick inside the shell is not apparent and cannot be directly manipulated. The addition of contrast agent to the albumin greatly aided in detecting the position of the chick to identify tumor tracer uptake with certainty, and 3D visualization further streamlined this process. Particularly in the case of 18F-FDG, hot spots of tracer uptake in the major leg joints could easily be confused with tumor uptake in the absence of contrast-enhanced CT images with assistance from 3D visualization (Fig. 3).
CT has been successfully applied for the measurement of tumor volume in oncology (24) and is expected to provide more accurate volume estimates than manual methods. Because of the influence of scanner resolution and noise, volume estimates are expected to be most accurate in larger, uniform tumors, whereas tumors of nonuniform shape with small outcrops may be less well identified by the region growing algorithm developed. Table 1 demonstrates the difference between manually and automatically measured tumor volumes. Ex vivo CT of the dissected tumors was used to remove the influence of surrounding tissues and confirmed the accuracy of the in vivo CT method. The mean difference in tumor volume calculated by either in vivo or ex vivo CT was less than 4%, which is within the 6% coefficient of variation inherent in the seeded region growing algorithm. In contrast, manual tumor volumes were underestimated, compared with CT-based volumes, with a mean difference of approximately 30% as shown in Table 1. This difference is most likely due to the limitations of the ellipsoid model. Repeated measurements of tumor volume are feasible, although the specific influence of CT dose on tumor growth in the CAM model requires further investigation. The CT dose index 100 associated with a single field-of-view CT scan was about 21 mGy (20), comparable to that used in small-animal studies (24,25).
To compare radiotracer uptake between individual CAM tumors or to assess the effects of treatment on functional tumor activity parameters (e.g., glucose metabolism as made possible by 18F-FDG PET) in the CAM model, quantification of PET tracer uptake is essential. Quantification in small-animal PET presents several challenges, of which partial-volume effects and standardization of tracer uptake could be considered among the most prominent. In the case of 18F-FDG, a commonly used standardization method in both humans and animals is calculation of the standardized uptake value (26). In this method, the kinetics of 18F-FDG in blood plasma are assumed to be directly related to injected dose and body weight. In mice, the ratio of standardized uptake value in tumor to surrounding tissues is highly dependent on the experimental protocol (27). The difficulty of calculating standardized uptake value in chicken embryos has been described by Wurbach et al. (23), who tentatively proposed the relationship between egg and embryo weight (28) as a solution. With CT data available, a measure such as egg volume or beak length may provide a more accurate estimate of embryo weight. This could be investigated in further studies. In the present study, a single tumor was implanted on the CAM. In many mouse studies, tumors are implanted bilaterally to provide a within-animal control between a control tumor and one expressing a given target. Such a within-subject design could be useful in the CAM model and may also offer a solution to the standardization issues described above. The second major challenge to PET quantification is the influence of partial-volume effects. When objects with a size less than 2–3 times the physical resolution of the PET scanner are scanned, recovery coefficients substantially less than 1 are obtained. For the Focus 120 microPET scanner, a resolution of 1–2 mm in the 20-mm central field of view has been reported (18), meaning that quantification of tracer uptake in tumors of a few millimeters will be compromised by partial-volume effects. Simple qualitative measures of radiotracer uptake may still be valuable, particularly in applying the CAM tumor model to screening and validation of novel PET tracers. In this case, proof of tracer uptake in the target tumor type could be sufficient to justify proceeding into mouse studies. A relative measure of tumor tracer uptake such as tumor-to-background ratio may also prove useful in the CAM model, although identification of a suitable background region may prove challenging because of inconsistent positioning of the tumor in relation to the embryo.
After implantation of a CAM vascular catheter, dynamic imaging was made possible and a typical 18F-FDG uptake time–activity curve could be readily extracted from the image. Although dynamic measurements of 18F-FDG uptake are not common in small-animal oncology, this method could be of use in the testing of novel radiotracers where no pharmacokinetic data are available. This could be valuable in estimating the required uptake period for tracers that accumulate in tissues, such as 18F-fluoromisonidazole (29). Second, vascular access to the CAM after tracer injection makes displacement studies possible where the selectivity of novel tracers in vivo requires testing. For quantitative imaging of transport and metabolism rate constants using dynamic data in small-animal PET, time–activity curves are typically required for not only the region of interest, but also the activity in either arterial plasma (the arterial input function) or a reference region (30). In this CAM model, blood sampling is effectively precluded because of the limited size and access to blood vessels, and it is difficult to determine a suitable reference region. This may limit the ability to extract rate constant data from the CAM model with PET, but its value for confirmation of selective tracer uptake and displacement remains clear.
In its current form, we envisage the CAM model to be of most value to the imaging and oncology communities for initial screening studies with novel tracers. It may be of particular value for the screening of novel targeted antibodies as part of developing targeted radionuclide therapies. Because it is rapidly adapted to multiple tumor types, the CAM model could also be of value for screening targeted CT contrast agents and delivery systems during development, such as nanoparticle-based contrast agents, which have been used to study tumor vascular permeability (31). The ability to rapidly grow tumors with specific antigen expression profiles makes it possible to verify specific binding of PET tracers in vivo before progressing to studies in mouse models for classic studies including biodistribution and dosimetry. In this way, the number of adult animals used in tracer development could be reduced in accordance with the principles of the 3Rs (reduction, replacement, refinement). The availability of an in vivo model for screening may be beneficial, compared with cell-based assays where, for example, the role of tumor vasculature and hypoxia cannot be accounted for. However, imaging in the CAM model cannot completely replace rodent studies in the pathway to developing novel tracers. In vivo studies in fully developed mammals remain necessary to meaningfully assess whole-body biodistribution and metabolism.
Although we focus on the CAM model for tumor imaging and specifically its value in radiotracer development, others are interested in imaging in chicken embryos for the study of development. 18F-NaF imaging has been applied to study bone metabolism and growth in chicken embryos using an elegant intact-shell technique (23), and a combination of in and ex vivo 18F-FDG PET/CT has been used to study waking-like brain function (32). In addition to tracers such as 18F-FDG, radiolabeled thymidine may be useful to measure growth rate. A mismatch between 3H-2-deoxyglucose and 3H-thymidine uptake has been shown in chicken embryo fibroblasts transformed by the Rous sarcoma virus (33–35), with increased 3H-2-deoxyglucose uptake in transformed cells despite a growth rate similar to nontransformed cells, as determined using 3H-thymidine. A similar comparison of glucose metabolism and DNA synthesis rate could be achieved using 3′-deoxy-3′-18F- fluorothymidine. The inclusion of this tracer in PET/CT studies of development in chicken embryos could help to increase accuracy and to better define changes in growth rate.
CONCLUSION
By combining the CAM glioblastoma model with in vivo PET/CT imaging, we offer an innovative, cost-effective, and ethically favorable alternative to the typical cancer models in small animals for screening and validation of novel PET tracers and targeted therapeutics. We believe that this new technique will be of high value to the oncology and radiochemistry communities. In our laboratory, the CAM tumor model and PET/CT imaging will soon be used to evaluate the tumor selectivity of novel radiolabeled antibodies. PET imaging is a crucial tool in the development of such agents for radioimmunotherapy, allowing a clear assessment of targeting accuracy and nonspecific binding. Moreover, through translational studies, PET can provide a direct link between research and the clinic. In this context, the optimized imaging protocols proposed in this study represent a powerful tool to accelerate the development of targeted therapies.
DISCLOSURE
The costs of publication of this article were defrayed in part by the payment of page charges. Therefore, and solely to indicate this fact, this article is hereby marked “advertisement” in accordance with 18 USC section 1734. This study is funded in part by The Marie Curie Initial Training Network (MC-ITN) “Methods in Neuroimaging” #MC-ITN-238593. M.A. Bahri is a “collaborateur logistique” for FRS-FNRS Belgium. Alain R.E.G. Plenevaux is a senior research associate for FRS-FNRS Belgium. No other potential conflict of interest relevant to this article was reported.
Footnotes
↵* Contributed equally to this work.
Published online Aug. 22, 2013.
- © 2013 by the Society of Nuclear Medicine and Molecular Imaging, Inc.
REFERENCES
- Received for publication November 26, 2012.
- Accepted for publication April 12, 2013.


Jump to section
Related Articles
Cited By...
- No citing articles found.