


Abstract
This study aimed to correlate 18F-FB-mini-PEG-E[c(RGDyK)](2) (18F-FPRGD2) uptake to integrin αvβ3 expression and angiogenesis in renal tumors. Methods: 18F-FPRGD2 PET/CT was performed on 27 patients before surgical resection (median 4 d) of a renal mass. The 18F-FPRGD2 uptake was compared with integrin αvβ3, CD31, CD105, and Ki-67 using immunohistochemistry; with placental growth factor and vascular endothelial growth factor receptors 1 and 2 using reverse transcription polymerase chain reaction; and with vascular endothelial growth factor A isoforms using enzyme-linked immunosorbent assay. Results: Overall, 18F-FPRGD2 uptake significantly correlated (P < 0.0001) with integrin αvβ3 expression in renal masses. However, it correlated only with integrin αvβ3-positive vessels in the group of papillary carcinomas whereas it correlated with integrin αvβ3 expression by tumor cells in the clear cell carcinoma group. Conclusion: 18F-FPRGD2 uptake reflects the expression of integrin αvβ3 in renal tumors but represents angiogenesis only when tumor cells do not express the integrin.
The integrin αvβ3 is a cell surface receptor regulating cell adhesion to the extracellular matrix through the attachment of cells to proteins that contain the Arg-Gly-Asp sequence (RGD). The 18F-FB-mini-PEG-E[c(RGDyK)](2), 18F-FPRGD2, is a radiolabeled RGD peptide that was specifically designed to bind the integrin αvβ3 with high affinity (1). Our work rationale was to investigate whether 18F-FPRGD2 PET/CT could estimate integrin αvβ3 expression and reflect angiogenesis in renal masses, in particular renal cell carcinomas (RCC), for which the current standard of treatment targets angiogenesis.
MATERIALS AND METHODS
The study protocol (EudraCT no. 2010-019219-39) was approved by the institutional Committee on Ethics; all patients gave written informed consent. We prospectively included patients who were scheduled to undergo surgical resection of a highly suggestive renal mass according to radiologic criteria.
18F-FPRGD2 PET/CT was performed before surgery (median, 4 d; range, 1–13 d) in all patients. The 18F-FPRGD2 was produced using a published method in compliance with current good manufacturing practice regulations (2). The 18F-FPRGD2 radiosynthesis process and the 18F-FPRGD2 PET/CT acquisition parameters are described in the supplemental data (supplemental materials are available at http://jnm.snmjournals.org).
Directly after tumor removal, samples were collected at 4 poles of the tumor whenever possible; only one sample was collected for small tumors, and an additional central sample was taken in larger tumors. Immunohistochemistry was performed to estimate tumor expression of integrin αvβ3 on frozen sections (biotinylated monoclonal anti-αvβ3 antibody, clone LM609, 1:800; Merck Millipore), tumor microvessel density (MVD) using CD31 (purified rat antimouse CD31 monoclonal antibody, 1:25; BD Biosciences Pharmingen) and CD105 (rabbit anti-CD105, 1:200, PA1-37372; ThermoScientific) and proliferation-related Ki-67 antigen (monoclonal mouse anti-Ki-67, 1:100, M7240; Dako). The total tumor tissue RNA of placental growth factor and vascular endothelial growth factor (VEGF) 121, 165, and 189 (isoforms of VEGF-A) were estimated using reverse transcription polymerase chain reaction; the expression of VEGF receptors 1 and 2 was estimated on snap-frozen tumor samples using an enzyme-linked immunosorbent assay kit (R&D systems).
Immunohistochemistry staining was visually quantified by an experienced pathologist. Integrin αvβ3 staining was scored according to staining intensity and extension in the whole tumor field and considering integrin αvβ3 staining on tumor cells on the one hand and staining on vessels (endothelial cells) on the other hand. CD31-MVD and CD105-MVD were arbitrarily scored from 1 to 3 (low to high density). The percentage of Ki-67–positive nuclei was estimated in 3 representative fields (×40 objective). The presence or not of necrosis was specified for each sample.
Lastly, 2 experienced nuclear medicine physicians analyzed the 18F-FPRGD2 PET/CT images. They independently placed 1.22-mL volumes of interest over the areas corresponding to the pathologic samples, providing the 18F-FPRGD2 maximum standardized uptake value (SUVmax). Furthermore, the entire tumor 18F-FPRGD2 SUVmax and SUVmean were assessed by one physician.
RESULTS
No side effects were observed after 18F-FPRGD2 injection in any patient. Twenty-seven consecutive patients were enrolled from April 2011 to December 2013. The patient characteristics are summarized in Table 1. All patients but one underwent surgery. Samples were collected at 4 poles of the tumor in 20 of 26 patients (an additional central sample was taken in 5 of 20 patients with a large tumor); only 1 sample was collected in 6 of 26 patients with a small lesion. In total, 91 tumor samples were collected, and 89 corresponding volumes of interest were delineated on 18F-FPRGD2 PET/CT images. Two volumes of interest were not delineated in 1 patient because of high urine activity. The interobserver agreement of the PET assessment was high: The intraclass correlation coefficient was 0.98 for SUVmax (inferior limit, 0.97) and 0.97 for SUVmean (inferior limit, 0.96).
Patient Characteristics
18F-FPRGD2 uptake significantly correlated with integrin αvβ3 expression in tumors (n = 26) (Fig. 1; Table 2). Considering the malignant tumors only (n = 23), the correlation was also significant (Pearson r = 0.43; P = 0.0001). In the group of clear cell RCC (ccRCC), the 18F-FPRGD2 PET signal correlated with integrin αvβ3 expression by tumor cells (Fig. 2), whereas in the papillary RCC (pRCC) group, the signal correlated with the integrin αvβ3 expression on vessels (Fig. 3). The integrin αvβ3 expression (immunohistochemistry staining score) was significantly higher (P = 0.0099) on ccRCC cells (mean score ± SD, 3.6 ± 2) than on the pRCC cells (2.14 ± 1.8). The integrin αvβ3 expression, VEGF-A and PIGF levels, and MVD were significantly higher in ccRCC than in pRCC (P < 0.03). Considering all tumors, the 18F-FPRGD2 signal was significantly higher when the tumor cells expressed the integrin αvβ3 (P < 0.01) and in tumor samples with higher CD31-MVD (P = 0.0242). However, 18F-FPRGD2 uptake did not correlate with expression levels of CD105-MVD, placental growth factor, VEGFs, and VEGF receptors 1 and 2. Similarly, the angiogenic parameters did not correlate with integrin αvβ3 expression in tissues. 18F-FPRGD2 uptake negatively correlated with the Ki-67 score in all tumors (r = −0.32; P = 0.0027) and in the group of ccRCC as well (r = −0.49; P = 0.0005). There was no relationship between 18F-FPRGD2 uptake and tumor size.

18F-FPRGD2 uptake (y-axis: log SUVmax) significantly correlated (Pearson r = 0.53; P < 0.0001) with integrin αvβ3 expression in tumor samples (x-axis: immunohistochemistry staining score estimated by pathologist).
Correlation Coefficients Between 18F-FPRGD2 Uptake and Tissue Parameters in Biopsies

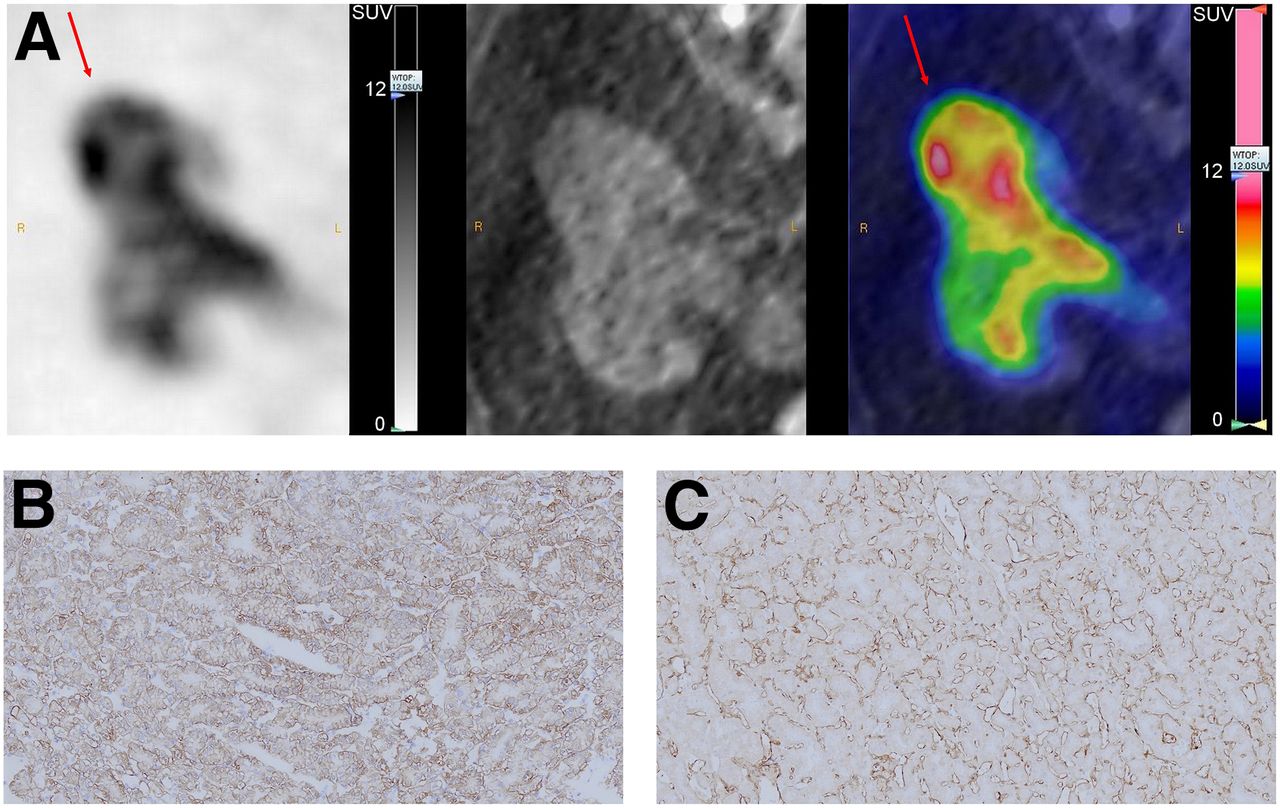
18F-FPRGD2 PET/CT images of patient with ccRCC (A: arrows) with high 18F-FPRGD2 uptake (SUVmax, 5.7) and high integrin αvβ3 expression (B: brown staining of integrin αvβ3) on both tumor cells and vessels and high CD31-MVD (C: brown staining of CD31).

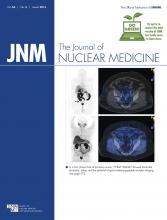
In contrast to patient of Figure 1, this patient with pRCC (A: arrows) shows lower 18F-FPRGD2 uptake (SUVmax, 3.4), no expression of integrin αvβ3 on tumor cells (B: brown staining of integrin αvβ3), and lower CD31-MVD (C: brown staining of CD31).
We observed both intraindividual and interindividual variability of 18F-FPRGD2 uptake and, similarly, a variability of the expression of integrin αvβ3 by tumor cells and vessels in tumors (Supplemental Fig. 1). Supplemental Figure 2 shows an example of ccRCC with high 18F-FPRGD2 uptake due to the expression of integrin αvβ3 in vessels but not in tumor cells. Considering the entire tumors, the mean 18F-FPRGD2 SUVmax was not different in ccRCCs (4.1 ± 1.2) and in pRCCs (3.3 ± 0.7). The 18F-FPRGD2 SUVmax in the chromophobe RCC (chRCC), the breast cancer metastasis, and the angiomyolipoma were 2.8, 3.9, and 2.9, respectively. One of the 2 oncocytomas showed the highest 18F-FPRGD2 SUVmax (13.1); the other one showed a lower uptake (SUVmax, 2.3).
Finally, the pathologic analysis revealed the presence of necrosis in 9 of 26 tumors (4 pRCC, 4 ccRCC, and 1 breast cancer metastasis); the intensity of 18F-FPRGD2 uptake was significantly lower in these tumors (P < 0.0001).
DISCUSSION
In vivo imaging of angiogenesis at diagnosis and after treatment initiation is an attractive concept in RCC, in particular in metastatic ccRCC, in which antiangiogenic treatments are the first-line therapeutic option. Our work shows that 18F-FPRGD2 PET/CT reliably estimates integrin αvβ3 expression in renal tumors but is representative of angiogenesis only when tumor cells do not significantly express integrin αvβ3. These findings are consistent with data obtained with other RGD-based tracers in various cancers (3–7). Consequently, 18F-FPRGD2, and in all likelihood other RGD-based tracers, may prove inadequate for assessing angiogenesis in all tumor types, including RCC. Indeed, we found that two thirds of ccRCC biopsies showed moderate to high expression of integrin αvβ3 by tumor cells. Nonetheless, the expression level of integrin αvβ3 in tumor cells is associated with invasiveness and metastatic potential, and its quantification using PET might be useful for researchers investigating integrin αvβ3 as a prognostic factor (8–10). We also observed a negative correlation between 18F-FPRGD2 tumor uptake and Ki-67 expression, which is an established prognostic marker in localized ccRCC (11). This finding may be attributed to necrosis, which is enhanced in tumors with a more aggressive phenotype, leading to a decreased 18F-FPRGD2 PET signal. Furthermore, the variability of integrin αvβ3 expression observed across patients with an identical histology and even within a single tumor reflects the tumor heterogeneity and emphasizes the benefit of noninvasive imaging to better characterize tumors in vivo.
Although geographic misses of PET volumes of interest are possible, the methodology aimed at reducing the risks as much as possible with the presence of a nuclear medicine physician in the operating room and photographs of the surgical specimen and sampled areas. PET signal overestimation due to high surrounding background activity in normal kidney may also contribute. Indeed, 18F-FPRGD2 is filtered by the kidneys and integrin αvβ3 is expressed by tubules and glomeruli podocytes, the Bowman capsule, and vascular endothelium (12,13). The correlation coefficients between the 18F-FPRGD2 signal and integrin αvβ3 expression in tissues are statistically significant but relatively low, possibly because of the immunohistochemistry staining technique and quantification method, even though they were standardized. Also, it is possible that 18F-FPRGD2 binds to other integrins such as αvβ5 and α5β1 although there are no data with regard to this issue (1).
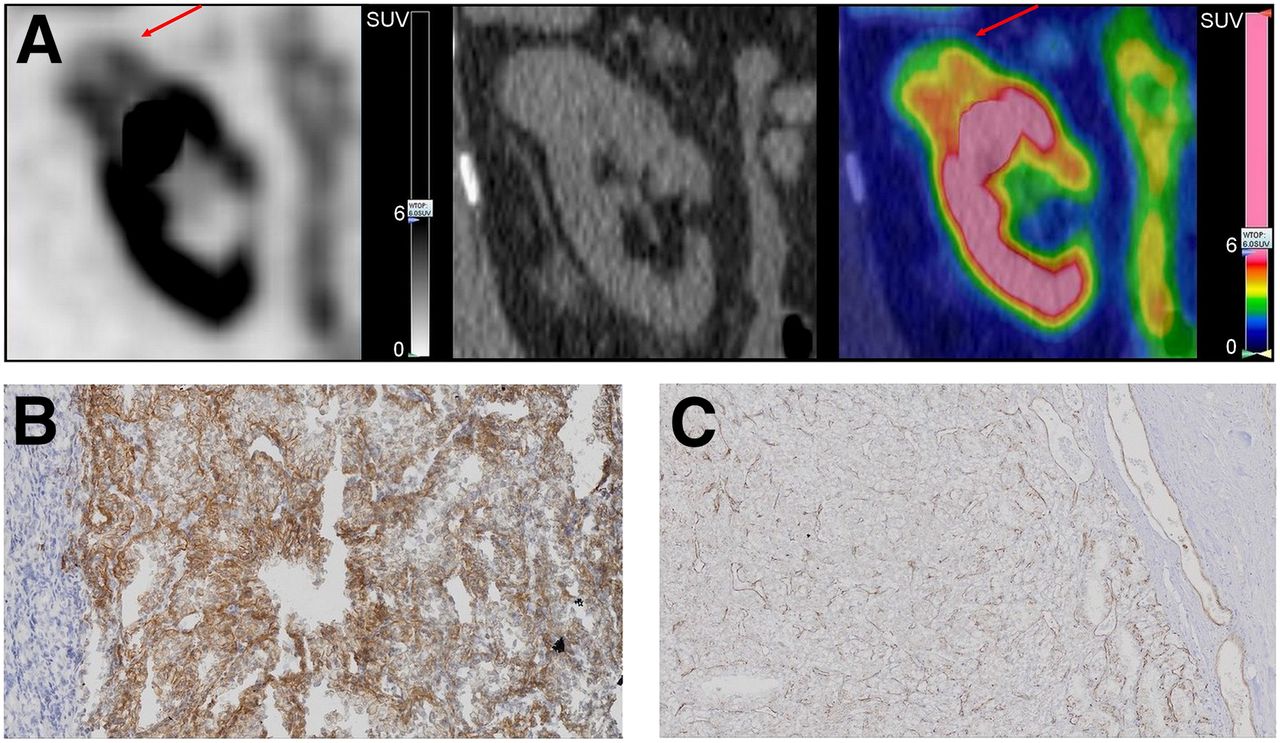
Finally, the 18F-FPRGD2 uptake (SUVmax, 2.8) of the chRCC was lower than the uptake of 18F-flucilatide (binding both αvβ3 and αvβ5 with high affinity) reported by Mena et al. in 4 cases of chRCC (80% of maximum SUVmean, 8; range, 5.8–10) (14). In our study, the renal mass with the highest uptake of 18F-FPRGD2 was an oncocytoma (a benign lesion). The pathologic examination found high expression of integrin αvβ3 on both tumor cells and vessels (Fig. 4), suggesting that 18F-FPRGD2 PET/CT appears unsuitable for distinguishing between benign and malignant renal masses.
18F-FPRGD2 PET/CT images (A) of patient with oncocytoma and highest 18F-FPRGD2 tumor uptake (SUVmax, 13.1) due to high integrin αvβ3 expression (B: brown staining of integrin αvβ3) on both tumor cells and vessels and high CD31-MVD (C: brown staining of CD31).
CONCLUSION
18F-FPRGD2 PET/CT allows estimation of integrin αvβ3 expression in renal tumors. Moreover, the 18F-FPRGD2 PET signal does not directly reflect angiogenesis when tumor cells express the integrin αvβ3.
DISCLOSURE
The costs of publication of this article were defrayed in part by the payment of page charges. Therefore, and solely to indicate this fact, this article is hereby marked “advertisement” in accordance with 18 USC section 1734. The Belgian Fondation contre le Cancer and the federal Ministry of Health (Plan Cancer) supported the trial. No other potential conflict of interest relevant to this article was reported.
Acknowledgments
Preliminary results were presented as a poster at the 2012 annual meeting of the Society of Nuclear Medicine and Molecular Imaging in Miami, Florida. We thank the operators and Christine Mella (Cyclotron Research Center), the technologists (Nuclear Medicine Division), Isabelle Jupsin (Oncology Department), Kamilia Elkandoussi and Agnès Delga (Biobank, Pathology Department), Fabienne Perin (GIGA Research, Laboratory of Tumor and Developmental Biology), Estelle Dortu and Chantal Humblet (GIGA Research, Cytology and Histology Department), and Laurence Seidel (Biostatistics Department).
Footnotes
Published online Feb. 5, 2015.
- © 2015 by the Society of Nuclear Medicine and Molecular Imaging, Inc.
REFERENCES
- Received for publication September 24, 2014.
- Accepted for publication December 29, 2014.


