


Abstract
PET using 18F-FDG is a promising technique to monitor response in oncology. Unfortunately, a multitude of analytic methods is in use. To date, it is not clear whether simplified methods could replace complex quantitative methods in routine clinical practice. The aim of this study was to select those methods that would qualify for further assessment in a future prospective response-monitoring study by comparing results with patient outcome. Methods: Dynamic 18F-FDG PET scans were obtained on 2 groups of patients. First, 10 patients with advanced non–small cell lung cancer (NSCLC) were scanned on consecutive days before treatment to assess test–retest variability. Second, 30 scans were obtained on 19 patients with locally advanced NSCLC as part of an ongoing response-monitoring study. These scans were analyzed by 2 observers to assess observer variability. In addition, these studies were used to compare various methods with the gold standard, full kinetic analysis (nonlinear regression [NLR]). Results: Using an image-derived input function, NLR showed excellent test–retest and observer agreement confirming that it could be used as a gold standard method. From a total of 34 analytic methods, 10 showed good correlation with NLR. Taking into account the degree of complexity of the methods, 4 remain for further evaluation. Conclusion: The optimal method for analysis of 18F-FDG PET data was determined for several levels of complexity. Four methods need to be evaluated further to determine the optimal trade-off between simplicity and accuracy for routine clinical practice.
At present, combined modality treatment (chemotherapy followed by surgery or radiotherapy) for patients with locally advanced non–small cell lung cancer (NSCLC stage IIIA) is being studied extensively. It is clear, however, that a substantial number of patients do not benefit from such intensive treatment. For example, distant metastases frequently appear during or shortly after induction chemotherapy (1), testifying to the inaccuracy of current staging algorithms. Conventional techniques used to monitor therapeutic effects in oncology, such as CT and MRI, are based on morphologic changes and show limited accuracy (2). It is expected that functional changes will precede morphologic changes and, therefore, techniques that image function rather than anatomy might provide better accuracy to monitor response and overall treatment outcome.
The value of 18F-FDG PET as such a functional imaging technique for monitoring response is still under investigation (3,4). Initial studies have suggested additional value for patient management (3–6). Unfortunately, a full assessment of the value of 18F-FDG PET for monitoring response to therapy is complicated by the presence of a variety of scanning protocols and analytic techniques. To date, it is not clear which analytic method is the most accurate (7). Nonlinear regression (NLR) is generally accepted as the gold standard method. However, it is unclear whether it still can be considered as such when an image-derived input function is used.
At present, no studies in large groups of NSCLC patients have been performed to assess the actual value of 18F-FDG PET as a response-monitoring technique. Moreover, the best implementation still has to be defined. In preparation of a large multicenter trial on the value of 18F-FDG PET for monitoring response in patients with NSCLC, this study was performed to assess (a) whether the reliability of full compartmental analysis with NLR, being the most quantitative method, accords with its status as the gold standard when an image-derived input function is used; and (b) the degree of correspondence of different (simplified) analytic methods with the gold standard.
The design of this study is in line with the European Organization for Research and Treatment of Cancer (EORTC) recommendations (8) for monitoring response using 18F-FDG PET. As such, this study could serve as a model for further response-monitoring studies on other tumor types and also for the evaluation of other tracers.
MATERIALS AND METHODS
Scans were performed on 2 separate groups of patients. First, a group of 10 patients (8 men, 2 women; mean age, 53 ± 6.8 y) with NSCLC stage IIIB/IV was scanned twice on consecutive days before the start of chemotherapy to assess test–retest variability. Second, in a separate group, 30 randomly selected dynamic scans were used, which were obtained on 19 patients (15 men, 4 women; mean age, 59.4 ± 8.1 y) with NSCLC stage IIIA-N2, as part of an ongoing response-monitoring study.
Scans were performed using a state-of-the-art PET scanner (ECAT EXACT HR+; Siemens/CTI, Knoxville, TN). This scanner has an axial field of view of 15 cm, divided into 63 contiguous planes. The patient was positioned supine on the scanner bed with the tumor in the center of the axial field of view.
All patients fasted for 6 h before scanning. Patients received 2 venous catheters: one for injection of 18F-FDG contralateral to the tumor and the other for venous blood sampling. Acquisition started with a 10- to 15-min transmission scan to correct for photon attenuation (9), followed by a bolus injection of 370 MBq 18F-FDG in 5 mL saline through an injector (Medrad International, Maastricht, The Netherlands) at 0.8 mL/s, after which the line was flushed with 42 mL saline (2.0 mL/s). Simultaneous with the injection of 18F-FDG, a dynamic emission scan (in 2-dimensional mode) was started with a total duration of 60 min with variable frame length (6 × 5 s, 6 × 10 s, 3 × 20 s, 5 × 30 s, 5 × 60 s, 8 × 150 s, and 6 × 300 s). All dynamic scan data were corrected for dead time, decay, scatter, randoms, and photon attenuation and were reconstructed as 128 × 128 matrices using filtered backprojection (FBP) with a Hanning filter (cutoff, 0.5 cycle/pixel). This resulted in a transaxial spatial resolution of around 7-mm full width at half maximum. Before injection of 18F-FDG, a blood sample was collected for determination of the plasma glucose level. In addition, 3 venous blood samples were drawn at 35, 45, and 55 min after 18F-FDG injection as quality control for the image-derived input function (10,11) and for plasma glucose measurement (hexokinase method, Hitachi 747; Boehringer Mannheim, Mannheim, Germany).
Data Analysis
Three-dimensional regions of interest (ROIs) were defined semiautomatically over the tumor using a threshold of 50% of the maximum pixel value within the tumor. For this purpose, the last 3 frames of the sinograms were summed and reconstructed using ordered-subset expectation maximization with 2 iterations and 12 subsets followed by postsmoothing of the reconstructed image using a 5-mm full width at half maximum gaussian filter to obtain the same resolution as FBP data (12). For each tumor ROI, a mirror region was defined by copying the tumor ROI to the contralateral healthy lung. In addition, using FBP data, ROIs were defined manually over the aortic arch, left ventricle, and left atrium to obtain an image-derived input function, as described (10).
Test–retest variability was assessed by analyzing the 2 sets of 10 scans from the first group of patients by a single observer. For intraobserver variability, the 30 scans of the second group of patients were analyzed twice by 1 observer on different days (maximum interval, 1–7 d). To assess interobserver variability, the same 30 scans were analyzed by an independent second observer using the same method and software for analysis.
Analysis was performed using the following methods: ratio of tumor to normal tissue (T/N), standardized uptake value (SUV) for the intervals 40–60 and 50–60 min after injection (with several correction factors), NLR using the standard 2-tissue compartment model with 3 (3k) and 4 (4k) rate constants, a blood volume component and an image-derived input function, and the Patlak graphical analysis (13). Furthermore, the 2-ROI, 6-parameter model by Wu et al. (14), the correlation coefficient filtered influx constant image (correlative imaging) by Zasadny et al. (15), the total lesion evaluation (TLE) method by Wu et al. (16), the simplified kinetic method (SKM) described by Hunter et al. (17) for the intervals 40–60 and 50–60 min after injection, and the net influx constant by Sadato et al. (18) were investigated. All methods were applied to the same dataset. A more detailed description of the various methods can be found elsewhere (7).
In this study the lumped constant used was set to 1 and was assumed to be constant over time because no studies on the actual value of the lumped constant in tumors outside the central nervous system have been reported.
Statistics
The presence of a fourth rate constant ([k4] i.e., dephosphorylation of FDG-6-PO4 back to FDG) and the need to include this in the model was assessed by comparing residual sum of squares of fits with and without a k4 parameter using Akaike (19) and Schwarz (20) criteria.
The level of agreement within a method was assessed with intraclass correlation coefficients (ICCs) (21). In this setting, the ICC is the proportion of total variance that can be ascribed to true differences within the method. Values for the ICC range from 0 to 1. Values close to 0 indicate poor agreement between repeated observations (i.e., most of the variance is due to measurement error); values close to 1 indicate high agreement. ICCs were assessed for NLR using test–retest and inter- and intraobserver data to establish whether NLR could be used as a gold standard method. All measures of glucose consumption (obtained with the analytic methods mentioned above) were compared with those of NLR using regression analysis (Pearson). A cutoff value for r2 of 0.95 was used to select these methods with results closest to those obtained with NLR.
Regression analysis determined slopes and intercepts of the correlation between NLR and other methods. These results can be used to draw nomograms that allow approximation of NLR values.
RESULTS
The 3k model provided significantly better fits than the 4k model in 26 (87%) and 27 (90%) of 30 scans according to Akaike (19) and Schwarz (20) criteria, respectively. In other words, the data did not support inclusion of a fourth rate constant and, consequently, it was set to zero in this study.
The mean value ± SD for the plasma glucose level found in this study was 5.3 ± 0.6 mmol/L (range, 3.9–6.5 mmol/L).
NLR using the standard (3k) 2-tissue compartment model with a blood volume component and using an image-derived input function proved to have an excellent test–retest variability (ICC, 0.95; 95% confidence interval [CI], 0.82–0.99). The inter- and intraobserver variabilities were also very good (ICC, 0.98; 95% CI, 0.96–0.99) for both. It was concluded that NLR using the above-mentioned model, with an image-derived input function, could indeed be used as a gold standard. The mean value ± SD for glucose consumption using NLR with 3 rate constants (3k model) was 0.15 ± 0.08 μmol/mL/min (range, 0.02–0.33 μmol/mL/min).
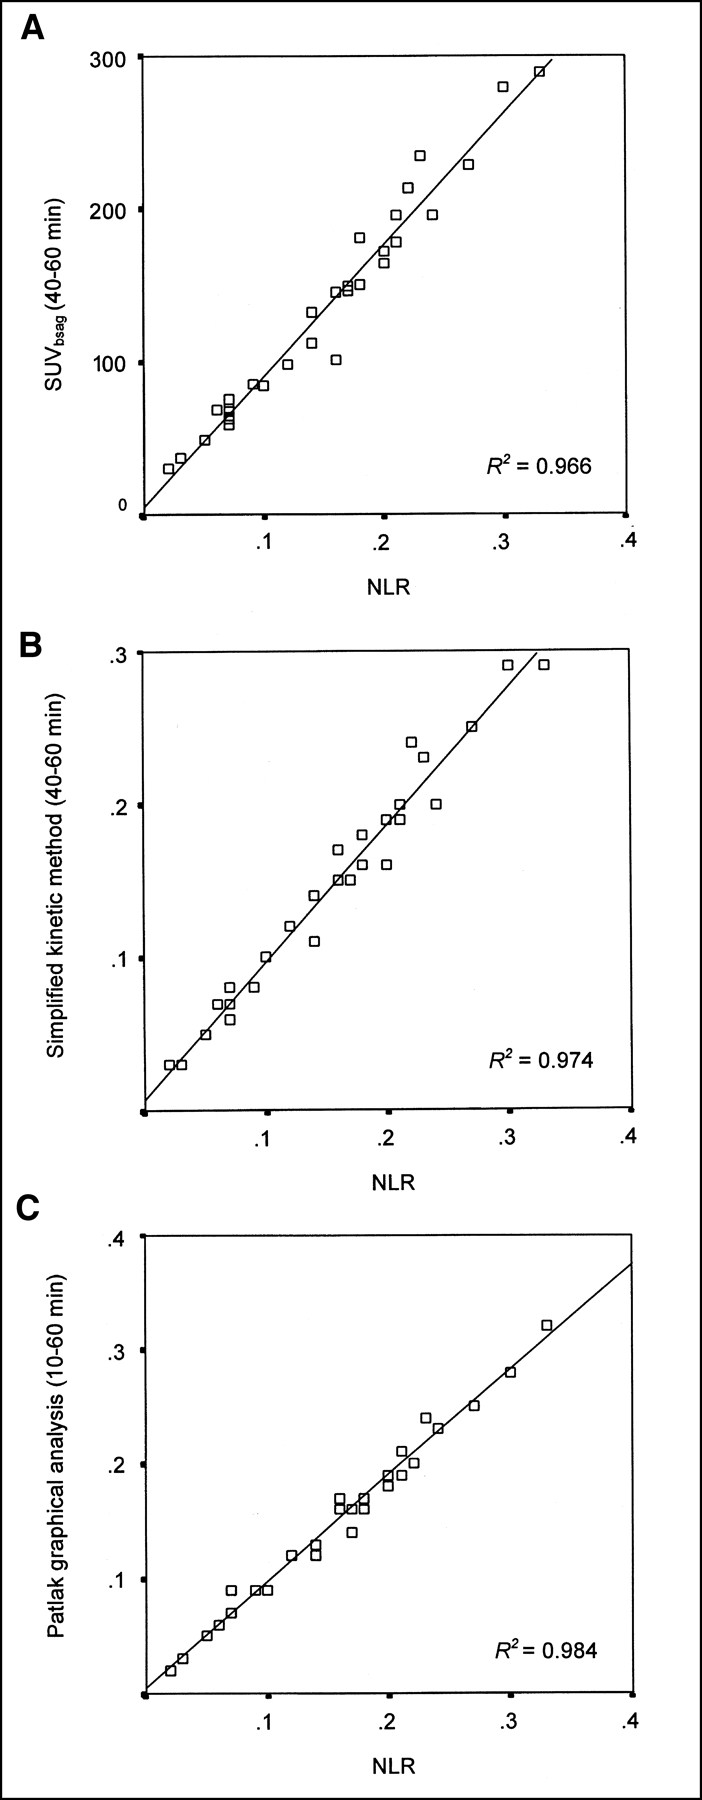
Of the total of 34 alternative methods investigated, 24 had a suboptimal correlation with NLR (r2 < 0.95; Table 1). The best correlations with NLR were found with the SUV corrected for body surface area (BSA) and plasma glucose (SUVBSAg) measured at 40–60 and 50–60 min, the SKM at 40–60 and 50–60 min, the net influx constant method corrected for BSA, and the Patlak graphical analysis (Table 1; Fig. 1). The best scanning period for Patlak graphical analysis was found to be from 10 to 60 min.

Scatter plots of correlation between NLR and SUVBSAg (A), simplified kinetic method (B), and Patlak graphical analysis (C).
Comparison of Glucose Consumption Measurements with Analytic Methods by Regression Analysis with Those of NLR
In Table 1 the slope and intercept of the regression lines are given, allowing NLR results to be converted to any of the other methods and vice versa.
DISCUSSION
18F-FDG PET appears to be a promising technique to monitor response to chemotherapy (8). Unfortunately, its true value is unknown, as no meta-analysis of reported data is feasible because of the variety of analytic methods used in different studies. Various approaches have been used, ranging from visual assessment (qualitative), through semiquantitative indices, to full kinetic analyses of 18F-FDG uptake (7). It is by no means clear whether these methods have similar sensitivity for monitoring changes after therapy. Because interest in response monitoring is growing, selection of the most appropriate method is vital to determine the role of 18F-FDG PET in this field.
For each tumor the presence and possible effect of a fourth rate constant (k4) should be assessed to make a proper decision on whether to include a k4 parameter in the model (22,23). In this study on NSCLC, a model with 3 rate constants provided significantly better fits than other models that included a fourth rate constant.
Various analytic methods were compared in our study by applying them to the same dataset. One question was whether NLR, generally accepted as the gold standard method, could still be considered as such when an image-derived input function is used. For full kinetic modeling (NLR), both dynamic scanning (tissue time–activity curve) and arterial sampling (arterial plasma time–activity curve) should be used. Arterial cannulation is less suitable for routine clinical response studies, where repetitive scans are required. Recently, measurement of the metabolic rate of glucose (MRglu) using an image-derived input function obtained from thoracic vascular structures has been validated against arterial blood sampling (11). In this study an image-derived input function was used, applying quality control measures as defined previously (10). However, manual ROI definition of the vascular structures (aorta, atrium, or ventricle) could introduce inter- and intraobserver variability. In addition, noise could be introduced by the limited number of counts acquired in each frame. Nevertheless, the ICC for both test–retest and intra- and interobserver variability was excellent, indicating that even when an image-derived input function is used NLR is a reproducible method for measuring glucose consumption. Therefore, it was used in our study as the gold standard for assessing other simplified methods.
Results of the other (simplified) analytic methods were correlated with NLR (Table 1; Fig. 1) and a cutoff value of r2 > 0.95 for selected methods that approach NLR. Although test–retest and inter- and intraobserver variation could also have been determined for the simplified methods, this analysis did not seem to be very useful. The main variability in NLR will be caused by variation in defining ROI over the blood pool for the image-derived input curve. By combining as many ROIs as possible over 3 different blood-pool structures, these variations can be minimalized (10). For simplified methods such as SUV, only tumor ROIs need to be defined and, as a semiautomatic program is used, variation will be much less than for NLR. Test–retest data only address variability for unchanged conditions. However, uptake of 18F-FDG in the tumor and distribution of 18F-FDG throughout the body may be expected to change because of the effects of therapy. These changes are taken care of in NLR (for each study a new input function is defined) but are not necessarily incorporated in simplified methods (24,25). Therefore, quantitative accuracy (i.e., correspondence with glucose consumption [NLR]) appears to be more relevant for response-monitoring studies.
As expected in the case of no dephosphorylation (k4 = 0), Patlak graphical analysis approaches the accuracy of NLR with the highest correlation obtained for the interval from 10 to 60 min after injection. Although this should be investigated for each tumor type, it is clear that, for NSCLC, Patlak graphical analysis is an excellent alternative for NLR. This would allow for a simpler scanning protocol (less frames) and the option to generate functional glucose consumption (MRglu) images.
For routine clinical use, an even simpler and shorter scanning protocol (single frame) would be preferable. However, methods using such a protocol have been criticized because they are based on several simplifying assumptions, which may not be valid in repeated (response monitoring) studies and thus may introduce errors in the final analysis (7). As for the semiquantitative SUV, correcting for BSA and plasma glucose appeared to be preferable over correcting for body weight or lean body mass in agreement with previous studies (25–27). Our findings contradict the recommendations made by the EORTC PET study group (8). They did not recommend correction for plasma glucose because of concern about the accuracy of measurements in many institutes. Our study indicates that an accurate correction should be used.
The net influx constant method described by Sadato et al. (18) also showed a good correlation with NLR. However, this method is directly proportional to SUV because it uses a fixed scaling factor for translating SUV into a measure of MRglu. The simplified kinetic method of Hunter et al. (17) showed even better agreement with NLR than with SUV. The method holds promise for routine clinical applications because it is requires only a static scan and a venous blood sample for the tail of the plasma input function (without having to measure the plasma curve itself).
The analytic methods used in 18F-FDG PET studies are simplifications of the underlying physiology. Variability in results can be induced by many factors, most of which can potentially be avoided at the cost of more complicated study protocols. Simplifications in the models can be implemented, however, at the cost of accuracy. This is important to keep in mind when selecting an analytic method for a study protocol. Selection of the degree of accuracy needed (i.e., method required) will depend on how large the differences are between responding and nonresponding tumors.
It is not possible to select the optimal method for response monitoring in NSCLC using the results of our study. This will be possible only in a larger series of patients where response data are compared with clinical outcome because selection of the optimal trade-off between accuracy and simplicity will depend on the actual changes being measured. The purpose of our study was primarily to reduce the multitude of available methods to a limited number of potentially worthwhile techniques, each with a different degree of complexity regarding correction factors used and scanning protocols. We suggest that the following methods be compared with NLR in a prospective clinical study: Patlak graphical analysis from 10 to 60 min, the simplified kinetic method at 40–60 min, and SUV corrected for BSA and plasma glucose at 40–60 min. Such a study is currently in progress in our institutions.
CONCLUSION
Even with an image-derived input function, NLR has excellent test–retest and observer agreement supporting its use as a gold standard method. Of a total of 34 potential analytic methods, 10 showed good correlation with NLR (r2 > 0.95). By taking into account the degree of complexity of the methods, only 4 remain. The actual value of these methods needs to be evaluated in a large prospective response-monitoring study that compares results with patient outcome.
For response-monitoring studies in NSCLC, the nomograms in this study also provide the possibility of converting results obtained by one analytic method to another. This will allow comparison across studies (i.e., meta-analysis).
Footnotes
Received Feb. 6, 2002; revision accepted Jun. 11, 2002.
For correspondence or reprints contact: Adriaan A. Lammertsma, PhD, Clinical PET Centre, VU University Medical Centre, P.O. Box 7057, 1007 MB Amsterdam, The Netherlands.
E-mail: aa.lammertsma{at}vumc.nl
REFERENCES
In this issue


Jump to section
Related Articles
Cited By...
- Reproducibility of MR-Based Attenuation Maps in PET/MRI and the Impact on PET Quantification in Lung Cancer
- Repeatability of SUV in Oncologic 18F-FDG PET
- Repeatability of 18F-FDG PET/CT in Advanced Non-Small Cell Lung Cancer: Prospective Assessment in 2 Multicenter Trials
- Repeatability of Quantitative FDG-PET/CT and Contrast-Enhanced CT in Recurrent Ovarian Carcinoma: Test-Retest Measurements for Tumor FDG Uptake, Diameter, and Volume
- Variability of Total Lesion Glycolysis by 18F-FDG-Positive Tissue Thresholding in Lung Cancer
- Repeatability of 18F-FDG Uptake Measurements in Tumors: A Metaanalysis
- Need for Standardization of 18F-FDG PET/CT for Treatment Response Assessments
- Monitoring Response to Antiangiogenic Therapy in Non-Small Cell Lung Cancer Using Imaging Markers Derived from PET and Dynamic Contrast-Enhanced MRI
- Repeatability of 18F-FDG PET in a Multicenter Phase I Study of Patients with Advanced Gastrointestinal Malignancies
- Standards for PET Image Acquisition and Quantitative Data Analysis
- Reproducibility of Tumor Perfusion Measurements Using 15O-Labeled Water and PET
- Comparison of Tumor Volumes Derived from Glucose Metabolic Rate Maps and SUV Maps in Dynamic 18F-FDG PET
- Long-Term Precision of 18F-Fluoride PET Skeletal Kinetic Studies in the Assessment of Bone Metabolism
- Chemotherapy Response Evaluation with 18F-FDG PET in Patients with Non-Small Cell Lung Cancer
- Dynamic and Static Approaches to Quantifying 18F-FDG Uptake for Measuring Cancer Response to Therapy, Including the Effect of Granulocyte CSF
- Sequential Positron Emission Tomography Using [18F]Fluorodeoxyglucose for Monitoring Response to Chemotherapy in Metastatic Breast Cancer.
- Prognostic Relevance of Response Evaluation Using [18F]-2-Fluoro-2-Deoxy-D-Glucose Positron Emission Tomography in Patients With Locally Advanced Non-Small-Cell Lung Cancer
- 18F-Fluoride PET for Monitoring Therapeutic Response in Paget's Disease of Bone
- Effects of Noise, Image Resolution, and ROI Definition on the Accuracy of Standard Uptake Values: A Simulation Study
- Within-Patient Variability of 18F-FDG: Standardized Uptake Values in Normal Tissues
- Prediction of Response to Preoperative Chemotherapy in Gastric Carcinoma by Metabolic Imaging: Results of a Prospective Trial
- Imaging Proliferation in Lung Tumors with PET: 18F-FLT Versus 18F-FDG
- Positron Emission Tomography in Non-Small-Cell Lung Cancer: Prediction of Response to Chemotherapy by Quantitative Assessment of Glucose Use