


Abstract
PET and 15O-labeled water (H215O) can be used to noninvasively monitor tumor perfusion. This allows evaluation of the direct target of antiangiogenic drugs, that is, tumor vasculature. Because these drugs often result in consolidation rather than regression of the tumor mass, a change in perfusion might be a more sensitive way to evaluate response than are indirect size measures on a CT scan. However, to use the technique for serial imaging of individual patients, good reproducibility is essential. The purpose of the present study was to evaluate the reproducibility of quantitative H215O measurements. Methods: Nine patients with non–small-cell lung cancer (NSCLC) were scanned twice within 7 d and before any therapy. All H215O scans were followed by an 18F-fluorothymidine scan to allow for adequate volume-of-interest (VOI) definition. VOIs were defined using a 3-dimensional threshold technique. Tumor perfusion and the volume of distribution (VT) were obtained using a 1-tissue-compartment model including an arterial blood volume component and an image-derived input function. The level of agreement between test and retest values was assessed using the intraclass correlation coefficient (ICC) and Bland–Altman analyses. Possible dependency on absolute values and lesion size was assessed by linear regression. Results: All primary tumors and more than 90% of clinically suspected locoregional metastases could be delineated. In total, 14 lesions in 9 patients were analyzed. Tumor perfusion showed excellent reproducibility, with an ICC of 0.95 and SD of 9%. The VT was only moderately reproducible, with an ICC of 0.52 and SD of 16%. No dependency was found on absolute values of perfusion (P = 0.14) and VT (P = 0.15). In addition, tumor volume did not influence the reproducibility of perfusion (P = 0.46) and VT (P = 0.25). Conclusion: Quantitative measurements of tumor perfusion using H215O and PET are reproducible in NSCLC. When patients are repeatedly being scanned during therapy, changes of more than 18% in tumor perfusion and 32% in VT (>1.96 × SD) are likely to represent treatment effects.
Because of the limited effects of cytotoxic chemotherapy, interest is increasing in more specific molecular targeted therapeutics for cancer treatment. At present, the most promising therapy for non–small-cell lung cancer (NSCLC) is provided by antivascular or antiangiogenic agents, which target the tumor vascular system. In tumor size and the associated standard size–based approach for monitoring response (Response Evaluation Criteria in Solid Tumors) (1), the effects of antivascular or antiangiogenic agents are not as dramatic as those with classic chemotherapeutics, because antiangiogenic agents often result in consolidation rather than regression of the tumor mass. Because the effect of these agents is not major cell kill, 18F-FDG might not be the ideal tracer for monitoring treatment response with PET. H215O, on the other hand, offers the opportunity to measure tumor perfusion, reflecting vascular status. This method, by allowing for monitoring of the direct target of antiangiogenic drugs, may be superior to indirect measures such as tumor size. Early reports (phase I and phase II trials) have supported this hypothesis (2–4). Another advantage of H215O is the short half-life of 15O (2 min), which allows for serial measurements within a single scan session, enabling the evaluation not only of long-term effects but also of immediate effects of an intervention.
To interpret the effects of treatment, however, test–retest variability needs to be known. Although it has been determined for H215O studies of cerebral and myocardial blood flow (5–7), only little information is available for tumor perfusion studies, in which flow might be much more variable (8–10). Therefore, the purpose of the present study was to assess the reproducibility of quantitative tumor blood flow measurements in patients with NSCLC using H215O and PET.
MATERIALS AND METHODS
Eligible patients were prospectively included after informed consent was obtained in accordance with approval by the Medical Ethics Committee of VU University Medical Centre. Nine patients with advanced-stage NSCLC were scanned twice within 7 d (mean, 2.4 d) and before any treatment, using an ECAT EXACT HR+ scanner (Siemens/CTI). This scanner has an axial field of view of 15 cm, divided into 63 contiguous planes. On the basis of prior CT data, the patient was positioned supine on the scanner bed with the tumor in the center of the axial field of view. All patients received a venous catheter for radiotracer injection. Acquisition started with a 10- to 15-min transmission scan to correct for photon attenuation (11). Next, a bolus injection of 1,100 MBq of H215O was administered through an injector (Medrad International) at 0.8 mL/s, after which the line was flushed with 42 mL of saline (2.0 mL/s). Simultaneous with the injection of H215O, a dynamic emission scan (in 2-dimensional acquisition mode) was started, which lasted 10 min and had variable frame lengths (12 × 5 s, 12 × 10 s, 6 × 20 s, and 10 × 30 s). After an interval of 10 min to allow for the decay of 15O, a bolus of 370 MBq of 18F-FLT in 5 mL of saline was injected through the same injector at the same speed and with the same flushing protocol. Simultaneous with the injection of 18F-FLT, a dynamic emission scan (in 2-dimensional acquisition mode) was started. It had a total duration of 60 min and variable frame lengths (6 × 5 s, 6 × 10 s, 3 × 20 s, 5 × 30 s, 5 × 60 s, 8 × 150 s, and 6 × 300 s). All dynamic scan data were normalized; corrected for dead time, decay, scatter, randoms, and photon attenuation; and reconstructed as 128 × 128 matrices using filtered backprojection (FBP) with a Hanning filter (cutoff, 0.5 cycle per pixel). This resulted in a transaxial spatial resolution of around 7 mm in full width at half maximum.
Image Analysis
Volumes of interest (VOIs) were defined separately for each scan using a semiautomatic threshold technique (41% of the maximum pixel value with correction for local background) for any lesion with adequate focal uptake (12). VOIs were defined on 18F-FLT images because of their superior contrast between tumor and background. To assess whether VOIs could be defined without the use of an additional scan, VOIs were also defined on parametric flow images, which were generated using a basis-function approach (13). For 18F-FLT, the last 3 frames of the 18F-FLT sinograms (45–60 min after injection) were summed and reconstructed using ordered-subset expectation maximization with 2 iterations and 16 subsets followed by postsmoothing of the reconstructed image using a gaussian filter of 5 mm in full width at half maximum to obtain the same resolution as the one obtained for the FBP images. For H215O, parametric images were constructed by the use of basis functions (Appendix, Eq. 4A). Delineation of lesions with limited tumor-to-background contrast (due to low focal uptake or high background activity) is difficult and hampered by observer variation. Therefore, only lesions that required minor or no manual delineation were included. In the latter case, background values were set to zero for voxels adjacent to the VOI that had physiologically high 18F-FLT uptake (hematopoietic bone marrow, liver tissue, and hypervascular areas such as the mediastinum) to prevent inclusion of such voxels in the VOI. For VOIs defined on parametric flow images, the same procedure was followed for adjacent hypervascular or well-perfused areas. After this procedure, the threshold technique was applied, resulting in volumes specifically containing tumor. Tumor VOIs were transferred to FBP-reconstructed dynamic H215O images for generating time–activity curves. An image-derived input function (IDIF) was obtained by manually drawing multiple 2-dimensional regions of interest over the aortic arch using FBP data (14,15). Regions of interest were drawn in the appropriate frame with optimal aorta-to-background contrast (first pass of H215O bolus) and were then applied to all frames to generate input time–activity curves. The 18F-FLT scans were obtained to allow for adequate VOI definition. The focus of the present study was, however, on the reproducibility of perfusion measurements, and therefore, 18F-FLT results will be reported elsewhere.
Data Analysis
Tumor perfusion and volume of distribution (VT) were estimated by fitting tumor time–activity curves using standard nonlinear regression techniques and a single-tissue-compartment model together with an IDIF and weighting data for acquired counts and frame duration (16). Both a model with and a model without inclusion of an arterial blood volume component (VA) were explored. Model equations are provided in the Appendix. The presence of VA, and the need to include this in the compartment model, were assessed by comparing the residual sum of the squares of fits with and without VA, using Akaike and Schwarz criteria (17–19).
If the SE of either fitted perfusion or VA exceeded 25%, the lesion was excluded from further analysis. The level of agreement between test and retest values was assessed using the intraclass correlation coefficient (ICC) with a 2-way random model with absolute agreement and Bland–Altman analysis (20). In the latter case, the percentage difference (Δ) values between 2 measures was plotted against the mean of both measures and the mean threshold-defined volume. In this way, possible dependency on both absolute values and tumor size could be visualized. Statistical dependency was analyzed using linear regression. Finally, a 1-sample t test was applied to the Δ values to assess systematic bias.
RESULTS
All primary lesions and more than 90% of all clinically suspected locoregional metastases could be delineated, including mediastinal lymph nodes, using 18F-FLT images for VOI definition. In total, 14 lesions in 9 patients were analyzed. One hilar lymph node of 1.8 cm3 was excluded from analysis because of an SE of greater than 25% (49%) of the estimated perfusion value in 1 of the 2 scans, possibly due to patient movement.
Only 8 lesions in 8 patients could be defined using VOIs defined on parametric flow images, as a result of less contrast. In addition, for this limited number of lesions, reproducibility of perfusion for these VOIs was significantly poorer than that for corresponding VOIs defined on 18F-FLT images (data not shown). Consequently, in the remainder only results for 18F-FLT–defined VOIs are shown.
Individual data are presented in Table 1. Median lesion size (threshold volume as defined on the 18F-FLT images) was 12.9 cm3 (range, 2.0–89.8 cm3), median perfusion was 0.43 mL × min−1 × g−1 (range, 0.28–0.75 mL × min−1 × g−1), and median VT was 0.79 (range, 0.59–1.13). The single-tissue-compartment model including VA provided better fits than did the model without VA in 22 (79%) and 25 (89%) of 28 lesions, respectively, according to Akaike and Schwarz criteria. Therefore, all analyses were performed for data obtained with the model including an arterial blood component.
Absolute Values for Both Test and Retest Scans of All Patients
Perfusion showed excellent reproducibility, with an ICC of 0.95 (95% confidence interval, 0.86–0.99) and SD of 9% for percentage and 0.037 for absolute change. The VT was moderately reproducible, with an ICC of 0.52 (95% confidence interval, −0.21 to 0.82) and SD of 16% for percentage and 0.136 for absolute change. These data show that a change of less than 18% in tumor perfusion and 32% in VT (<1.96 × SD) is likely to be due to test–retest variability.
Both visual assessment of Bland–Altman plots and linear regression analysis showed no dependency on the absolute level of perfusion (P = 0.14) and VT (P = 0.15) or on tumor volume as measured with PET (perfusion, P = 0.46; VT, P = 0.25) (Fig. 1). In addition, no evidence of systematic bias was found (P > 0.80 for both). Finally, variability in 18F-FLT–defined VOI size had no significant effect on the reproducibility of perfusion (P = 0.39) or VT (P = 0.16).
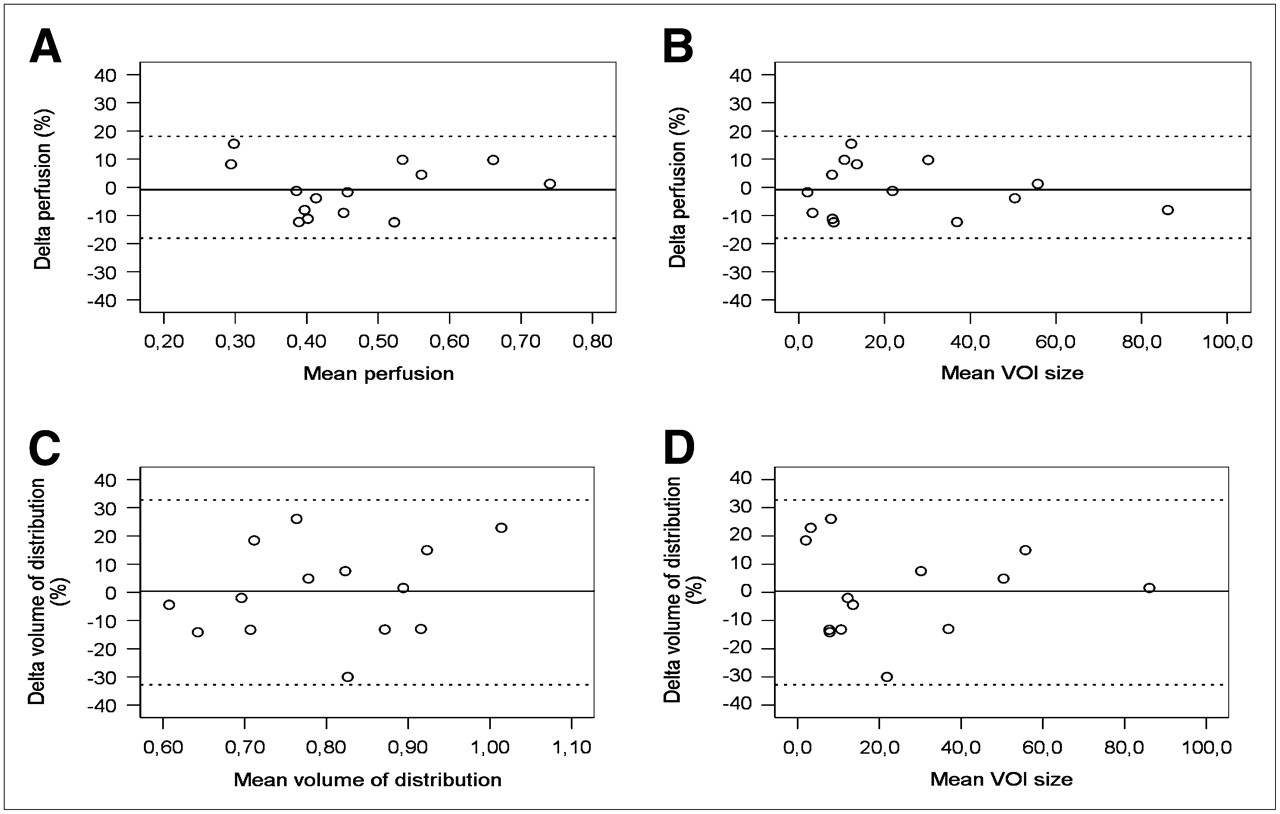
Bland–Altman plots for tumor perfusion and VT. Delta is percentage change between test and retest scans. Mean VOI size is mean tumor volume of test and retest scans in cubic centimeters. Straight lines represent mean values and dotted lines ±1.96 × SD values.
DISCUSSION
The main finding of the present study is that in patients with NSCLC, tumor blood flow can be measured reproducibly using H215O and PET. When patients are followed over time, a change of more than 18% in tumor perfusion and more than 32% in VT is likely to represent a biologic effect. No significant dependency on absolute values or lesion size was found, which implies that the same threshold can be used for all tumor lesions. Only 1 (small) lesion was excluded because of an SE of more than 25% for the estimated perfusion value. Because this was the case in only 1 of the 2 scans, patient movement seems to be the most likely cause.
There have been several reports on the reproducibility of H215O PET measurements in brain (5,6) and myocardium (7) and some in other nontumor tissues (21,22). Although studies show excellent reproducibility, these results cannot easily be translated to an oncologic setting because of differences in VOI definition, tissue characteristics, and perhaps most important, heterogeneity, which can be substantial in tumors. The latter can cause underestimation of perfusion measurements (23), which in turn might result in decreased reproducibility. Two 15O inhalation PET studies have been performed to explore reproducibility of perfusion measurements in a limited range of tumors (mainly hepatic lesions) within a small number of patients (8,9). The dual hepatic blood supply (portal vein and hepatic artery) complicates quantification of perfusion in the liver (24). Consequently, it is difficult to compare blood flow measurements in hepatic lesions with those in tumors of other origin. Wells et al. (8) analyzed 7 lesions (6 liver, 1 lung) in 5 patients and found ICCs and SDs of 0.89 and 29% for perfusion and 0.96 and 12% for VT, respectively. Wilson et al. (9) reported on 5 breast tumors in 5 patients and found differences of up to ±10% for perfusion measurements. The relatively low reproducibility of perfusion measurements in the study by Wells et al. (8) might be because of an inadequate definition of the input function, caused by either the dual hepatic input or delay and dispersion of the measured input function (arterial blood sampling). In contrast to IDIF, arterial blood sampling requires corrections for delay and dispersion (9,25), and this could have affected accuracy (26). On the other hand, reproducibility of VT was excellent, a finding that could not be reproduced in the present study. This might be due to the relatively high amount of noise in the tail of IDIF curves as compared with the much smoother input curves derived from arterial blood sampling (Fig. 2).
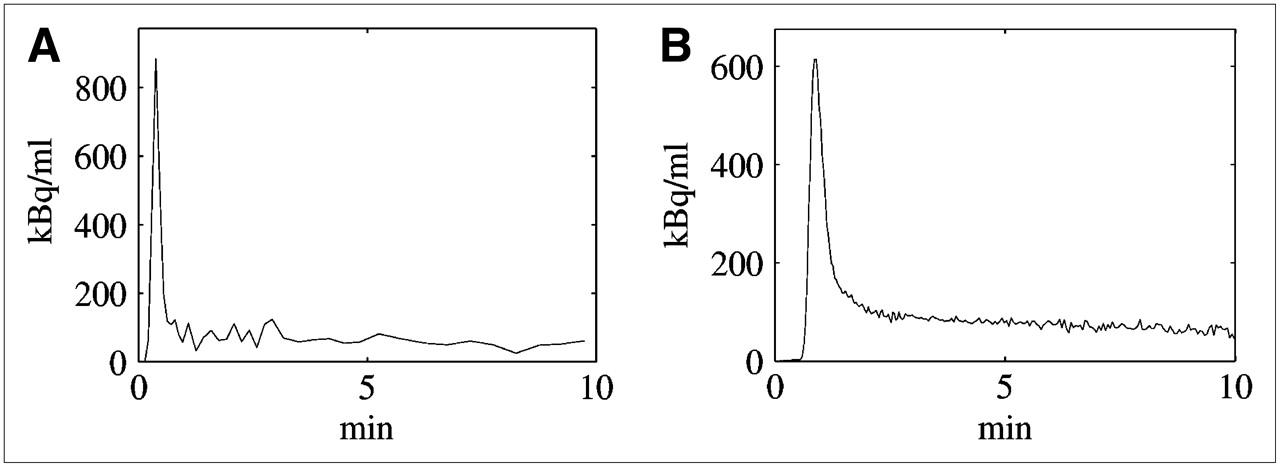
Time–activity curves of arterial input function for 2 different patients demonstrated by IDIF (A) and arterial blood sampling (B). IDIF peak is sharper, because it does not suffer from dispersion. On the other hand, tail is noisier because of poorer count statistics.
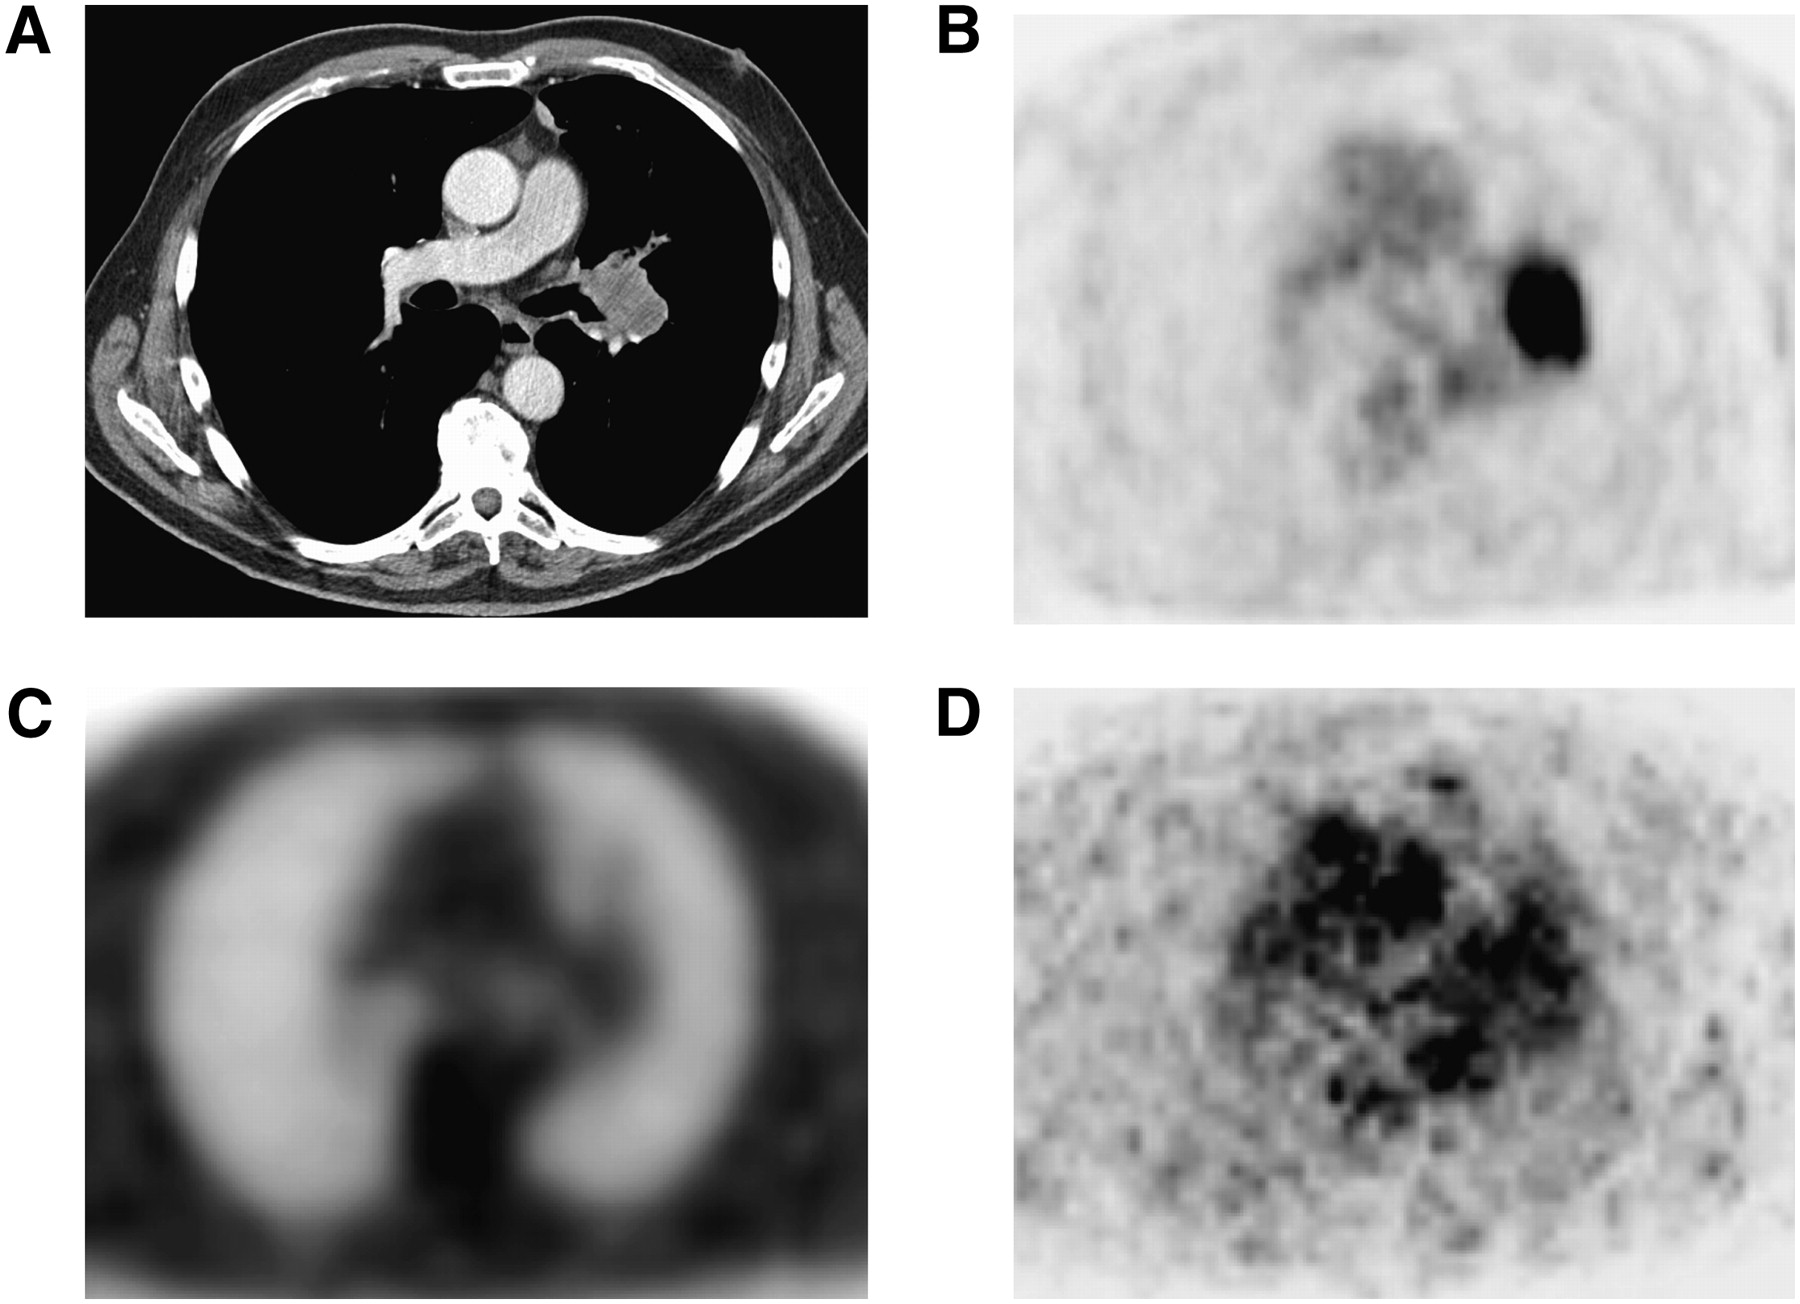
Definition of tumor VOI is difficult for H215O studies because of low tumor-to-background contrast. Many methods have been proposed for VOI definition, including the use of CT (27), H215O itself (9), 18F-FDG (19,28,29), or a combination of anatomic (CT or PET transmission) and functional (H215O) images (3,8,30) (Fig. 3).

CT (A), 18F-FDG PET emission (B), PET transmission (C), and H215O PET emission (1–4 min after injection) (D) images that can be used for VOI definition. All images are from same patient.
It is likely that the lack of H215O test–retest and response monitoring studies is partly because of the VOI definition problem. In the present study a threshold technique was applied to a subsequent 18F-FLT scan. A lower limit of 41% of the maximum pixel value was chosen, because this best reflects true tumor volume (12). That definition of VOI was not restricted to 18F-FLT–abundant voxels within the tumor regions. This could have led to bias, because the relationship between perfusion and proliferation in tumors is not known. As a result of the use of a separate 18F-FLT scan for VOI definition, total scan duration was 90 min. The addition of an 18F-FLT scan to the acquisition protocol also led to an increase in radiation load. The total amount per patient in this study was approximately 20 mSv. Although all patients had advanced-stage disease with a limited estimated life expectancy of 8–10 mo (31), limitation of radiation load would become important when patients with early-stage disease are being scanned or when better treatment becomes available for those with advanced-stage disease.
If VOIs could be defined without the use of an 18F-FLT scan, total scan time could be reduced to about 20 min and radiation dose to approximately 2.5 mSv. Therefore, an additional analysis was performed, defining VOIs on parametric flow images. Parametric images rather than summed H215O images were used, because the latter suffer from contamination of (high) intraarterial signals. Nevertheless, because of perfusion of the surrounding tissue, 6 of 14 lesions could not be defined using these parametric images. In addition, reproducibility was inferior to that for 18F-FLT–defined VOIs (test–retest variability 15% for parametric VOIs, compared with 9% for 18F-FLT–defined VOIs). Consequently, this approach does not seem to be a viable option for routine response-monitoring studies. The use of a separate CT scan for VOI definition was not attempted, as even a small misalignment between CT and PET scans could result in erroneous flow values, especially for smaller lesions.
With the introduction of integrated PET/CT, however, it is likely that the CT scan can be used for VOI definition, making the additional 18F-FLT scan (or that of another tissue-accumulating tracer) obsolete. This would reduce scan time to less than 15 min. Radiation dose of H215O PET/CT studies would primarily be determined by the CT scan protocol (amount of milliamperes applied and body parts scanned), because H215O studies themselves only account for a small dose because of the short half-life of 15O. Nevertheless, further studies using a PET/CT scanner are required to assess reproducibility for CT-defined VOI.
Another reason for the limited number of oncologic H215O studies might be the relatively limited availability of on-site cyclotrons, which are needed because of the short half-life of 15O (2 min). However, when both PET/CT and an on-site cyclotron are available, perfusion studies can be performed with relative ease for both patient and physician. The production of H215O requires minimal staff, scan time is short, and, at least for patients with NSCLC, there is no need for arterial cannulation. In addition, the present results indicate that tumor perfusion measurements are reproducible.
CONCLUSION
With the increasing use of antiangiogenic drugs and other targeted agents, suitable biomarkers are desired to evaluate response to such treatment. Biologic imaging offers the unique opportunity to noninvasively monitor treatment effects, irrespective of size changes. In this study we have shown that tumor perfusion measurements are reproducible in patients with NSCLC using H215O PET and an IDIF. Our data suggest that future intervention studies should apply a 20% cutoff value to define response to treatment.
APPENDIX
Modeling Perfusion Data.
For the present study, perfusion measurements were based on the original tracer kinetic model proposed by Kety (33), using the implementation presented by Hoekstra et al. (16).
In brief, in a dynamic scan, dCT(t)/dt (the change in tissue concentration) of a tracer at a certain time point is equal to K1 (the plasma-to-tissue transport rate constant) multiplied by CP(t) (the tracer concentration in plasma) minus k2 (the tissue-to-plasma rate constant) multiplied by the tracer concentration in tissue (CT) at that time point: Eq. 1ABecause water is freely diffusible (i.e., extraction is 100%), K1 is equal to perfusion (F). In addition, in case of blood flow, the delivery is not determined by the plasma concentration but rather by the whole-blood concentration, CB. Thus, for H215O, Equation 1A can be rewritten as:
 Eq. 2AThe solution of this equation, including a fractional arterial blood volume (VA), is:
 Eq. 3AA nonlinear, least-squares fit of this function to the measured time–activity curve in the tissue of interest (CT(t)) yields perfusion and VT (9). If VA is negligible, it can be set to zero before fitting, thereby increasing precision of perfusion and VT estimates.
Parametric Images.
Parametric images can be obtained using a basis-function implementation of the same single-tissue-compartment model: Eq. 4AIn this approach, first a set of basis functions exp(−βit)
  CB(t) is created by convolution of the whole-blood input function with a set of single exponential functions. In the present study, a set of exponential constants, βi, was used, ranging from 0.01 to 1 min−1. Next, for each basis function all voxels were fitted to Equation 4A using simple linear regression. Finally, for each voxel, the linear fit (i.e., basis function) was selected that provided the best fit. Because parametric images were generated only for VOI definition, in the present study VT was fixed to 0.75 to reduce noise (13,19,21).
Footnotes
-
COPYRIGHT © 2008 by the Society of Nuclear Medicine, Inc.
References
- Received for publication April 16, 2008.
- Accepted for publication July 10, 2008.


Jump to section
Related Articles
Cited By...
- 11C-Sorafenib and 15O-H2O PET for Early Evaluation of Sorafenib Therapy
- 15O-Water PET Study of the Effect of Imatinib, a Selective Platelet-Derived Growth Factor Receptor Inhibitor, Versus Anakinra, an IL-1R Antagonist, on Water-Perfusable Tissue Fraction in Colorectal Cancer Metastases
- Monitoring Response to Antiangiogenic Therapy in Non-Small Cell Lung Cancer Using Imaging Markers Derived from PET and Dynamic Contrast-Enhanced MRI
- Myocardial Oxygen Extraction Fraction Measured Using Bolus Inhalation of 15O-Oxygen Gas and Dynamic PET
- Quantitative Parametric Perfusion Images Using 15O-Labeled Water and a Clinical PET/CT Scanner: Test-Retest Variability in Lung Cancer
- Quantitative Assessment of Hypoxia Kinetic Models by a Cross-Study of Dynamic 18F-FAZA and 15O-H2O in Patients with Head and Neck Tumors
- Decreased Blood Flow with Increased Metabolic Activity: A Novel Sign of Pancreatic Tumor Aggressiveness