


Abstract
Several kinetic models have been proposed to assess the underlying oxygenation status behind hypoxia tracer uptake and have shown advantages, compared with static analysis, in discriminating hypoxic regions. However, the quantitative assessment of mathematic models that take into consideration clinical applications and their biologic nature is still challenging. We performed a feasibility study to assess hypoxia kinetic models using voxelwise cross-analysis between the uptake of the perfusion tracer 15O-H2O and the hypoxia tracer 18F-fluoroazomycin arabinoside (18F-FAZA). Methods: Five patients with advanced head and neck cancer were included. For each patient, dynamic sequences of 15O-H2O for 5 min and 18F-FAZA for 60 min were acquired consecutively after injections of approximately 1 GBq and 300 MBq of each tracer, respectively. The compartment model, Thorwarth model, Patlak plot, Logan plot, and Cho model were applied to model the process of tracer transport and accumulation under hypoxic conditions. The standard 1-tissue-compartment model was used to compute a perfusion map for each patient. The hypoxia kinetic models were based on the assumption of a positive correlation between tracer delivery and perfusion and a negative (inverse) correlation between tracer accumulation (hypoxia) and perfusion. Results: Positive correlations between tracer delivery and perfusion were observed for the Thorwarth and Cho models in all patients and for the reversible and irreversible 2-compartment models in 4 patients. Negative correlations between tracer accumulation and perfusion were observed for the reversible 2-compartment model in all patients and for the irreversible 2-compartment model and Cho model in 4 patients. When applied to normal skeletal muscle, the smallest correlation variance over all 5 patients was observed for the reversible 2-compartment model. Conclusion: Hypoxia kinetic modeling delivers different information from static measurements. Different models generate different results for the same patient, and they even can lead to opposite physiologic interpretations. On the basis of our assessment of physiologic precision and robustness, the reversible 2-compartment model corresponds better to the expectations of our assumptions than the other investigated models.
Kinetic modeling is an important method to assess the underlying physiology behind tracer uptake in molecular imaging (1). Four-dimensional spatial–temporal images were acquired to observe the behavior of the radiotracer in the region of study, and estimations of quantitative biologic parameters can be achieved by fitting a mathematic model to the time–activity curve of a region of interest or a certain voxel. Compartment models define physiologically different pools of tracer substance as compartments and set up the relationship between these compartments using linear differential equations (1,2). Reference tissue models were developed to avoid blood sampling by selecting a region without specific binding of the ligand (3). Linearization can be applied to compartment models leading to graphical models (4,5), which assume an equilibrium state of the tracer and use linear regression to identify tracer kinetics.
Although there are many well-developed models that cover a broad range of applications, the performance of these models depends on the precision and robustness of both physiologic description and mathematic capability. Understanding the merits and limitations of the different models is important (6). The models can be evaluated using a validated gold standard such as microsphere-based measurement for myocardial blood flow models (6) and blood sampling for reference tissue models (7). Mathematic performance of the models can be assessed using computational simulations (8–10).
Tumor hypoxia is considered a main resistance factor of standard radiotherapy and some chemotherapy. It is characterized by an oxygen tension below a certain level (11), which can be measured with the Eppendorf polarographic system (12). Although the electrode oximetry is widely accepted as a gold standard for hypoxia detection, it is limited by its invasiveness and is feasible only for easily accessible tumors. Various indirect strategies have been proposed to detect the tumor oxygen status noninvasively (e.g., with PET) (13). Several hypoxia-specific tracers have been proposed for tumor hypoxia imaging, such as 18F-fluoromisonidazole (18F-FMISO) (14,15), 18F-fluoroerythronitroimidazole (16), and 60/61/64Cu-diacetyl-bis(N4-methylthiosemicarbazone) (17). 18F-fluoroazomycin arabinoside (18F-FAZA) is a marker that accumulates quickly in cells under hypoxic conditions (18,19).
In practice, hypoxia tracers diffuse over long distances before reaching hypoxic cells, and the characteristic diffusion time varies for different tumor cells (20); thus, a static evaluation is not sufficient to discriminate hypoxia from the background (21). In contrast, kinetic modeling is able to assess the cellular reaction rate of the tracer accumulation and thus is potentially more reliable for hypoxia assessment. Casciari et al. attempted using a 4-compartment model with 8 free parameters to determine the cellular reaction rate of 18F-FMISO (22). A certain number of parameters usually need to be fixed in real applications. Thorwarth et al. proposed a specific model to identify the tumor oxygen status by decomposing the time–activity curve into perfusion, diffusion, and hypoxia-induced retention components based on the 2-compartment model (21). Recently, Cho et al. proposed an empiric model that assessed hypoxia by the slope of the late phase of dynamic activities (23).
Although these models have been applied to hypoxia, the behavior of the models in regard to oxygen status is generally not clear. Immunohistologic studies with pimonidazole as a hypoxia marker were used as a reference to compare with static hypoxia tracer uptake (24,25) and the modeling results of the Cho model (23) in preclinical studies. Voxelwise correlations between pimonidazole intensity and 18F-FMISO counts were assessed in tumor regions (25). Although a good positive correlation was reported, the similar accumulation mechanisms between pimonidazole and 18F-FMISO make it difficult to interpret the correlation for the assessment. In addition, such comparison is usually difficult for clinical studies. Thus, it is still challenging to evaluate different hypoxia models with regard to the clinical relevance.
The correlation between blood supply and oxygen status has been analyzed using specific PET tracers for hypoxia and perfusion (26,27). In this study, we focused on the application of kinetic models to tumor hypoxia and performed a feasibility study based on a cross-analysis of the uptake of the perfusion tracer 15O-H2O and the hypoxia tracer 18F-FAZA to evaluate these models.
MATERIALS AND METHODS
Patient Data
Five patients, as shown in Table 1, with locally advanced squamous cell head and neck cancer were investigated. Before the PET study, all patients underwent CT or MRI. The study protocol was approved by the ethics committee of the Technische Universität München and was tolerated well by the patients.
Patient Characteristics and Voxelwise Correlations Between Static Uptake of 18F-FAZA (at 1 Hour After Injection) and 15O-H2O (at 40–70 Seconds After Injection) in Tumor Region
Patients were positioned supine on a multiring whole-body PET scanner (ECAT HR+; CTI/Siemens) and immobilized with individually customized 3-point-fixation thermoplastic masks during the whole study for 75–80 min. Approximately 1 GBq of 15O-H2O was injected intravenously, and dynamic images were acquired for 5 min with the following protocol: 12 frames × 5, 6 × 10, and 6 × 30 s. Arterial blood samples (9–17) were taken during the scanning. At 10–15 min after the 15O-H2O study, dynamic data were acquired for 1 h after an intravenous injection of around 300 MBq of 18F-FAZA using the following protocol: 12 frames × 10, 6 × 30, 2 × 150, 4 × 300, and 3 × 600 s. Meanwhile, an additional 21–34 venous blood samples were acquired for each patient.
The images were obtained in 2-dimensional mode and reconstructed using a filtered backprojection algorithm with the Hanning filter at a cutoff frequency of 0.4 cycle/pixel. Attenuation correction was performed using a transmission scan with 3 rotating 68Ge rod sources. Additionally, all measurements were corrected for physical decay, random counts, and dead time. The voxel size of the reconstructed images was 4.29 × 4.29 × 2.425 mm. A gaussian filter of 8 × 8 × 6 mm was applied to the PET data before further analysis.
The tumors were contoured manually on the CT or MR images using the BrainLab iPlan 4.0 system (BrainLab). The CT or MR images, which were obtained without using the immobilization mask, were coregistered with the summed images of all the temporal frames of the 18F-FAZA PET data for each patient using PMOD software (version 3.0; PMOD Technologies) based on mutual information. The accuracy of the registration was proven by a physician.
Model Assessment Criteria
Besides limited extravascular diffusion, the main cause for the development of hypoxia is a decreased supply of oxygen, which is strongly related to perfusion within a tumor (11). On the basis of this knowledge, tumor cells are more likely hypoxic when perfusion is low than when perfusion is high. We used this special relationship between hypoxia and perfusion to evaluate various kinetic models in patients with large tumors. In particular, we hypothesized that the correlation between tracer delivery and perfusion was positive and the correlation between hypoxia and perfusion was negative (inverse).
Furthermore, we assumed the following for physiologic robustness assessment: the correlation of underlying physiologic characteristics for normal muscle is relatively consistent.
On the basis of this assumption, the resulting correlation between 18F-FAZA and 15O-H2O should behave similarly for different patients. The SD σ of the correlation coefficients for all patients was computed and compared between each model. The model, which results in low σ, is expected to be more physiologically robust.
Static Analysis
A voxelwise correlation of the static uptake between 18F-FAZA (at 1 h after injection) and 15O-H2O (at 40–70 s after injection) is shown in Table 1. In this study, we use the Pearson correlation coefficient r as the index for the correlation of 2 datasets. The value of this coefficient ranges from −1.0 to 1.0. The correlation type is described by the sign of the coefficient, and the strength of the correlation is represented by the magnitude of the coefficient.
Input Function
To construct a suitable input function for kinetic modeling, both image-based carotid artery selection (28) and blood sampling of arterial or venous blood were considered. Blood sampling was corrected for delay and then used for the correction of an image-derived input function. We took the peak part of the input function from the image-based method and the rest from blood samples. After that, a 3-parameter exponential model (Eq. 1) was applied to fit the corrected raw input data (29):
One example of the fitted blood input function for our computation is shown in Figure 1, together with the averaged time–activity curves of whole tumors and in the musculature of the neck region (behind the cervical spine).
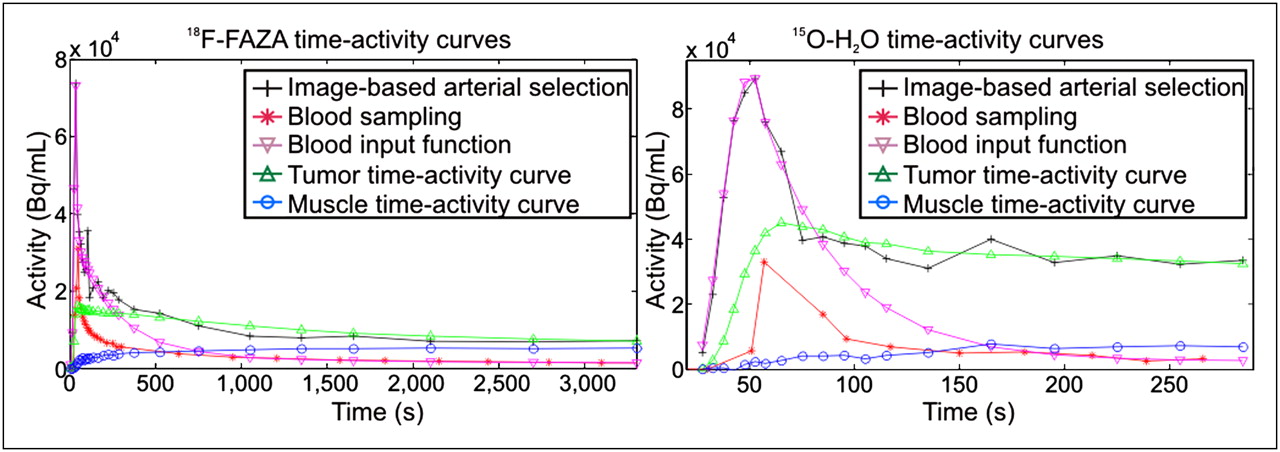
Blood input curves and time–activity curves of whole tumor region and 1 normal muscle region for patient 2.
Dynamic 15O-H2O Modeling
The left half of Figure 2 illustrates the transport mechanism of 15O-H2O. It is a freely diffusible tracer, which passes through the blood vessel walls rapidly and quickly diffuses through the interstitial and intracellular space. During this process, 15O-H2O is inert and thus not metabolized. The 1-compartment model (30) was applied, which assumes a compartment of extravascular space in addition to the blood compartment (intravascular space). The linear relationship between the blood compartment and the tissue compartment is described in the following equation:

Illustration of different transport mechanisms between 15O-H2O and 18F-FAZA.
Dynamic 18F-FAZA PET Modeling
The right half of Figure 2 illustrates the transport mechanisms of 18F-FAZA. It is a relatively large molecule, which diffuses slowly through capillary walls and in the interstitium. Once it reaches hypoxic areas, 18F-FAZA is trapped in the intracellular space by oxygen reduction of the 2-nitroimidazoles. To demonstrate this dynamic process, several models that have been used to analyze tumor hypoxia were applied, including the compartment model (22), Patlak plot (31), Logan plot (27), Thorwarth model (21), and Cho model (23).
2-Tissue-Compartment Model.
The high number of free parameters in the 4-compartment model (22) makes voxelwise fitting difficult. For this reason, we applied the standard 2-tissue-compartment model (1) to model the process of 18F-FAZA delivery and accumulation.
The 2-tissue-compartment model assumes 2 compartments in the tissue space. The first compartment is for the free 18F-FAZA concentration CD(t) in the interstitial space and intracellular space, and the second is for the trapped 18F-FAZA concentration CA(t) in the intracellular space. K1 stands for the rate of diffusion from plasma to tissue and k3 for the tracer accumulation rate. k2 and k4 are the rate constants representing the transport rate from interstitium to plasma and the dissociation rate of the trapped ligands, respectively.
Linear differential equations were used to model the relationships between these compartments considering diffusion only:
Thorwarth Model.
The Thorwarth model is derived from the irreversible 2-tissue-compartment model and is dedicated to hypoxia modeling (21). It decomposes the measured time–activity curve CT(t) into perfusion, diffusion, and retention curves. Here, w0, wD, and wA are the corresponding weights of each component according to the following equation:
To compare the Thorwarth model under the same condition as the other models, we used the same input function instead of using the reference tissue originally proposed by this model.
Graphical Models.
The Patlak model (4) is a linearization of the irreversible 2-compartment model, which fits the equation:
The Logan model (5) is a linearization of the reversible 2-compartment model, which fits the equation:
Cho Model.
The 2-tissue-compartment, Thorwarth, and graphical models require correct input of blood activity. However, it is difficult to acquire precise information for blood activity. Cho et al. assumed that the retention slope of the last phase of the dynamic scan is a key factor in determining tumor hypoxia and proposed an empiric model (23). This model extracts the tracer delivery index, “early,” by averaging the activities in the first frames. The tracer accumulation index, “late,” is determined from the slope of a straight-line fitting of the last frames. Considering an acquisition time of 1 h for our 18F-FAZA study, we set the first 4 min to be the early phase and the last 40 min to be the late phase.
Voxelwise Model Assessment
Voxelwise computing was performed for each investigated kinetic model, and the correlation of the hypoxia kinetic features and water perfusion was compared voxel by voxel for each patient (Fig. 3).
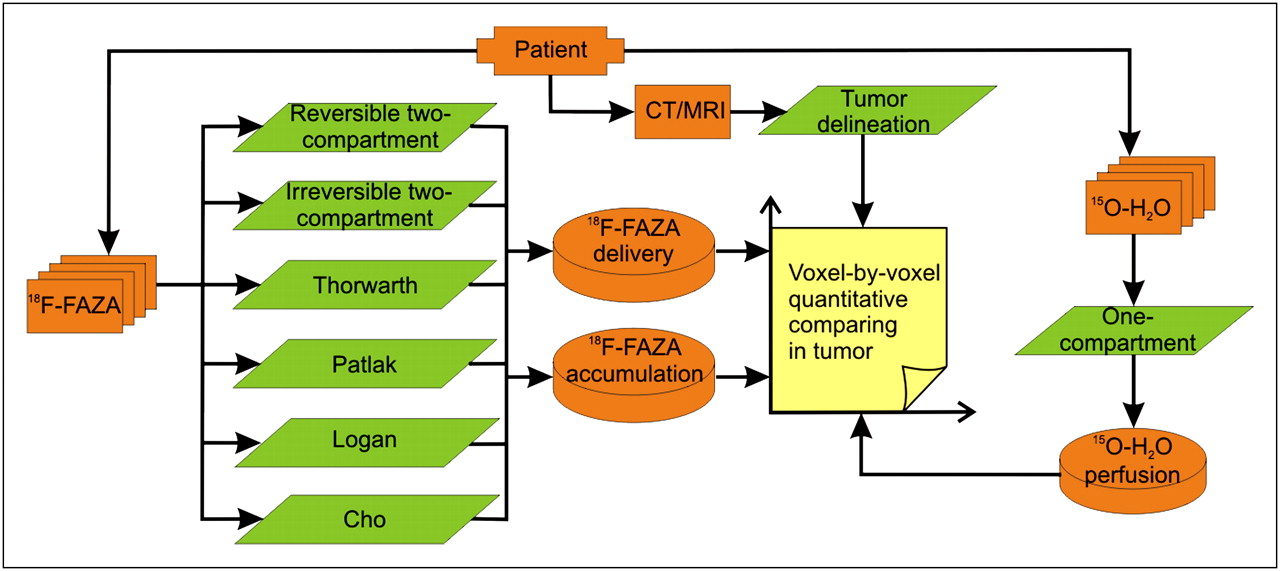
Procedure for quantitative comparison of hypoxia kinetic models.
In addition to cross-analysis in tumor regions, the correlation of the modeling results for 18F-FAZA and 15O-H2O was investigated in the musculature of the neck region (behind the cervical spine) to test the physiologic robustness of the model.
Voxelwise comparison and modeling of the compartment model and the graphical model were done using the PMOD software. The Thorwarth and Cho models were implemented using the in-house–developed software MobiTUM (version 1.0).
RESULTS
The residual activity of 15O-H2O ranged from 200 to 1,000 Bq/mL at the start of the 18F-FAZA acquisition. After 1 h, there was around 800–2,000 Bq of 18F-FAZA activity per milliliter in the blood circulation. A series of 18F-FAZA images (patient 2) is shown in Figure 4.

Six frames of 18F-FAZA PET of a slice for patient 2. Regions of interest outline region of tumor, and t denotes time of start of frame.
The correlations between the kinetic features of different models for 18F-FAZA and the perfusion of 15O-H2O flow in the tumor region are shown in Tables 2 and 3. Table 2 shows the correlation between the modeling results of 18F-FAZA delivery and perfusion, and Table 3 shows the correlation between the modeling results of the 18F-FAZA accumulation and perfusion.
Voxelwise Correlations Between 18F-FAZA Delivery and Corresponding 15O-H2O Perfusion in Tumor Region for Each Patient
Voxelwise Correlations Between 18F-FAZA Accumulation and Corresponding 15O-H2O Perfusion in Tumor Region for Each Patient
The Cho model shows strong positive correlations between the 18F-FAZA delivery and 15O-H2O perfusion for 4 patients (patients 1–3 and 5) and a weak positive correlation for 1 patient (patient 4). Both the reversible and the irreversible 2-compartment models show positive correlations for 3 patients (patients 1, 2, and 5) and a weak positive correlation for 1 patient (patient 3). The Thorwarth model depicts positive correlations for 3 patients (patients 1, 2, and 5) and weak positive correlations for 2 patients (patients 3 and 4). Overall, the Cho model presents the strongest positive correlations among the models.
The reversible 2-compartment model shows a negative correlation between the 18F-FAZA accumulation and 15O-H2O perfusion in all patients (patients 1–3, negative; patients 4 and 5, weak negative). The irreversible 2-compartment model and Cho model also show a negative correlation in 4 patients (patients 1–3, negative; patient 5, weak negative). An example of the resulting parametric images of the models (patient 2) is depicted in Figure 5. The time–activity curves of a region of interest and 2 individual pixels on the selected slice are displayed, with the corresponding fitted model curves. The voxelwise correlations between estimated 18F-FAZA kinetic parameters of the reversible 2-compartment model and 15O-H2O perfusion in the tumor region for patient 2 are illustrated in Figure 6 (left side).
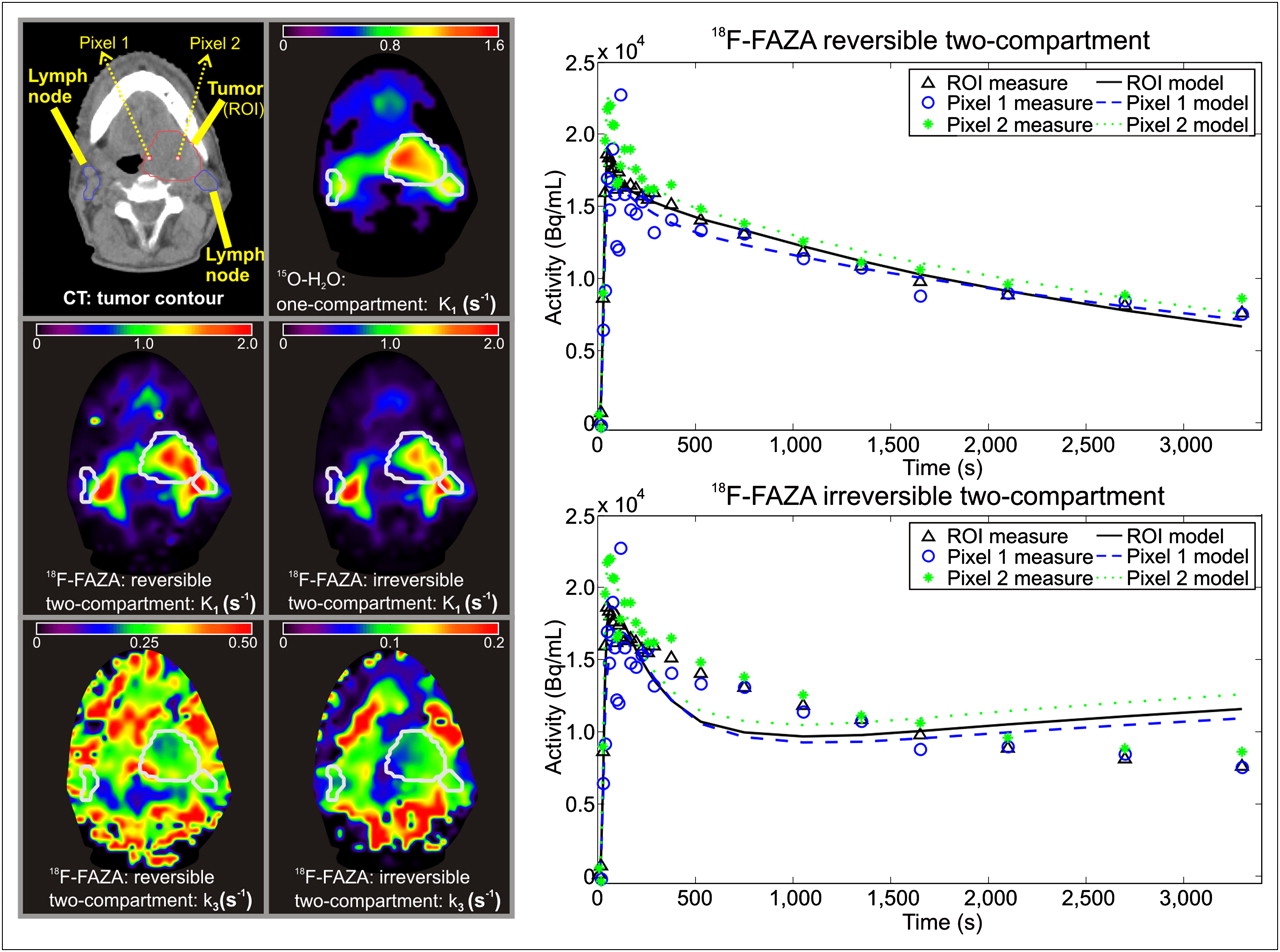
One slice of CT image and parametric images of reversible and irreversible 2-compartment models for patient 2. Parametric images are computed within region determined by CT. Time–activity curves of tumor region of interest and 2 pixels (arrows) are displayed on right, with corresponding model results. ROI = region of interest.

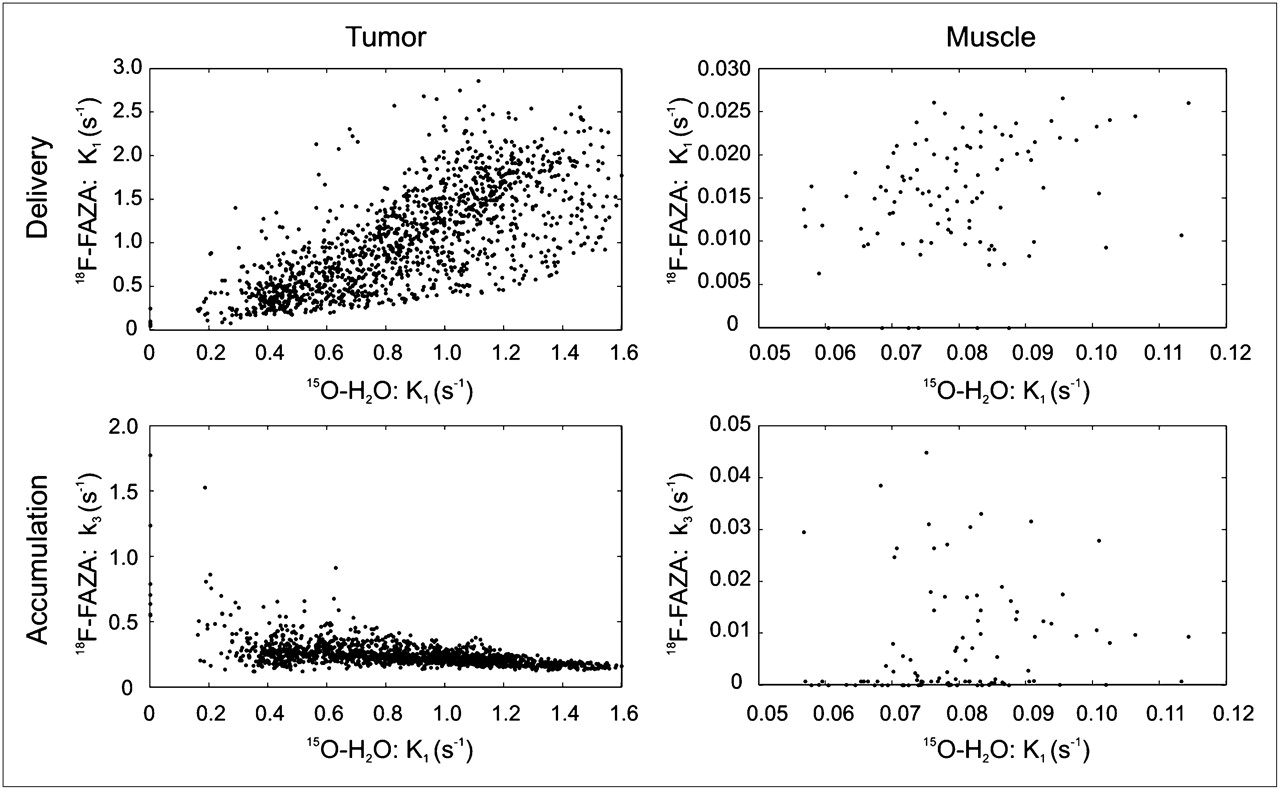
Scatterplots of voxelwise correlation between estimated parameters of reversible 2-compartment model for 18F-FAZA and K1 of 1-compartment model for 15O-H2O in tumor and muscle regions for patient 2.
Kinetic models show different correlations from those shown by the static analysis (Table 1) for all patients. On average, the static assessment reveals a positive correlation between 18F-FAZA accumulation and 15O-H2O perfusion, whereas the reversible and irreversible 2-compartment models and the Cho model show negative correlations between blood supply and tracer accumulation.
Different kinetic models reveal different results. Clear negative correlations between hypoxia tracer accumulation and perfusion for the reversible and the irreversible 2-compartment models and the Cho model were observed for patients 1–3. In contrast, the Thorwarth model, Patlak plot, and Logan plot revealed positive correlations for these patients.
Table 4 shows the modeling results for the correlation between the 18F-FAZA delivery and 15O-H2O perfusion, and Table 5 shows the correlation between the 18F-FAZA accumulation and 15O-H2O perfusion in the musculature of the neck region behind the cervical spine. A scatterplot of estimated delivery and accumulation parameters of 18F-FAZA by the reversible 2-compartment model and 15O-H2O perfusion in the muscle region for patient 2 is illustrated in Figure 6. Overall, the reversible 2-compartment model shows the smallest variance considering both relations.
Voxelwise Correlations Between 18F-FAZA Delivery and Corresponding 15O-H2O Perfusion in Region of Muscle for Each Patient
Voxelwise Correlations Between 18F-FAZA Accumulation and Corresponding 15O-H2O Perfusion in Region of Muscle for Each Patient
DISCUSSION
Using the cross-study of the kinetic modeling of the hypoxia tracer 18F-FAZA and the perfusion tracer 15O-H2O, we investigated the relationship between tracer delivery and perfusion and between tracer accumulation and perfusion.
Correlation Between 18F-FAZA Delivery, Accumulation, and Perfusion
After the tracer (either 18F-FAZA or 15O-H2O) was injected into the body, it was transported by the blood flow through the vascular system to capillaries and postcapillary venules and finally diffused into the interstitium and intracellular space, as shown in Figure 2. Because the tracer was delivered via blood flow, it was reasonable to postulate a positive correlation between drug delivery and perfusion. The results of the 4 models (the reversible and irreversible 2-compartment, Thorwarth, and Cho models) confirmed positive correlations in 4 of 5 patients (Table 2).
The oxygenation status of tumors depends on cellular oxygen consumption and oxygen supply to the respiring cells. The latter is mainly caused by convective transport through capillaries and by diffusion from microvessels to oxygen consumption sites (11,32,33). A functionally disturbed microcirculation and deteriorated diffusion conditions are the primary factors of tumor hypoxia. Our hypothesis of a negative correlation between hypoxia and perfusion is based on this fact. The results from the reversible and irreversible 2-compartment models and the Cho model support this hypothesis in 4 of 5 patients (Table 3). Although the Thorwarth model is based on the irreversible 2-compartment model, it recombines the fittable parameters of the irreversible 2-compartment model. Supposing an ideal fit by these 2 models yielding the same model curve, the parameter wA in the Thorwarth model equals the product of K1 and k3/(k2 + k3) in the irreversible 2-compartment model. Thus, the Thorwarth model is not able to uncover the negative correlation between 18F-FAZA and 15O-H2O perfusion. Similarly, the graphical models yield mixed kinetics and cannot discriminate the negative correlation and lead to opposite results.
For patient 4, no clear correlation was observed between 18F-FAZA delivery or accumulation and blood perfusion for the reversible and irreversible 2-compartment models and Cho model. The 18F-FAZA uptake is influenced by the existence of acute hypoxia (34). The intensity of 18F-FAZA in a PET voxel represents the mixed uptake of tumor microenvironment (34). The uptake varies on a microscopic scale, even within the same acquisition duration including morphologic and functional abnormalities of blood vessels (11), red blood cell fluxes (35), and dynamics of tumor hypoxia (36,37). Besides, although 18F-FAZA is an effective hypoxia tracer, it still has difficulty reaching all hypoxic areas distant from tumor microvessels (20).
Physiology Consistency of Normal Skeletal Muscle
In our study, we analyzed both the 15O-H2O and the 18F-FAZA dynamic uptake for normal musculature of the neck region (behind the cervical spine), which are skeletal muscles preferentially containing type I fibers (high capillary density, high oxidative capacity, and low glycolytic activity) (38). Muscle fibers and blood capillaries are usually uniformly structured (38). Our measurements were performed on resting muscles. Therefore, it is reasonable to assume that they have a consistent physiology and thus coherent tracer kinetics for 15O-H2O and 18F-FAZA. On the basis of this assumption, the observed variance in the correlations between 15O-H2O and 18F-FAZA modelings should be due to the poor physiologic robustness of the models. However, this variation may also be due to muscle activities, such as that caused by emotional stress (39).
Physiologic Precision and Mathematic Accuracy
The physiologic precision and numeric accuracy are 2 sides of kinetic modeling. An increase in model complexity can improve the ability of physiologic description and enhance the understanding of multifaceted mechanisms. However, this increase may decrease the accuracy of mathematic computation and lead to instability of quantitative assessment.
In our study, the reversible 2-compartment model has smaller physiologic variance for normal muscle; thus, it is more physiologically robust. However, the 2-compartment model had mathematic instability during the optimization procedure, which is not found for the graphical and Cho models.
Nonlinear optimization in voxelwise fitting (reversible and irreversible 2-compartment models, Thorwarth model) is sensitive to noise. Even using the gaussian convolution, it is still possible to see singularities in parametric images (Fig. 5). However, in the outlined tumor regions, the fitting result is relatively continuous. One additional initial setting of doubled magnitude was tested for patients 2 and 4, and the influence of the initial values on the correlations was observed. Slight changes below 5% in the resulting correlations were observed, except for patient 4, for whom the correlation between K1 of the irreversible 2-compartment model and 15O-H2O perfusion changed from −0.014 (in Table 2) to −0.004. Despite this, the characteristics of the correlations remained unchanged for all patients.
Although an immobilization mask was continuously used during the whole study, uncertainty (<2 mm) may still exist in spatial registration of the sequential 18F-FAZA and 15O-H2O PET images because of motion during the long acquisition (34). This may compromise the voxel-by-voxel correlation analysis. The influence of this registration uncertainty was tested by applying a half-voxel shift in the x direction to the registration between the 18F-FAZA and 15O-H2O images (Tables 2 and 3). The resulting voxelwise correlation was affected by the alignment of the images, especially for low correlations. However, the characteristics of the investigated correlations were not changed within the accuracy range of this study.
Furthermore, we have not evaluated the 1-compartment model for 15O-H2O perfusion (6), because our purpose was to compare only the hypoxia kinetic models.
Our results suggest that consideration of both the precise physiologic background and the mathematic accuracy is needed for a successful modeling of tumor hypoxia.
Our feasibility study is limited by the small number of patients because our imaging protocol is complex. Nevertheless, we proved the possibilities of physiologically assessing mathematic models with clinical relevance, achieved by a cross-study of correlated biologic characteristics, which can be tracked through molecular imaging techniques.
CONCLUSION
Although kinetic modeling has advantages over static assessment (21), the behavior varies greatly for different models of hypoxia evaluation. Different models even lead to opposite interpretations in some situations. According to our criteria for physiologic precision and robustness assessment, preference should be given to the reversible 2-compartment model.
Although only positive or negative relations were considered here, concrete quantitative knowledge of the correlations is important for the definition of more reliable evaluation criteria. The dilemma of physiologic precision and mathematic accuracy requires a thorough investigation of both tumor pathophysiology and mathematic models before the application of kinetic analysis. A large clinical study is desired for further model assessment. Theoretic simulation is another way to improve the understanding of kinetic modeling and the underlying physiology.
Acknowledgments
We thank Professors Michael Molls and Markus Schwaiger for their valuable discussion and support. The detailed discussions with Dr. Daniela Thorwarth on modeling approaches are highly appreciated. Furthermore, we thank Isabella Miederer for her input concerning data analysis. The excellent technical assistance of Gitti Dzewas in performing the PET studies is greatly acknowledged. We also thank Dr. Christine Bayer for the linguistic refinement. This work was supported in part by the DFG grant WE 2386/4-2, BMBF MobiTUM project (01EZ0826), and DFG Cluster of Excellence: Munich-Centre for Advanced Photonics. Part of this work was presented at the IEEE Nuclear Science Symposium and Medical Imaging Conference in Orlando, Florida, October 25–31, 2009.
- © 2010 by Society of Nuclear Medicine
REFERENCES
- Received for publication December 23, 2009.
- Accepted for publication June 3, 2010.


Jump to section
Related Articles
Cited By...
- Multiparametric Analysis of the Relationship Between Tumor Hypoxia and Perfusion with 18F-Fluoroazomycin Arabinoside and 15O-H2O PET
- 18F-Fluoromisonidazole Quantification of Hypoxia in Human Cancer Patients Using Image-Derived Blood Surrogate Tissue Reference Regions
- Parametric Methods for Quantification of 18F-FAZA Kinetics in Non-Small Cell Lung Cancer Patients