


Abstract
18F-fluoroazomycin arabinoside (18F-FAZA) is a PET tracer of tumor hypoxia. However, as hypoxia often is associated with decreased perfusion, the delivery of 18F-FAZA may be compromised, potentially disturbing the association between tissue hypoxia and 18F-FAZA uptake. The aim of this study was to gain insight into the relationship between tumor perfusion and 18F-FAZA uptake. Methods: Ten patients diagnosed with advanced non–small cell lung cancer underwent subsequent dynamic 15O-H2O and 18F-FAZA PET scans with arterial sampling. Parametric images of both 15O-H2O–derived perfusion (tumor blood flow [TBF]) and volume of distribution (VT) of 18F-FAZA were generated. Next, multiparametric classification was performed using lesional and global thresholds. Voxels were classified as low or high TBF and 18F-FAZA VT, respectively. Finally, by combining these initial classifications, voxels were allocated to 4 categories: lowTBF–lowVT, lowTBF–highVT, highTBF–lowVT, and highTBF–highVT. Results: A total of 13 malignant lesions were identified in the 10 patients. The TBF and 18F-FAZA VT values (average ± SD) across all lesions were 0.45 ± 0.20 mL·cm−3·min−1 and 0.94 ± 0.31 mL·cm−3, respectively. The averages of all lesional median values for TBF and 18F-FAZA VT were 0.37 ± 0.15 mL·cm−3·min−1 and 0.85 ± 0.18 mL·cm−3, respectively. Multiparametric analysis showed that classified voxels were clustered rather than randomly distributed. Several intralesion areas were identified where 18F-FAZA VT was inversely related to TBF. On the other hand, there were also distinct areas where TBF as well as 18F-FAZA VT were decreased or increased. Conclusion: The present data indicate that spatial variation of 18F-FAZA uptake is not necessarily inversely related to TBF. This suggests that decreased TBF may result in flow-limited delivery of 18F-FAZA. Areas with both high 18F-FAZA uptake and high TBF values suggest that high 18F-FAZA uptake, possibly suggesting hypoxia, may occur despite high TBF values. In conclusion, multiparametric evaluation of the spatial distributions of both TBF and 18F-FAZA uptake may be helpful for understanding the 18F-FAZA signal.
A characteristic feature of non–small cell lung cancer (NSCLC) is tumor hypoxia, defined as a metabolic state in which the concentration of oxygen is below physiological levels but above the complete lack of oxygen (1). Previous studies showed that 50%–60% of locally advanced solid tumors consist of hypoxic areas that are heterogeneously distributed within the tumors (2). Furthermore, hypoxia is associated with several unfavorable biological characteristics, including increased genetic instability, enhanced metastatic potential, and resistance to both radiation therapy and chemotherapy; these features make it an important determinant of both response to therapy and clinical outcome (3,4).
Methods that reliably measure the extent of hypoxia noninvasively and in vivo are needed to rationally apply hypoxia-specific treatments, such as intensified radiotherapy (1,5). Several PET tracers of hypoxia, including 18F-fluoroazomycin arabinoside (18F-FAZA), have been developed and evaluated. 18F-FAZA, a nitroimidazole derivative, undergoes electron reduction as it enters the cell (1). Under normoxic conditions, the tracer is reoxygenated and transported out of the cell (1). Under hypoxic conditions, however, the tracer is retained within the cell, increasing the PET signal in areas containing hypoxic cells (1). In comparison with other PET hypoxia tracers, 18F-FAZA is more sensitive for separating hypoxic tissue from nonhypoxic tissue due to its rapid renal clearance, which results in lower background activity levels (6,7).
PET is a valuable technique for the assessment of hypoxia. However, perfusion should also be considered since it plays an important role in the development of hypoxia (1,7,8). Three main mechanisms for the development of hypoxia in tumors in relation to perfusion have been described: severe structural or functional abnormalities of microvessels supplying a tumor (acute hypoxia), increased diffusion distances between blood vessels and tumor cells (chronic hypoxia), and reduced oxygen supply in the presence of disease- or treatment-related anemia (1,7,9). These mechanisms suggest an association between hypoxia and perfusion.
In an ideal situation, the uptake of a hypoxia tracer is not directly related to perfusion. A lack of perfusion, however, may compromise tracer delivery, thereby potentially disturbing the association between tissue hypoxia and 18F-FAZA uptake. Therefore, at least in theory, in low perfused areas containing strongly hypoxic tissue, impaired tracer delivery could lead to an underestimation of hypoxia as defined by a hypoxia tracer such as 18F-FAZA (1).
Most methods for analyzing the uptake of PET hypoxia tracers do not account for potential perfusion effects (3,6,10). In principle, low perfused areas should show higher uptake of 18F-FAZA, whereas high perfused areas may have a sufficient oxygen supply and show low uptake of 18F-FAZA. The aim of this PET study was to gain insight into the relationship between tumor hypoxia and perfusion in patients with NSCLC using 18F-FAZA and 15O-H2O PET.
MATERIALS AND METHODS
Patients
Patients diagnosed with advanced NSCLC were recruited at the VU University Medical Center when they met the following 2 inclusion criteria: a histologically or cytologically proven lesion greater than or equal to 2.5 cm in diameter and located within 15 cm of the aortic arch and a hemoglobin level of greater than or equal to 7.0 mmol·L−1. Exclusion criteria comprised chemotherapy or radiation therapy within 6 mo prior to the PET study, pregnancy, or inability to remain supine for 100 min. Prior to inclusion, all patients provided written informed consent in accordance with approval by the Medical Ethics Review Committee of the VU University Medical Center.
Data Acquisition
PET Imaging Protocol
The study was performed on a Gemini TF-64 PET/CT scanner (Philips Medical Systems). Prior to scanning, all patients received a venous cannula for tracer injection. First, as described in detail by Verwer et al. (10), a 10-min dynamic 15O-H2O scan of the thorax was performed after intravenous administration of 370 MBq of 15O-H2O. Second, a low-dose CT scan (35 mAs, 120 kVp) was performed for attenuation correction and anatomic localization. Third, a 70-min dynamic 18F-FAZA scan was performed after intravenous administration of 168 ± 39 MBq of 18F-FAZA with a specific activity of 143 ± 70 GBq·μmol−1. The radiotracer was administered in a volume of 5 mL of saline at 0.8 mL·s−1 followed by a flush of 35 mL of saline at 2 mL·s−1 using an automated pump system. The dynamic 18F-FAZA PET data were used to perform full quantitative kinetic evaluations; subsequently, the pharmacokinetic parameters were used in the multiparametric analysis.
PET data were normalized and corrected for dead time, randoms, scatter, attenuation, and decay. A 3-dimensional row-action maximum-likelihood reconstruction algorithm was used to reconstruct the data with a matrix size of 144 × 144 × 45 (voxel size, 4 × 4 × 4 mm). The 15O-H2O scan was reconstructed into 26 frames (1 × 10, 8 × 5, 4 × 10, 2 × 15, 3 × 20, 2 × 30, 6 × 60 s), and the 18F-FAZA scan was reconstructed into 37 frames (1 × 10, 8 × 5, 4 × 10, 2 × 15, 3 × 20, 2 × 30, 6 × 60, 4 × 150, 4 × 300, 3 × 600 s).
Blood Sampling
Besides the venous cannula for tracer injection, all patients received a radial artery cannula for arterial manual sampling. During the 15O-H2O study, 3 manual samples were collected at 5, 7.5, and 10 min after injection, and whole-blood activity concentrations were determined with a cross-calibrated well counter. These samples were used for calibration of the image-derived input functions (IDIFs). During the 18F-FAZA study, 7 manual arterial blood samples were collected at set time points (5, 10, 20, 30, 50, 60, and 70 min after injection). These samples were analyzed for plasma–to–whole-blood ratios and for plasma fractions of parent 18F-FAZA. These data were used in combination with an image-derived (whole-blood) input function to derive a metabolite-corrected plasma input function, as detailed later.
Kinetic Analysis
Kinetic analysis was performed with in-house–developed software, which was coded using MATLAB version 7.04 (The MathWorks, Inc.). For each patient, a volume of interest (VOI) of the whole tumor was manually defined on the low-dose CT scan. We used an anatomically based VOI rather than a PET-based one to ensure that tumor areas with both high and low levels of uptake were included in the multiparametric analysis. The CT-based VOI was projected onto the PET data, and correct localization of the VOI was verified with late 18F-FAZA uptake data. Moreover, large blood vessels, as visualized by projection of the VOI onto early-uptake images (frames 4–6) of the dynamic 18F-FAZA PET data, were manually excluded from the VOI.
For generating IDIFs, circular VOIs with a diameter of 1 cm were positioned in 5 consecutive axial planes within the lumen of the ascending aorta using the frame in which the first pass of the bolus was best visualized, typically 10–15 s after injection. These VOIs were then projected onto all image frames to generate a whole-blood IDIF. The 18F-FAZA IDIF was calibrated to the whole-blood activity concentrations of the manual samples collected 50 min after injection and was corrected for both plasma–to–whole-blood ratios and parent fractions obtained from all manually collected arterial blood samples (detailed description in Verwer et al. (10)).
Tumor VOIs were projected onto both parametric TBF and 18F-FAZA VT images as described earlier to obtain regionally averaged as well as voxel-by-voxel TBF and VT data.
Association Between TBF and 18F-FAZA VT
The intratumor association between TBF and 18F-FAZA VT was assessed on a voxel-by-voxel basis by generating scatterplots of parametric TBF values against 18F-FAZA VT values.
Multiparametric Classification
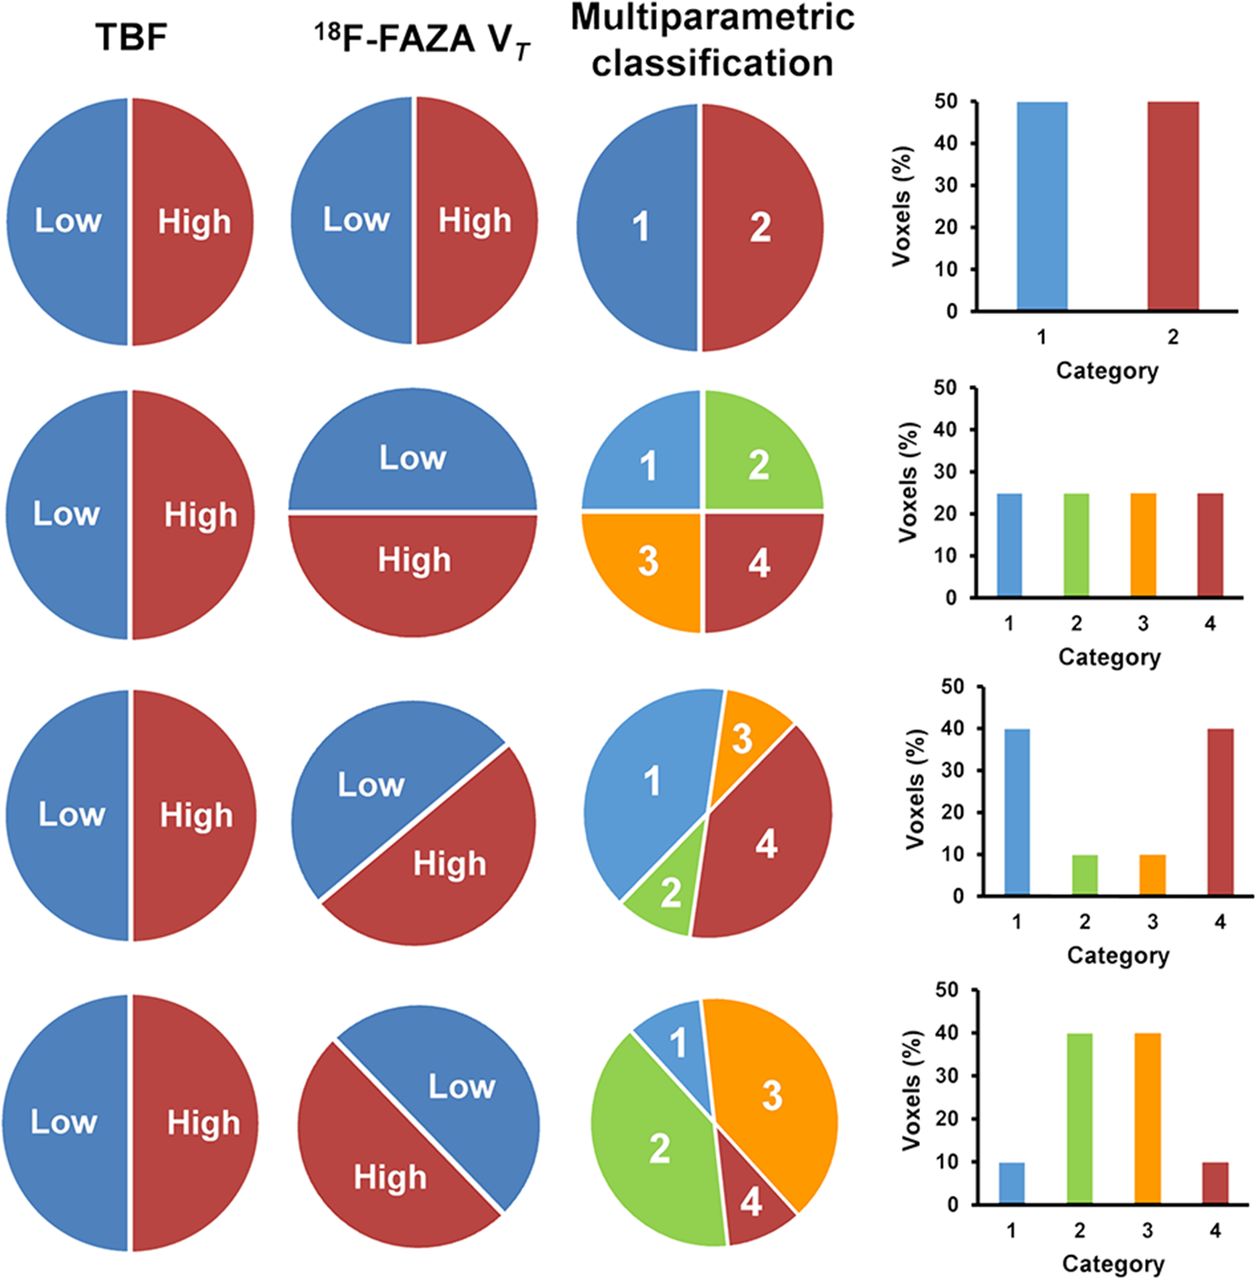
For all patients, multiparametric classification was applied to TBF and 18F-FAZA VT data, using both lesional and global thresholds (Supplemental Fig. 1) (supplemental materials are available at http://jnm.snmjournals.org). The lesional threshold was derived from the median parametric TBF or 18F-FAZA VT value per lesion (VOI), which was the median of all voxel values within the VOI. The global threshold was determined as the average of all lesional median values. First, voxels were classified as low or high TBF and low or high VT using both types of thresholds. Voxels with values below the threshold were classified as low TBF or low VT, whereas voxels with values above the threshold were classified as showing high TBF or high VT (Supplemental Fig. 2). This process resulted in the distribution of voxels into 2 categories for both TBF and VT independently, as shown schematically in Figure 1.

Overview of possible patterns of distribution of voxels. Presented distributions are hypothetical. Voxels were classified in 2 categories, low and high, for both TBF and 18F-FAZA VT. A combination of these initial classifications results in multiparametric classification: lowTBF–lowVT (category 1), lowTBF–highVT (category 2), highTBF–lowVT (category 3), and highTBF–highVT (category 4). The bar charts represent the percentages of voxels in each category of the multiparametric classification.
Next, these initial classifications were combined, so that voxels were classified in 4 categories: lowTBF–lowVT, lowTBF–highVT, highTBF–lowVT, and highTBF–highVT. Depending on the number of voxels in each category, several different patterns of distribution of voxels could be obtained, as shown in Figure 1.
Clustering Index
In addition to visual analysis of the level of clustering of voxels into 4 categories, a quantitative metric (clustering index [CI]) was used to describe the degree of voxel clustering (15). The CI was obtained by measuring the local entropy of the classified voxels (Fig. 2); this process is further explained in the supplemental data.
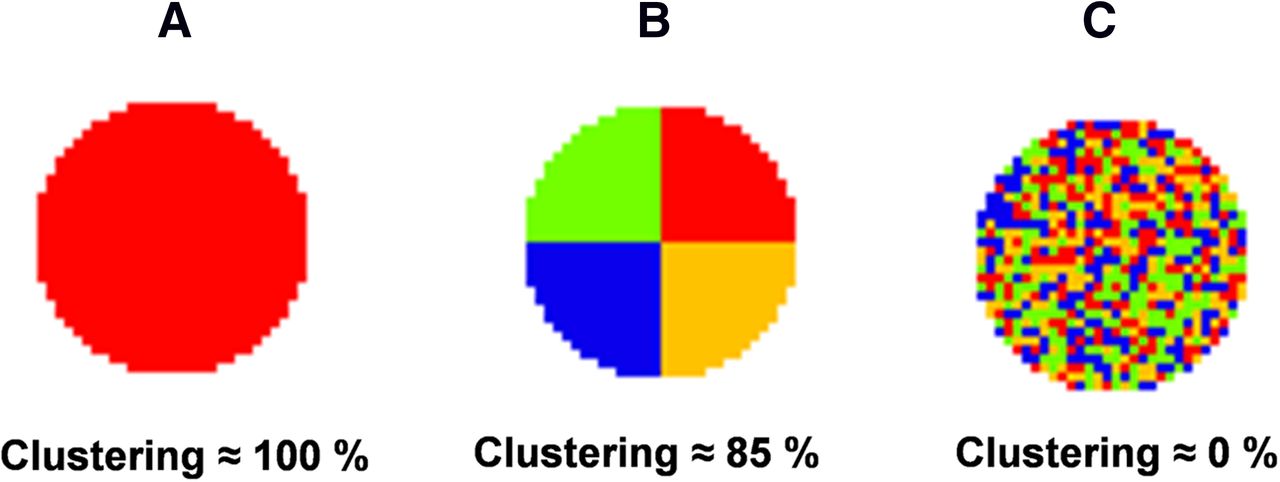
Various conditions of voxel clustering and their corresponding clustering (percentage). (A) Condition representing maximal clustering, with clustering of approximately 100%. (B) Condition representing optimal clustering with voxels classified in 4 different categories, with clustering of approximately 85%. (C) Condition representing minimal clustering and random distribution of voxels, with clustering of approximately 0%.
Tumor Volumes, Hypoxic-Volume Fractions, and Highly Perfused Fractions
For all lesions, tumor volumes were determined with the CT-derived whole-tumor VOI. Hypoxic-volume fractions and highly perfused fractions were determined as the fractions of voxels above the global thresholds for TBF and 18F-FAZA VT, respectively. These tumor characteristics, together with the CI, were correlated with each other to assess the potential relationships between any of the characteristics.
RESULTS
Study Group
The study group consisted of 2 men and 8 women with NSCLC (age [average ± SD], 56 ± 11 y). A total of 13 malignant lesions, including 6 adenocarcinomas, 5 large-cell carcinomas, and 2 squamous cell carcinomas, were identified in the 10 patients. The TBF and 18F-FAZA VT values (average ± SD) were 0.45 ± 0.20 mL·cm−3·min−1 and 0.94 ± 0.31 mL·cm−3, respectively. The global thresholds for TBF and 18F-FAZA VT were 0.37 ± 0.15 mL·cm−3·min−1 and 0.85 ± 0.18 mL·cm−3, respectively.
Association Between TBF and 18F-FAZA VT
Figure 3 shows the association between TBF and 18F-FAZA VT, assessed on a voxel-by-voxel basis for 2 patients. The fitted line represents a logarithmic function. Figure 3A shows data from patient A, in whom an increase in 18F-FAZA VT with increasing TBF was observed. Figure 3B shows data from patient B, in whom the opposite pattern was seen.
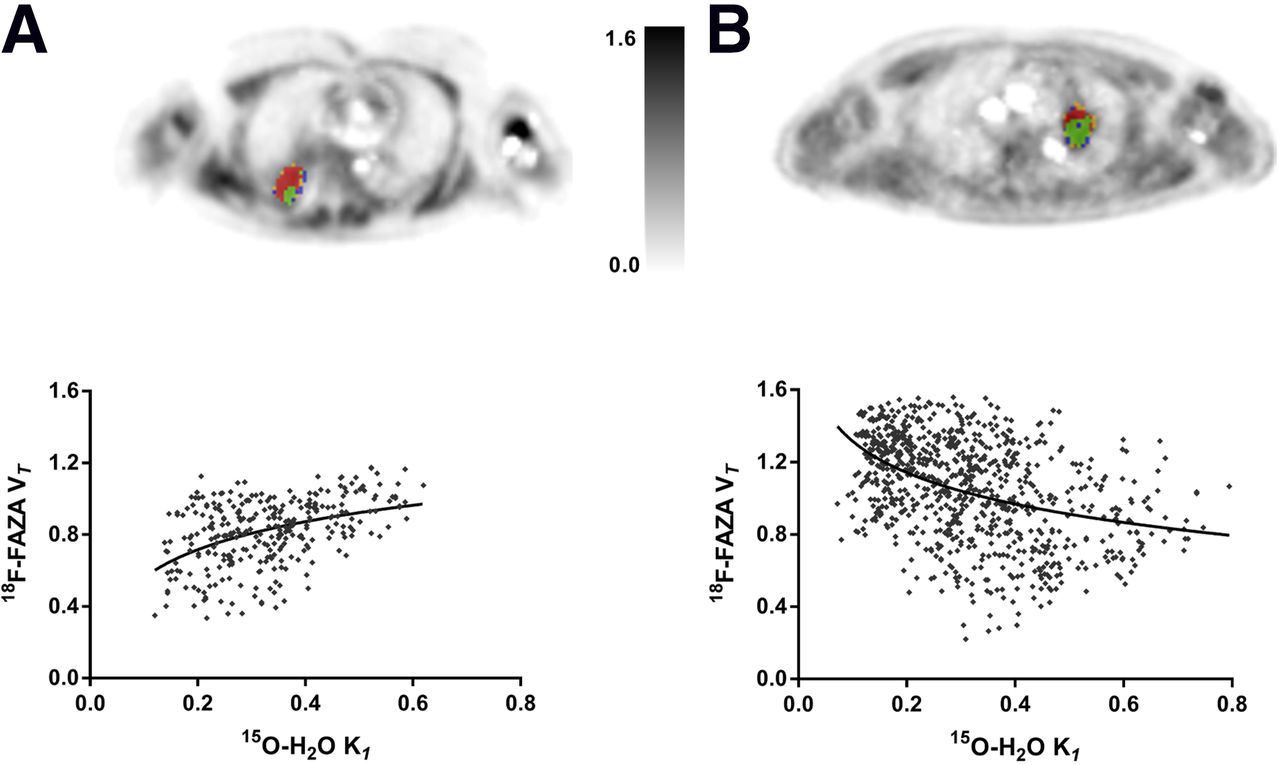
Voxelwise association between TBF and 18F-FAZA VT for whole-tumor VOI in patients A and B, showing positive and negative associations, respectively. 18F-FAZA VT images represent tumor lesions multiparametrically classified using the lesional threshold. Voxels are color coded with same classification colors as in Figure 1. (A) Most voxels of the VOI are shown in red, representing positive association. (B) Most voxels of the VOI are shown in green, representing negative association. Trend line in each scatterplot is provided only to illustrate general trend (positive or negative association). K1 = association constant.
Multiparametric Evaluation
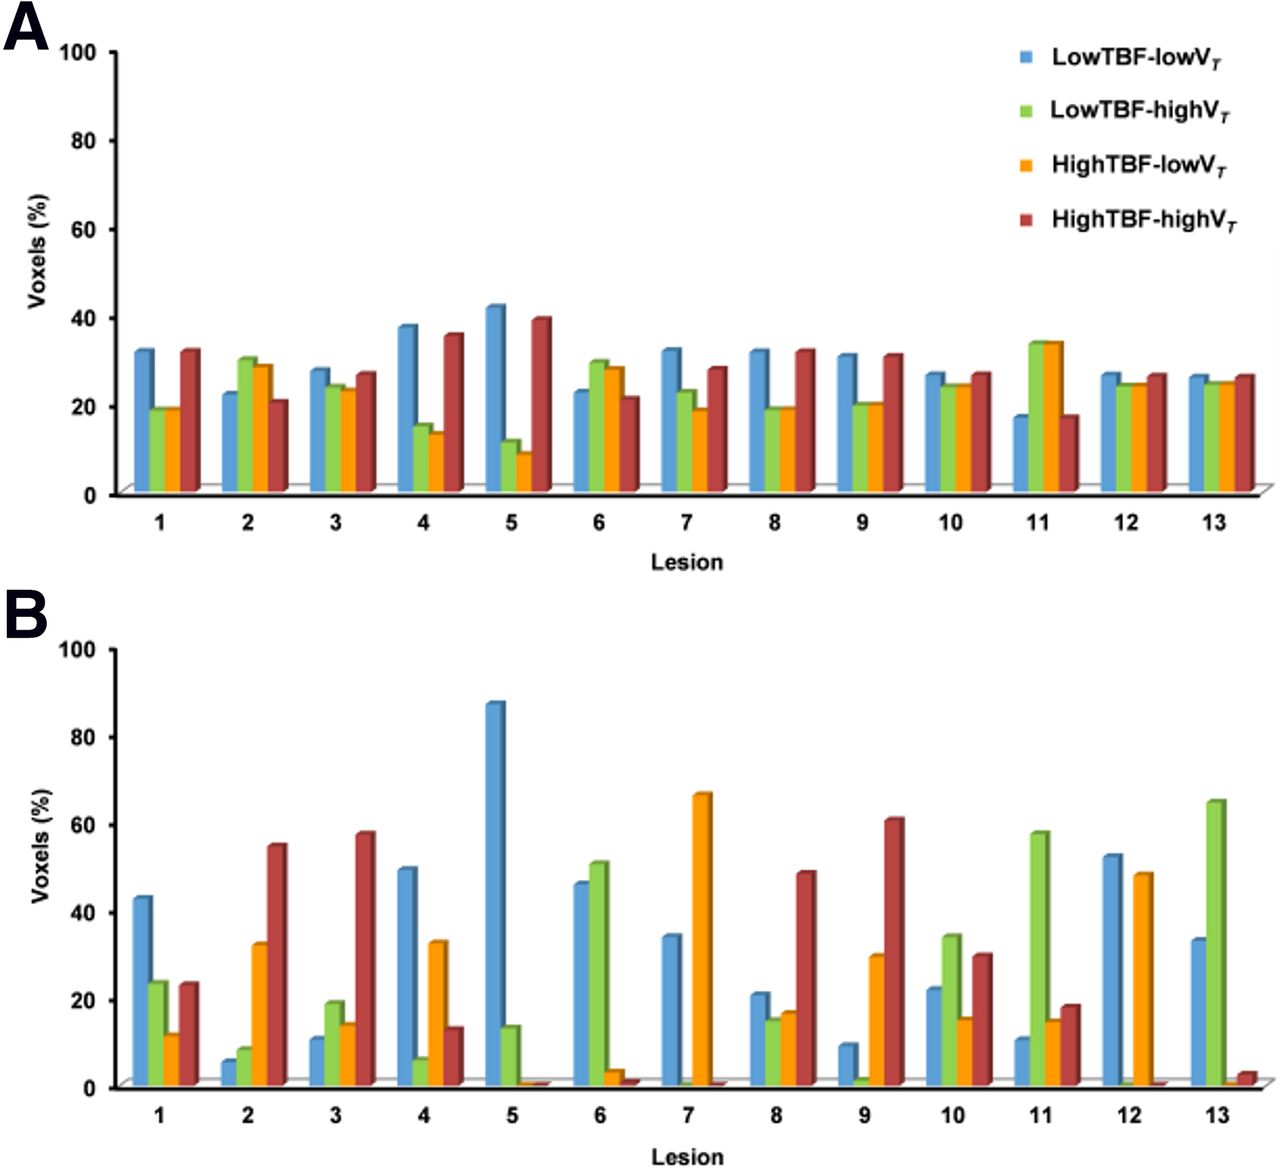
The multiparametric classification resulted in voxels classified into 4 categories. Figure 4 shows the distribution of voxels in each category for each lesion, classified using lesional (Fig. 4A) and global (Fig. 4B) thresholds. Supplemental Table 1 shows the values for these thresholds. Voxels classified in the lowTBF–lowVT or highTBF–highVT category represented predominantly a positive association, whereas voxels classified in the lowTBF–highVT or highTBF–lowVT category represented predominantly a negative (inverse) association. Lesions with approximately the same amount of voxels in each category represented an intermediate association.

Multiparametric classification of all 13 malignant lesions, showing percentage of voxels in each category of the classification. Voxels were classified in 4 categories using lesional (A) and global (B) thresholds.
Visual analysis suggested that the classified voxels were clustered, rather than randomly distributed, across a tumor VOI (Supplemental Figs. 3D–3F). This finding was supported by the CI (Supplemental Table 2), indicating that the degree of clustering was significantly different from 0% (P < 0.001). In fact, intralesional areas in which 18F-FAZA VT was inversely related to TBF were identified. Voxels classified in the lowTBF–highVT category were located mainly in the center of the tumor, whereas voxels classified in the highTBF–lowVT category were identified near the tumor edges. On the other hand, distinct areas in which both TBF and 18F-FAZA VT were either decreased or increased were also identified. Voxels classified in the lowTBF–lowVT category were located primarily in cranial and caudal parts of the tumor, whereas voxels classified in the highTBF–highVT category often were located near the center of the tumor. Although the classified voxels were clustered, both their distributions over the 4 categories and their spatial distributions varied substantially between lesions.
The correlations of the various parameters shown in Supplemental Table 2 were also determined. For lesions with a volume range of 10–50 mL, an increase in hypoxic-volume fractions was seen with increasing lesion size (Pearson correlation coefficient [r], 0.65; P < 0.001). Lesions with volumes exceeding this range seemed to have more or less similar hypoxic-volume fractions, with an average of 68% (range, 62%–76%). Furthermore, the CI (percentage), when based on the lesional threshold, showed limited variability for a large range of tumor volumes.
DISCUSSION
Association Between TBF and 18F-FAZA VT
We hypothesized a negative association between TBF and 18F-FAZA uptake; that is, low perfused areas show higher uptake of 18F-FAZA. In these areas, a limited oxygen supply might result in hypoxia and therefore high levels of uptake of 18F-FAZA. Alternatively, it can be hypothesized that high perfused areas would have sufficient oxygen supply—and therefore no hypoxia—and would show low levels of uptake of 18F-FAZA. Figure 3B may represent an example of this negative relationship between TBF and 18F-FAZA VT as it shows that a decrease in TBF was associated with an increase in 18F-FAZA VT and vice versa. A negative association between TBF and PET hypoxia tracer uptake was proposed earlier by Thorwarth et al., who used 18F-fluoromisonidazole (18F-FMISO) in patients with head and neck cancer (16). To assess hypoxia kinetic models, Shi et al. performed a feasibility study with voxelwise cross-analysis of the uptake of 15O-H2O and 18F-FAZA, and they also found inverse correlations between tracer accumulation and TBF (17).
However, TBF and 18F-FAZA VT were not consistently inversely associated: in several tumors, distinct areas in which TBF and 18F-FAZA VT were either both decreased or both increased were found (Fig. 3A). The first scenario may have resulted from flow-limited delivery of 18F-FAZA as a decrease in TBF limits tracer delivery, as described earlier by Verwer et al. (1). This situation was also recognized in studies with 18F-fluoroerythronitroimidazole (18,19). High uptake of 18F-FAZA in areas with high TBF suggests that oxygen supply in these areas may be sufficient and therefore that the perceived hypoxia—observed as high levels of uptake of 18F-FAZA—may be caused by something else (e.g., abnormal microvasculature). This scenario may suggest that the development of hypoxia does not depend only on macroscopic TBF and that other tumor cell characteristics, such as high cellular oxygen consumption demand or limited diffusion of oxygen, may play an important role in the development and presence of hypoxia (2,20,21). The positive correlation was identified earlier by Bruehlmeier et al., who performed pixelwise comparisons of 18F-FMISO and 15O-H2O PET images (22). In addition, they did not observe inverse correlations between 18F-FMISO uptake and TBF.
On the basis of the aforementioned studies, there seems to be conflicting proof of both positive and negative associations between TBF and hypoxia tracer uptake both between and within tumors. In fact, our study showed that this may actually occur within a tumor and that tumors of the same type may show positive or negative associations between TBF and hypoxia tracer uptake across subjects. Our findings and those reported by others suggest that the relationship among TBF, hypoxia, and radiotracer uptake is complicated and that hypoxia imaging alone may not be sufficient to properly understand or interpret the PET hypoxia tracer signal. In fact, the absence of or low hypoxia tracer uptake because of flow limitations should be ruled out by performing complementary TBF imaging.
Multiparametric Evaluation
Multiparametric analysis classified a tumor in several categories depending on its TBF and 18F-FAZA uptake. Voxels classified in the lowTBF–lowVT category were located mainly in cranial and caudal parts of the tumor. To some extent, this finding may have been the result of movement of the tumor because of respiration, causing lower spatial resolution or blurring of the PET signal. However, tumors located in the upper lobe of the lung, which are less subject to respiratory motion, also had voxels classified in the lowTBF–lowVT category, but these alternated with voxels classified in the highTBF–lowVT category. The multiparametric analysis could also have been affected by motion-induced misalignment of the CT-based VOI and the PET data. Therefore, the VOIs were first verified for correct alignment with the PET data. In the studied cases, no correction for misalignment was needed. However, if the proposed multiparametric analysis were to be applied to lesions located closer to the diaphragm, motion compensation techniques or respiratory gating would be warranted to guarantee accurate localization of the CT-based VOI. Furthermore, areas with lowTBF–highVT and highTBF–highVT were located mainly in the center of the tumor. These areas are not affected by motion, but both positive and negative associations between TBF and 18F-FAZA VT uptake were still observed in these areas.
It has been assumed that vascularization of the tumor center often is limited and therefore that this area is most likely to be hypoxic (18,23). This assumption is supported by the high incidence of voxels classified in the lowTBF–highVT category in the center of the tumor. On the other hand, voxels classified in the highTBF–highVT category are also often located in the center. Picchio et al. identified a similar pattern, with high 18F-FAZA uptake and high 125I-gluco-RDG (which binds to cells that are undergoing angiogenesis) uptake in the center of the tumor, indicating that both hypoxia and angiogenesis were present predominantly in the core of the tumor (24).
Multiparametric classification based on the lesional threshold showed that most voxels were classified in the lowTBF–lowVT and highTBF–highVT categories. Because 18F-FAZA is a hypoxia tracer, high uptake of the tracer is expected in low perfused areas, and low uptake is expected in high perfused areas (1,25,26). However, this expectation was not met, raising questions about the reliability of assessing tumor hypoxia with PET. Multiparametric classification based on the global threshold produced a more dispersed outcome than that based on the lesional threshold. Several lesions were identified in areas where most of the voxels were classified in the lowTBF–lowVT, lowTBF–highVT, and highTBF–highVT categories. This finding indicates that the patterns of 18F-FAZA uptake varied. However, regardless of whether the lesional or global threshold was used, we arrived at the same conclusion—namely, that both positive and negative associations between perfusion and 18F-FAZA uptake can occur. When the lesional threshold was used, we could identify regions within a tumor having positive or negative associations between perfusion and 18F-FAZA uptake. The use of the global threshold allowed us to identify lesions in which global (average) perfusion and 18F-FAZA uptake were positively or negatively associated and therefore to evaluate lesions with average high or low levels of perfusion and high or low levels of 18F-FAZA uptake (and vice versa).
Studies evaluating tumor hypoxia with PET and 18F-FMISO, 18F-flortanidazole, and 18F-FAZA have shown that this technique is valuable for the detection of hypoxic volumes (1,27–29). Our findings coincide with these conclusions because the present study also revealed that areas showing high uptake of 18F-FAZA may be hypoxic. However, when TBF is considered and related to 18F-FAZA uptake, positive and negative associations between both parameters can be seen. Other studies have revealed negative associations, but less is known about positive associations; knowledge about the latter is essential for better understanding and interpretation of the 18F-FAZA PET signal.
Clinical and Scientific Implications
Hypoxia imaging with PET is a noninvasive and attractive technique, but it does not measure hypoxia directly. Autoradiography, which is the reference method for the absolute assessment of tumor hypoxia, may be an alternative. Therefore, incorporation of the knowledge obtained from parametric images of 15O-H2O and 18F-FAZA with autoradiography is recommended (1,30). This technique has disadvantages as it is invasive and restricted to accessible sites, but it may provide more insight into the reliability of the use of parametric PET images for the assessment of tumor hypoxia (30).
To our knowledge, the classification method used in the present study has not been practiced before. Therefore, this classification method must be evaluated further through combination with clinical data, such as determination of the presence of hypoxic or necrotic areas in resection specimens. It would be interesting to observe whether data from resection specimens coincide with those from the classification method—a result that would contribute to the reliability of this method. During the present study, it was not possible to relate clinical data to the applied method as most of the included patients had not undergone biopsies or information about the presence of hypoxic or necrotic areas was lacking.
CONCLUSION
The present study suggests that a low 18F-FAZA PET signal may indicate either the absence of hypoxia or flow-limited delivery of 18F-FAZA. Low 18F-FAZA uptake does not guarantee normoxic conditions, and TBF data are required to rule out flow-limited delivery. A high 18F-FAZA PET signal can be attributed to the presence of hypoxia because of limited oxygen supply, decreased diffusion capacity, or increased oxygen consumption. We hypothesize that hypoxia most likely is present in areas with high levels of 18F-FAZA uptake in combination with sufficient TBF since, in those areas, tracer delivery will not be impaired as a result of limited TBF. Our findings imply that for a better understanding of the 18F-FAZA PET signal, the assessment of TBF is required.
DISCLOSURE
The costs of publication of this article were defrayed in part by the payment of page charges. Therefore, and solely to indicate this fact, this article is hereby marked “advertisement” in accordance with 18 USC section 1734. This study was financially supported by the Center for Translational Molecular Medicine (AIRFORCE project grant 03O-103). No other potential conflict of interest relevant to this article was reported.
Acknowledgments
We thank the members of the Department of Radiology and Nuclear Medicine for data acquisition, Maqsood Yaqub and Sandeep Golla for technical assistance, and Jasper van der Aart for detailed discussions.
Footnotes
Published online Dec. 10, 2015.
- © 2016 by the Society of Nuclear Medicine and Molecular Imaging, Inc.
REFERENCES
- Received for publication September 5, 2015.
- Accepted for publication November 18, 2015.


Jump to section
Related Articles
Cited By...
- No citing articles found.