


Abstract
18F-fluoromisonidazole (18F-FMISO) is the most widely used PET agent for imaging hypoxia, a condition associated with resistance to tumor therapy. 18F-FMISO equilibrates in normoxic tissues but is retained under hypoxic conditions because of reduction and binding to macromolecules. A simple tissue-to-blood (TB) ratio is suitable for quantifying hypoxia. A TB ratio threshold of 1.2 or greater is useful in discriminating the hypoxic volume (HV) of tissue; TBmax is the maximum intensity of the hypoxic region and does not invoke a threshold. Because elimination of blood sampling would simplify clinical use, we tested the validity of using imaging regions as a surrogate for blood sampling. Methods: Patients underwent 20-min 18F-FMISO scanning during the 90- to 140-min interval after injection with venous blood sampling. Two hundred twenty-three 18F-FMISO patient studies had detectable surrogate blood regions in the field of view. Quantitative parameters of hypoxia (TBmax, HV) derived from blood samples were compared with values using surrogate blood regions derived from the heart, aorta, or cerebellum. In a subset of brain cancer patients, parameters from blood samples and from the cerebellum were compared for their ability to independently predict outcome. Results: Vascular regions of heart showed the highest correlation to measured blood activity (R2 = 0.84). For brain studies, cerebellar activity was similarly correlated to blood samples. In brain cancer patients, Kaplan–Meier analysis showed that image-derived reference regions had predictive power nearly identical to parameters derived from blood, thus obviating the need for venous sampling in these patients. Conclusion: Simple static analysis of 18F-FMISO PET captures both the intensity (TBmax) and the spatial extent (HV) of tumor hypoxia. An image-derived region to assess blood activity can be used as a surrogate for blood sampling in quantification of hypoxia.
Hypoxia imaging strategies were developed to identify an important factor that limits response to cancer treatment, because of decreased blood flow and drug delivery, decreased proliferation with fewer cycling cells, and the genomic component of HIF (hypoxia-inducing factor) signaling (1). Tumors have chronically hypoxic areas due to a mismatch between vascular supply and cellular growth. Although ionizing radiation is a strategy for killing cancer cells that does not rely on vascular delivery, the cytotoxicity of ionizing radiation depends on the O2 level. Radiation oncologists have devised numerous strategies to overcome the therapy-limiting consequences of hypoxia but with little success (2,3). Hypoxia imaging has 2 clinically important roles: selecting a cohort of patients who might respond better to treatments designed to overcome the limitations of hypoxia and identifying the location of hypoxia in support of intensifying therapy, for example, escalating radiation dose (4–6).
Calibrated O2-sensitive electrodes can directly measure oxygen partial pressure (PO2, mm Hg), but the signal becomes small in hypoxia. Furthermore, electrodes are invasive, require image-guidance, and cannot access many tumors (7). Hypoxia is a phenomenologic concept with no specific concentration of tissue PO2 that results in a transition from normoxia to hypoxia. The consequences of hypoxia occur when O2 levels are too low to satisfy metabolic demand. Therefore, the best way to measure hypoxia would be with a biomarker that competes directly with intracellular O2, where the agent was not trapped with sufficient O2 but retained when O2 supply was inadequate to accommodate mitochondrial respiration. The mechanism of 18F-fluoromisonidazole (18F-FMISO) distribution and retention meets these characteristics (1). However, any attempt to infer PO2 from hypoxia images is misguided.
18F-FMISO is the most widely used radiotracer for assessing tissue hypoxia with PET. Its initial tissue distribution after injection is correlated to blood flow (8) because it is freely diffusible. At a PO2 less than 3 mm Hg, nitroimidazoles such as 18F-FMISO are reduced to a product that is retained in viable hypoxic cells for the duration of the imaging study (9). Normoxic tissues equilibrate with blood after an hour (9,10). However, longer uptake times are advantageous to minimize unreduced tracer by excretion and improve image contrast. Retention of reduced 18F-FMISO by covalent binding in tissues correlates with the severity of hypoxia (11,12).
Several methods have been proposed for analyzing 18F-FMISO PET data to quantify oxygenation in human patients (13–15). Our group initially developed a kinetic model with dynamic imaging and arterial sampling, an approach validated using cancer cell spheroids in culture or in animals (16). This approach proved excessively complicated in practice and did not provide useful information because 18F-FMISO has a nearly uniform distribution in almost every tissue after 1 h (17). Our first reports quantifying 18F-FMISO hypoxia in animal and human studies examined tissue-to-muscle and tissue-to-blood (TB) ratios to normalize uptake to a reference activity (10,18). The tissue-to-muscle values produced a variable normalization factor compromised by hypoxic muscle that was compressed during the imaging period. The use of a simple TB ratio adequately and consistently quantified tissue hypoxia. An empiric hypoxic TB threshold ratio of 1.2 or greater, developed over decades of examining thousands of normal and tumor tissues, is useful in discriminating the hypoxic volume (HV) of tissue regions (19).
The maximum TB value in the tumor region, TBmax, reflects the intensity of uptake, whereas the volume of pixels in a tumor that exceeds the hypoxic threshold is the HV and reflects the extent of hypoxia. Both of these parameters (TBmax and HV) have been shown to be independent predictors of patient outcome in brain cancer (20), head and neck cancer (H&N) (21), and sarcoma (22). However, elimination of blood sampling and analysis requiring a cross-calibrated well counter would be advantageous. The use of standardized uptake value, which is common in 18F-FDG PET, would not be appropriate because it fails to account for differences in clearance of background activity. The effect on quantification of TB using reference tissue regions from 18F-FMISO images as surrogates for blood sampling was evaluated. Hypoxic parameters determined from image-derived (ID) blood surrogate regions were also examined for their ability to predict survival and time-to-progression (TTP) in a brain cancer cohort (20).
MATERIALS AND METHODS
Patient Characteristics
Two hundred twenty-three 18F-FMISO imaging studies on 187 cancer patients (64 glioma, 79 H&N, 14 breast, 17 sarcoma, 10 lung, 2 lymphoma, and 1 melanoma) who had 269 detectable blood surrogate regions in the imaging field of view (FOV) were recruited from the Veterans’ Administration Puget Sound Health Care System, University of Washington Medical Center, and Harborview Medical Center (Table 1). Signed informed consent forms, as approved by the respective Investigational Review Boards and Radiation Safety Committees, were obtained for all patients before imaging. Early studies were done under the Radioactive Drug Research Committee, but most were performed under investigational new drug approval. Many of these patients (73 H&N, 27 glioblastoma, 11 sarcoma, and 7 breast) were included in previous reports examining survival prediction or the relationship of 18F-FDG to 18F-FMISO imaging (20–22). A more complete description of the patients appears in the supplemental materials (available at http://jnm.snmjournals.org).
18F-FMISO Patient Region Summary
Radiosynthesis
18F-FMISO was initially prepared using the glycidyl tosylate method (23), then changed to the method developed by Lim and Berridge (24) and modified by Adamsen et al. (25). In all cases, the same purification by high-performance liquid chromatography was used. The product specific activity ranged from 37 to 74 GBq/μmol at the time of injection, with greater than 98% radiochemical purity. 18F-FMISO was administered by venous injection of a 10-mL solution of isotonic saline containing less than 10% (v/v) ethanol USP. The average injected dose for all studies was 267 MBq (range, 370–148 MBq).
PET Imaging
Most of the PET scans (n = 195) used in this analysis were performed on an Advance tomograph (GE Healthcare) operating in either 3-dimensional high-sensitivity mode at a 30-cm FOV for brain studies or 2-dimensional high-resolution mode at a 55-cm FOV for nonbrain studies. Twenty-eight studies were performed on a Discovery scanner (GE Healthcare) in 3-dimensional mode at either a 30-cm FOV for brain studies (n = 21) or a 55-cm FOV for body studies (n = 7). Emission images from both scanners were reconstructed and decay-corrected using previously described methods (26). Tomograph sensitivity was calibrated every 3 mo using a 20-cm cylindric phantom containing a known amount of 18F (Bq/mL) and processed using the same protocol as the patient studies. The well counter for determining blood activity (Cobra; Packard Instruments Inc.) was cross-calibrated at the time of scanner calibration using aliquots from the calibration phantom.
After patient immobilization, venous lines were established in each arm, one for injection and the other for blood sampling, followed by a 25-min transmission scan for the Advance or a 6-s low-dose CT scan (120 KVP, 60A) for the Discovery. A 20-min single-FOV emission scan of the tumor region was acquired during the interval of 90–140 min after injection. In 7 studies in which an adequate blood pool was not in the FOV, additional emission and transmission scans over the heart immediately preceded or followed tumor imaging. Blood samples were acquired during both scans. Typical 18F-FMISO patient images of tumor uptake appear in the supplemental materials.
Blood Sampling
During emission tomography, 3 or more venous blood samples were obtained, and the activity of 1-mL aliquots was assayed in a calibrated well counter as described above. Averaged blood activity was decay-corrected to the injection time and converted to the same units as the scanner (Bq/mL).
Image Analysis
For brain studies, MR images acquired within 2 wk of the PET scan were registered with the 18F-FMISO images to aid in delineating a tissue volume of interest (VOI). Conventional anatomic images (CT, MR) and PET emission scans were used with side-by-side visualization to guide VOI construction for body images. Tumor VOIs encompassing the entire tumor volume were constructed using either Alice (Parexcel) or PMOD (version 3.4; PMOD Technologies), after which they were applied to the 18F-FMISO images. Tumor VOIs were 4–750 mL and did not require partial-volume correction. The 18F-FMISO image data were normalized by the average blood activity to produce pixel-level TB values. HV was determined as the volume of pixels in the tumor VOI with a TB ratio of 1.2 or greater, indicating significant hypoxia (21). For each tumor, the pixel with the maximum TB value (TBmax) and HV were determined.
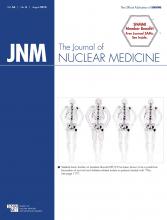
Quantification of 18F-FMISO in ID tissue regions used as surrogates for blood activity were performed as follows: for heart, 3-cm circular regions were placed on approximately 2 cm of axial distance over the left ventricular cavity; for aorta, 1-cm circular regions were placed on approximately 3 cm of axial distance; and for cerebellum, two 2-cm-diameter regions were placed on the left and right cerebellar cortex over approximately 1 cm of axial distance (Fig. 1). Although brain regions are generally normoxic, the cerebellum was selected because brain tumors in adults are typically supratentorial and may undergo severe morphologic deformation during disease progression (27), preventing the selection of consistent areas of normoxic brain without infiltrative glioma cells. Additionally, H&N cancer patients often have cerebellum in the FOV, so this region is adequate for both cancers. Several imaging studies had multiple surrogate blood regions, such as cardiac and aortic regions in lung and breast cancer studies. The total number of regions assessed was 269 (170 cerebellum, 46 heart, 53 aorta) from 223 studies on 187 patients.

18F-FMISO image analysis. MR image (A) registered to a PET 18F-FMISO image (B) showing placement of 2-cm-diameter cerebellar regions of interest to determine surrogate blood activity. Example of cardiac (3-cm diameter) and aortic region of interest (1-cm diameter) on low-dose CT scan used for attenuation correction (C) and PET 18F-FMISO scan (D). Patient examples of 18F-FMISO tumor uptake appear in supplemental materials.
Statistical Analysis
Correlation and regression statistics for comparison of ID tissue and sampled blood activity with their associated hypoxia parameters were performed using JMP (SAS Institute). The comparison of the hypoxia parameters TBmax and HV determined from ID and blood sampling was assessed using regression and Bland–Altman plots to investigate statistical agreement.
To assess ID hypoxia parameters as independent predictors of outcome, we used a cohort of glioma patients imaged before conventional therapy. Our previous report (20), which included 22 glioma patients, relied on blood samples for the determination TBmax and HV and showed predictive value for outcomes. For the current study, the original cohort of patients was expanded to 38 patients.
Univariate and multivariate Cox proportional hazards regression analysis (28) were used to compare the capability of hypoxic parameters determined from both measured and ID blood to predict TTP and survival. Progression was defined by the response assessment in neuro-oncology criteria (RANO) for glioma patients (29). Analyses were considered for overall survival and survival at 2 y, the median survival for patients diagnosed with primary brain cancer (30). Cox multivariate analysis used the hypoxia parameters along with the following conventional predictors: extent of resection, age, sex, and Karnofsky performance score. Grade was not included as 34 of the 38 glioma patients were World Health Organization grade 4. All continuous variables were standardized, so that the hazard ratio represents an increase in risk associated with an SD increase for the variable. Survival analyses were performed in R (R Development Core 2014).
RESULTS
Average parameters for blood reference tissue regions, along with the blood surrogate hypoxia parameters, are presented in Table 2. Overall, surrogate blood regions showed a high correlation (R2 = 0.84, n = 269) to measured blood (Table 3). For studies with cerebellum in the FOV, ID blood activity was highly correlated to sampled blood (R2 = 0.84, n = 170). Other surrogate regions showed a similar relationship to measured blood (heart R2 = 0.84, n = 46; aorta R2 = 0.83, n = 53).
Blood and Hypoxia Parameter Mean Values
Correlation of Blood to ID Blood Surrogates
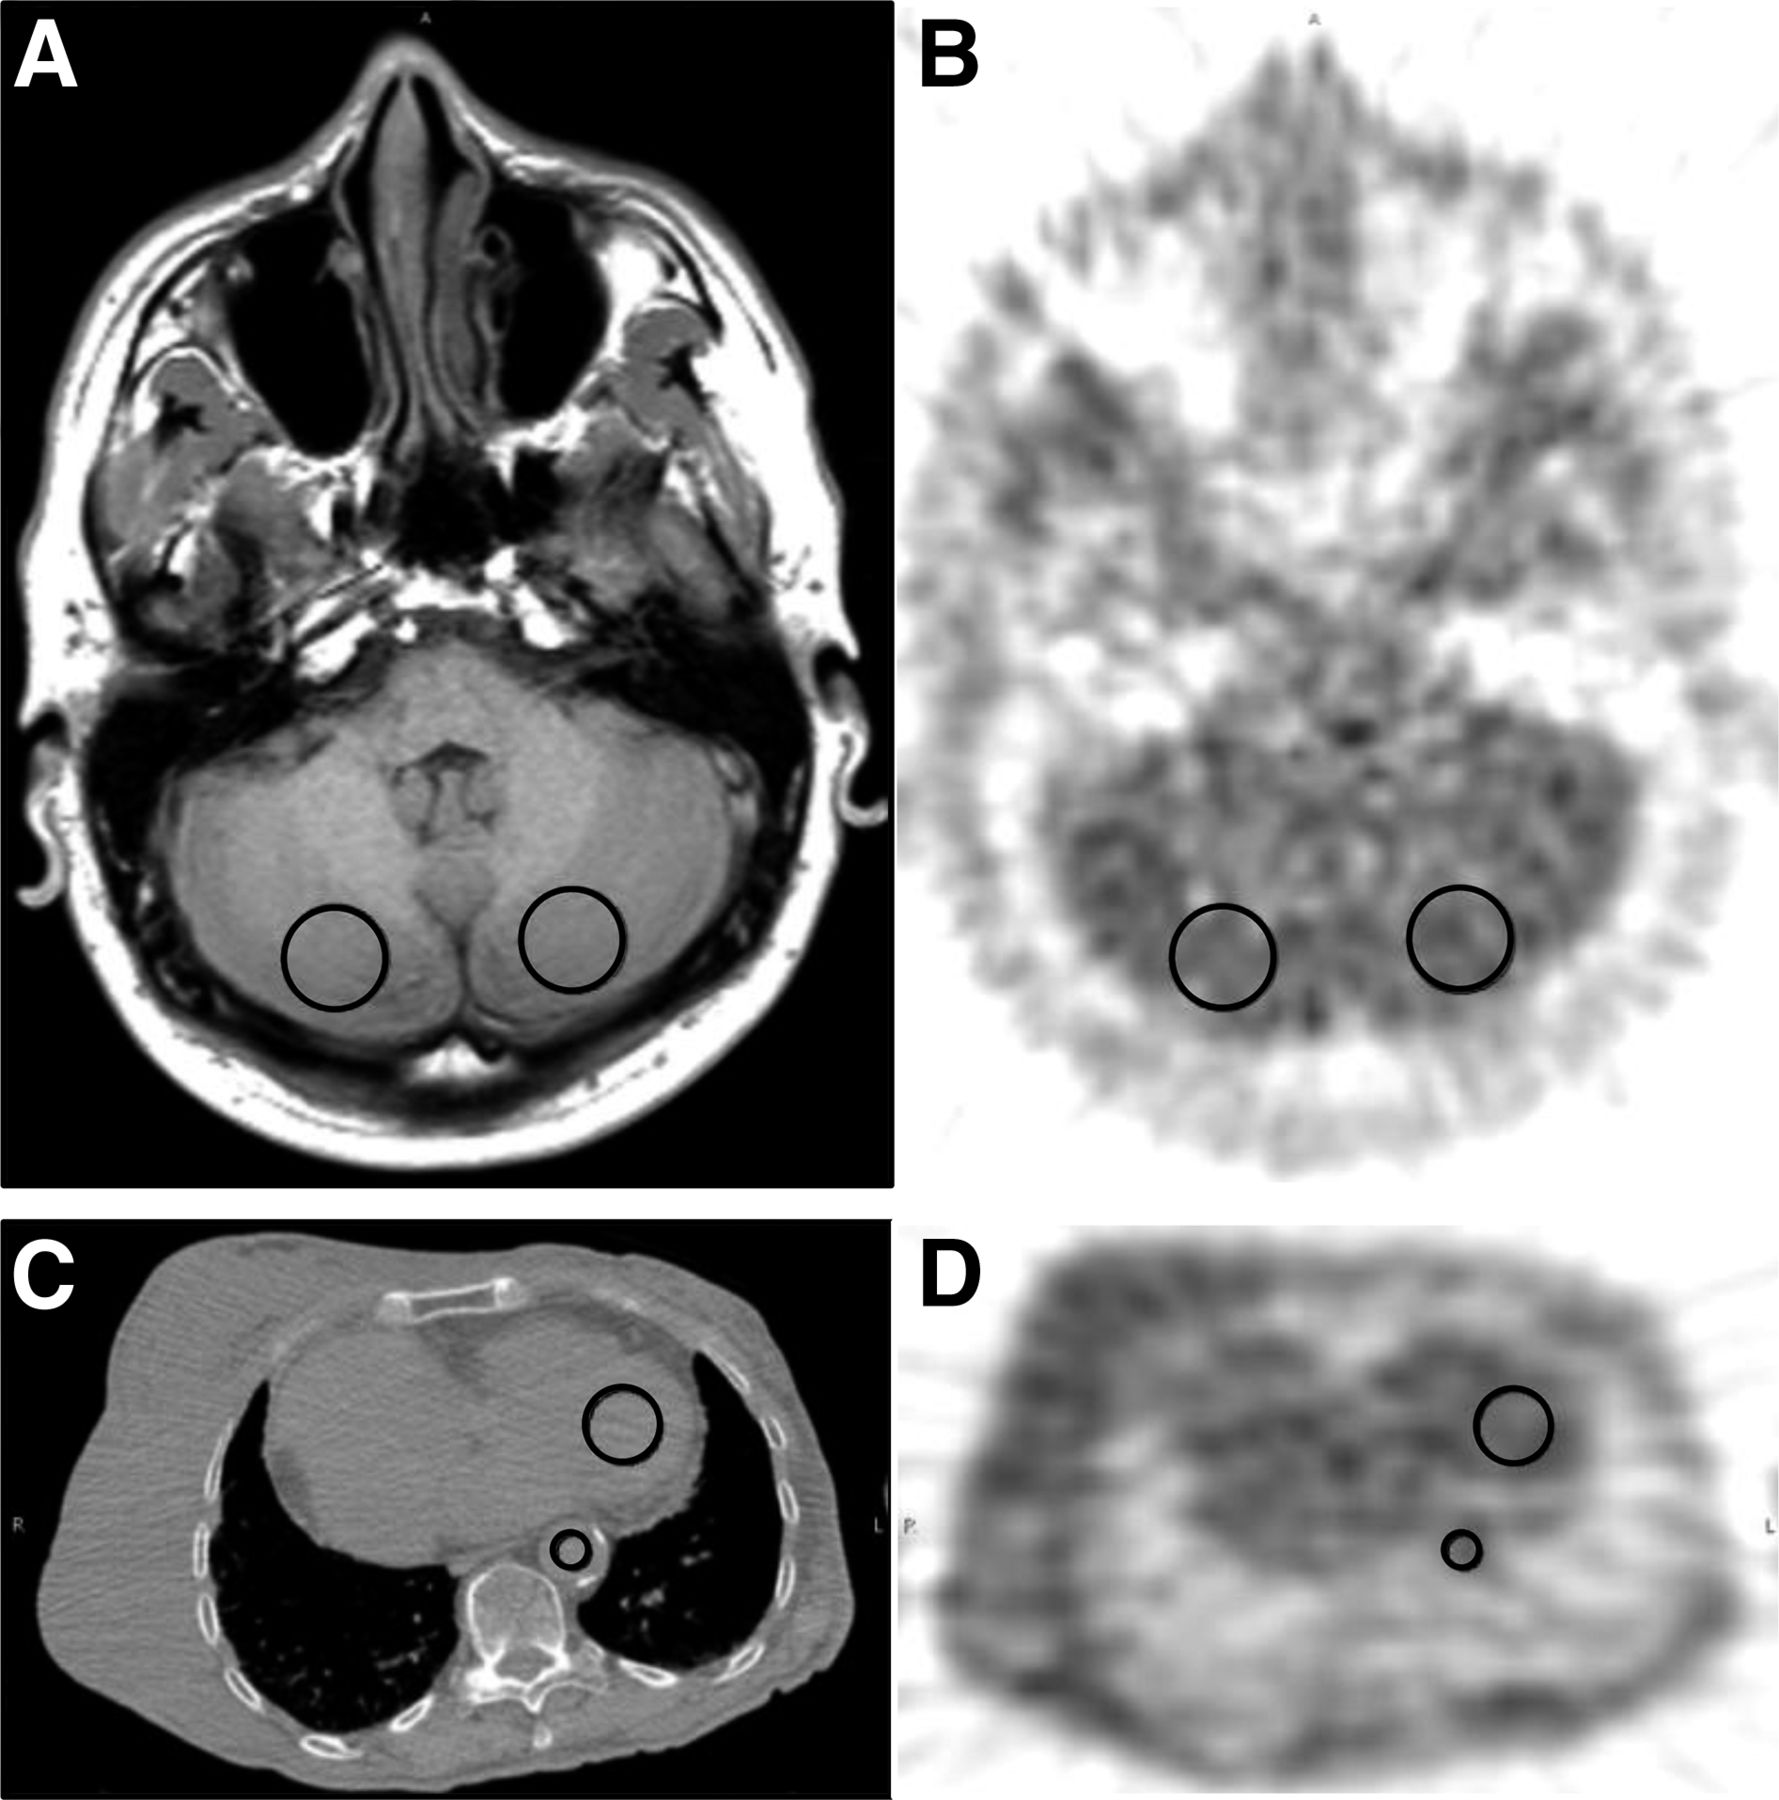
The injected dose had a low correlation (R2 = 0.42) to blood activity (Fig. 2A). Bland–Altman plots (Fig. 2B) for blood activity (MBq/mL) and normalized dose (MBq/kg) showed a severe bias and structure. The regression of ID TBmax versus TBmax showed values clustered around the line of identity (slope = 0.98, intercept = 0.04, SEE/mean = 7% error) and was similar for HV. Bland–Altman plots of TBmax and HV with their coordinate ID parameters all showed little bias, with clustering within the SE limits of ±2 SDs (Fig. 3). Examination of sampled blood and ID blood data using Bland–Altman plots for individual ID regions showed agreement between measures. The data were clustered around the mean and showed little bias or structure. The average percentage difference between blood and ID values also showed minimal bias (TBmax, 1.3%; HV, 6.9%). Overall, the relationship between measured blood and ID blood was consistent (tables and figures in the supplemental material).

Correlation of blood and ID blood. (A) Normalized injected dose (MBq/kg) showed poor correlation (R2 = 0.42, n = 223) to measured blood activity (kBq/mL). (B) Bland–Altman plot of data shows unusual structure with points generally lying obliquely to mean, indicating poor linear relationship. Regression (C) and Bland–Altman (D) plots between measured blood and surrogate blood regions (ID blood) showed high correlation at R2 = 0.84.

Correlation of hypoxia parameters. (A) Regression plot of TBmax vs. ID TBmax for 269 surrogate blood regions shows strong relationship with small coefficient of variation (SEE/mean). (B) Bland–Altman plot shows clustering around mean with little bias. Plots of HV vs. ID HV values in C and D show similar profile.
Kaplan–Meier survival curves are given for both survival and TTP for TBmax and ID TBmax variables for 2 y (Fig. 4). Patients were classified as low or high risk by considering whether they were below or above the median TBmax. When overlaid on those plots, the ID TBmax variable shows a high degree of similarity to blood-derived TBmax. Overall, the ID parameters were as predictive as and showed plot characteristics similar to parameters determined using sampled blood.
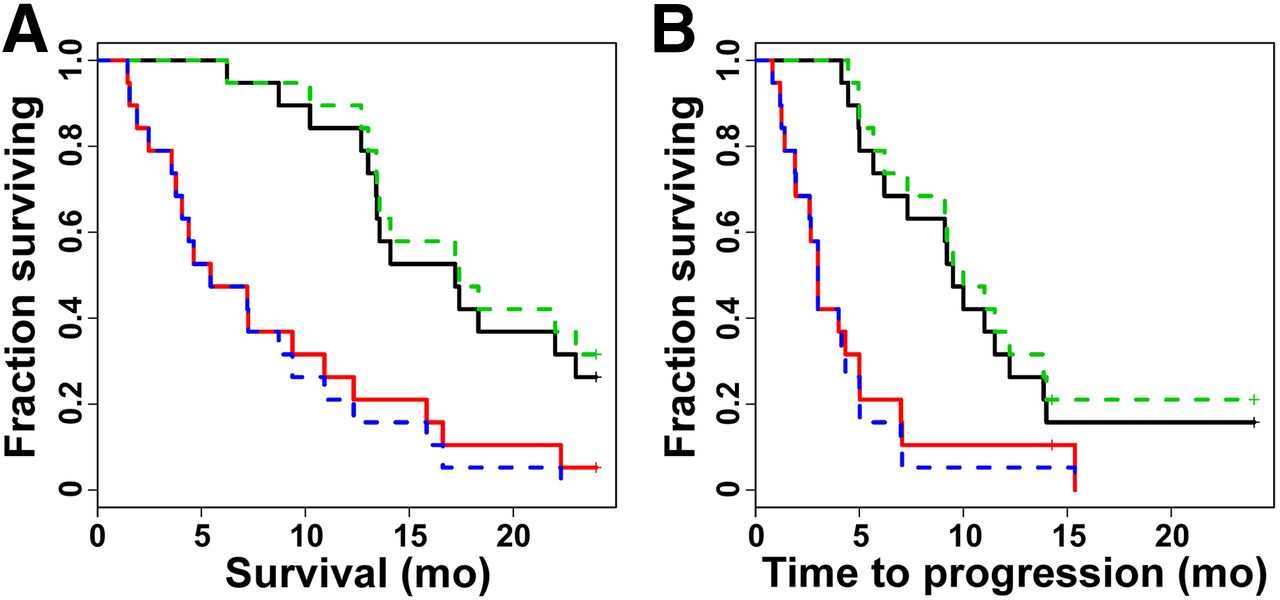
Kaplan–Meier survival analysis. Hypoxia parameters were used to stratify 38 pretreatment glioma patients with respect to 2-y survival and TTP. Kaplan–Meier plots for TBmax demonstrated significantly shorter survival (A) and TTP (B) in high-risk patients (red line) whose tumors possessed TBmax ratios greater than median (TBmax > 1.83) relative to low-risk patients (black line). Using cerebellum as blood surrogate produced hypoxia parameter ID TBmax (dotted lines, median ID TBmax = 1.77) that had nearly predictive power nearly identical to TBmax. Kaplan–Meier plots and results for HV appear in supplemental materials.
Univariate analysis (Tables 4, and 5) showed that ID hypoxia parameters were as predictive as parameters determined using blood samples. Age and Karnofsky score were significantly associated with survival and TTP. Clinical information (age, sex, Karnofsky score, and resection status) was considered in multivariate models with each of the hypoxia variables (Tables 4 and 5). Multivariate Cox proportional hazards analysis showed that all measures of hypoxia (HV, ID HV, TBmax, ID TBmax) were highly significant predictors of outcomes, when the model was adjusted for clinical parameters. Hazard ratios and P values for the 18F-FMISO variables and the clinical covariates all remained similar when the ID variables replaced the ones using sampled blood. R2 values for the models were also similar, with the greatest absolute change being 2% for the comparison of TTP using TBmax or ID TBmax (R2 = 0.47 for the TBmax model versus R2 = 0.49 for the ID TBmax model). Age was the only variable that added prognostic utility when included with hypoxia information using a backward-elimination approach (not shown). Karnofsky score and sex did not add information to the model. HV survival results appear in the supplemental materials.
Results of Univariate Analysis for Predictors of Outcome in Pretreatment Glioma Patients (n = 38)
Results of Multivariate Cox Regression Analysis for Predictors of Outcome in Pretreatment Glioma Patients (n = 38)
DISCUSSION
Since the introduction of the kinetic model of 18F-FMISO metabolism to estimate hypoxia in tumor spheroids (16), work on alternative, simpler methods to assess 18F-FMISO retention and reduce blood sampling and imaging time have been reported (5,14,15,31). These techniques have shortcomings associated with the measurement and interpretation. The complexity of dynamic imaging with arterial sampling is unwarranted for a tracer that distributes in tissue by a partition coefficient mechanism. Agents with partition coefficients far from unity may warrant a more complicated dynamic analysis to separate delivery from retention (32,33). A stable reference such as blood is preferred to normalize 18F-FMISO uptake to tracer delivery by computing a tissue-to-blood partition coefficient (34). The TB ratio provides a reliable and consistent measure of HV, which is based on the retention of reduced 18F-FMISO under conditions of low PO2.
The impact of using an ID tissue surrogate for blood in determining ID HV in glioma patients produced an average bias of approximately 6% and was considered minimal. The average bias for cardiac and aortic surrogates for ID HV in nonneural tumors was 4% and 8%, respectively. This is tolerable as a trade-off to eliminate blood sampling from the protocol.
Imaging 18F-FMISO in several cancer types, with identification of vasculature through coordinate CT or MR mapping, provides an ID surrogate that is directly correlated to sampled blood activity. Studies that imaged the heart separately from tumor illustrate that a region without a blood pool can be used to quantify 18F-FMISO, provided that a secondary scan over the heart can be acquired. Results from 18F-FMISO brain studies show a high correlation between cerebellar and venous blood activity. These correlative results suggest that quantifying 18F-FMISO hypoxia parameters can be based on ID surrogate activity that has been shown to correlate to sampled blood.
An alternative analysis without blood sampling could be considered based on the relationship between the weight-normalized injected dose and sampled blood activity. The normalized injected dose (MBq/kg) showed poor correlation (R2 = 0.42, n = 223) to blood activity concentration (Bq/mL), and the Bland–Altman plot of the data shows structure with points generally lying obliquely to the mean, indicating a poor linear relationship. We conclude that normalizing to injected dose is not valid.
Previously, we reported on the predictive value of TBmax and HV determined from blood samples for outcome in glioma patients (20). Survival analysis using 18F-FMISO imaging results from 38 brain tumor patients support the hypothesis that a greater hypoxic tumor burden before therapy predicts shorter survival and TTP. However, these results imply that more HV means more tumor is at risk for the genomic consequences of hypoxia. This interpretation may apply to HV, but the tumor TBmax or ID TBmax as indicators of hypoxia are less dependent on tumor volume. TBmax has the advantage of not requiring an empiric threshold for hypoxia assessment, and ID TBmax has a further advantage of not requiring blood sampling. Survival analyses of hypoxic parameters determined without blood sampling were nearly identical to those determined with blood samples. This suggests that the most parsimonious method for quantifying hypoxia with 18F-FMISO is an imaging session after partition equilibrium with no blood sampling to yield hypoxic parameters useful for assessing response and predicting outcome.
CONCLUSION
ID tissue regions that are highly correlated to blood levels can be used as surrogates in the quantification of hypoxia parameters for 18F-FMISO imaging (TBmax and HV). This association supports the elimination of serial blood sampling during 18F-FMISO imaging. Reducing the complexity of 18F-FMISO imaging through a short static imaging session without blood sampling is a parsimonious method to delineate tumor hypoxia without compromising the efficacy of the hypoxic assessment, which makes it suitable as a routine clinical procedure and for large clinical trials.
DISCLOSURE
The costs of publication of this article were defrayed in part by the payment of page charges. Therefore, and solely to indicate this fact, this article is hereby marked “advertisement” in accordance with 18 USC section 1734. Our research was supported by the National Cancer Institute (P01-CA042045, R01-CA72064), a NIH major equipment grant (RR-017229), ACRIN (U01CA079778 and U01CA080098), and the Science Foundation of Ireland (11/PI/1027). No other potential conflict of interest relevant to this article was reported.
Acknowledgments
Our initial studies of hypoxia were motivated by Drs. Janet Rasey, Wui-Jin Koh, Janet Eary, and Alexander Spence, who we gratefully acknowledge for their contribution toward our perspective on hypoxia imaging. We also acknowledge the effort of Dr. Jeanne Link and the UW radiochemistry group for the many productions of 18F-FMISO.
Footnotes
Published online Jun. 25, 2015.
- © 2015 by the Society of Nuclear Medicine and Molecular Imaging, Inc.
REFERENCES
- Received for publication April 3, 2015.
- Accepted for publication June 15, 2015.


Jump to section
Related Articles
Cited By...
- ACRIN 6684: Assessment of Tumor Hypoxia in Newly Diagnosed Glioblastoma Using 18F-FMISO PET and MRI
- Noninvasive PET Imaging and Tracking of Engineered Human Muscle Precursor Cells for Skeletal Muscle Tissue Engineering
- Imaging Hypoxia with 18F-Fluoromisonidazole: Challenges in Moving to a More Complicated Analysis