


Abstract
Quantification of tumor perfusion using radioactive water (H215O) and PET is a promising method for monitoring treatment with antiangiogenic agents. However, use of dynamic H215O scans together with a fully 3-dimensional clinical PET/CT scanner needs to be validated. The purpose of the present study was to assess validity and reproducibility of dynamic H215O PET/CT scans for measuring tumor perfusion and validate the quantitative accuracy of parametric perfusion images. Methods: Eleven patients with non–small cell lung cancer were included in this study. Patients underwent 2 dynamic H215O (370 MBq) PET scans on the same day. During the first scan, arterial blood was withdrawn continuously. Input functions were derived from blood sampler data and the ascending aorta as seen in the images themselves (image-derived input function [IDIF]). Parametric perfusion images were computed using a basis function implementation of the standard single-tissue-compartment model. Volumes of interest (VOIs) were delineated on low-dose CT (LD-CT) and parametric perfusion images. Results: VOIs could be accurately delineated on both LD-CT and parametric perfusion images. These parametric perfusion images had excellent image quality and quantitative accuracy when compared with perfusion values determined by nonlinear regression. Good correlation between perfusion values derived from the blood sampler input function and IDIF was found (Pearson correlation coefficient, r = 0.964; P < 0.001). Test–retest variability of tumor perfusion was 16% and 20% when delineated on LD-CT and parametric perfusion images, respectively. Conclusion: The use of ascending aorta IDIFs is an accurate alternative to arterial blood sampling for quantification of tumor perfusion. Image quality obtained with a clinical PET/CT scanner enables generation of accurate parametric perfusion images. VOIs delineated on LD-CT have the highest reproducibility, and changes of more than 16% in tumor perfusion are likely to represent treatment effects.
Angiogenesis, or formation of new blood vessels, is essential for tumor growth, tumor progression, and development of metastases (1,2). Many proangiogenic factors regulate this process, with vascular endothelial growth factor being the most important. Consequently, it has been shown that antiangiogenic therapy, particularly when targeting the vascular endothelial growth factor signaling pathway, provides a survival benefit in patients with solid malignancies including non–small cell lung cancer (NSCLC) (3–9).
Response evaluation of antiangiogenic drugs, however, remains a challenge, because response to antiangiogenic therapy is not necessarily reflected by drug-induced changes in tumor size (10–13). Therefore, new imaging tools are needed to assess the efficacy of antiangiogenic drugs to select cancer patients who may benefit from those agents early during treatment.
Previous studies have shown that quantification of tumor perfusion using radioactive water (H215O) and PET is a promising method to monitor antiangiogenic treatment (14–18). The short half-life of 15O enables serial measurements within a single scan session. Because contrast between tumor and background in H215O images usually is low, these scans often are followed by a second PET scan using, for example, 18F-FDG (19) or 3-deoxy-3-18F-fluorothymidine (18F-FLT) (20). These additional scans are required to define appropriate regions of interest, which subsequently are copied onto the H215O images.
To date, most PET scanners are combined with CT, which enables tumor localization on a low-dose CT (LD-CT) scan. In addition, these scanners allow for 3-dimensional (3D) PET with much lower doses of H215O (<400 MBq) than that (>1 GBq) usually administered in the case of older stand-alone 2-dimensional (2D) PET scanners. At present, however, PET/CT has primarily been used for whole-body 18F-FDG studies using, at best, a semiquantitative approach for analyzing data. Only a few studies have addressed full quantification of tracer kinetics using a 3D PET/CT scanner.
Although test–retest variability of H215O perfusion studies has been reported previously for a stand-alone 2D scanner, those results are not necessarily valid for a state-of-the-art 3D PET/CT scanner because of the higher scatter fraction of the PET/CT device. On the other hand, the superior image quality of 3D PET/CT provides the potential of performing analyses at the voxel level, thereby generating parametric perfusion images.
The aims of the present study were to validate the use of an image-derived input function (IDIF) in the case of 3D acquisitions, assess the accuracy of parametric perfusion images, and assess test–retest variability of tumor perfusion measured using a state-of-the-art PET/CT scanner.
MATERIALS AND METHODS
Patients
Between September 2008 and May 2009, 11 patients (9 men, 2 women; mean age ± SD, 59 ± 12 y) with advanced-stage NSCLC participated in this prospective study. Inclusion criteria were 18 y of age or older, life expectancy of at least 12 wk, a malignant lesion of at least 1.5 cm in diameter in the chest, Karnofsky performance status scale score greater than 60%, thrombocyte count more than 100 × 109 L−1, and hemoglobin more than 6.0 mmol·L−1. Exclusion criteria included patients who were claustrophobic, pregnant, or lactating; had metal implants (e.g., pacemakers); used coumarin derivatives or inhibitors of thrombocyte aggregation; were undergoing concurrent treatment with experimental drugs; or had participated in a clinical trial with any investigational drug within 30 d before study entry. Before inclusion, each patient signed a protocol-specific informed consent form that had been approved by the Medical Ethics Review Committee of the VU University Medical Center.
Scanning Protocol
Studies were performed on a Gemini TF-64 PET/CT scanner (Philips) (21). This scanner has an axial field of view of 18 cm, divided into 45 contiguous planes. Ten of 11 patients underwent 2 H215O scans on the same day. Patients received an indwelling radial artery catheter for arterial blood sampling and a venous catheter for tracer injection. Patients were positioned supine in the scanner bed, with both tumor and aortic arch in the center of the axial field of view. Elastic body-restraining bandages were used to minimize movement during scanning. After a 50-mAs LD-CT scan for attenuation correction, a 10-min dynamic scan was started simultaneously with an intravenous injection of 370 MBq of H215O (22) (5 mL at 0.8 mL·s−1), followed by 35 mL of saline (2 mL·s−1). Data were normalized, and all appropriate corrections were applied for dead time, randoms, scatter, and attenuation. Each emission scan was reconstructed into 26 frames (1 × 10, 8 × 5, 4 × 10, 2 × 15, 3 × 20, 2 × 30, and 6 × 60 s) using the 3D row-action maximum-likelihood reconstruction algorithm with a reconstructed resolution of 6.5 mm.
Arterial Blood Sampling
To compare the use of an IDIF with the blood sampler input function (BSIF), arterial blood was sampled during the first scan. Arterial blood was withdrawn continuously at a rate of 5 mL·min−1 during the first 5 min and 1.7 mL·min−1 thereafter, using an online detection system (23). In addition, at 5, 8, and 10 min after injection, 10 mL arterial blood samples were collected manually. These samples were counted in a well-counter that was cross-calibrated against the PET scanner and were subsequently used to calibrate the online blood curve.
Input Functions
Volumes of interest (VOIs) (diameter, 1 cm) were drawn over the ascending aorta in approximately 10 consecutive image planes of the frame in which the first pass of the bolus was best visualized. Projection of the resulting VOI onto all image frames yielded the arterial time–activity curve or IDIF CA(t). Applying a similar approach to the right ventricular cavity and pulmonary artery provided a time–activity curve for the pulmonary circulation CV(t). Blood sampler data were corrected for delay and dispersion by fitting the early part of the sampler curve to the ascending aorta time–activity curve, convolved with a single exponential dispersion function and including a delay parameter. The sampler curve was subsequently shifted and corrected for dispersion using these fitted delay and dispersion constants. The resulting delay- and dispersion-corrected sampler curve was calibrated using the manually drawn samples, finally providing the BSIF.
Parametric Images
Parametric perfusion images were generated using IDIFs and a basis function implementation of the standard single-tissue-compartment model (24–26), applying corrections for both arterial and pulmonary artery blood volumes (27):
Definition of Tumor VOIs
All LD-CT images were converted to ECAT 7 format. Tumor VOIs were drawn on the LD-CT image by an experienced nuclear medicine physician unaware of patients’ histories and outcomes, using the CAPP software package (CTI/Siemens). On parametric perfusion images, focally enhanced perfusion other than physiologic perfusion was interpreted as potentially malignant. VOIs were defined by the same nuclear medicine physician using software developed in-house, applying a semiautomatic threshold technique (50% of the maximum pixel value with correction for local background) (28).
Data Analysis
All tumor VOIs were projected onto the dynamic H215O images, thereby generating tumor time–activity curves. In addition, VOIs defined on parametric perfusion images were copied to parametric VT images. Using nonlinear regression (NLR), tumor time–activity curves were fitted to the standard single-tissue-compartment model for H215O (Eq. 1) with or without (i.e., VV set to 0) correction for pulmonary circulation blood volume, yielding F and VT. Perfusion values obtained using BSIF and IDIF were compared for CT-based VOIs. The need to include a correction for pulmonary circulation blood volume in the model was assessed for CT-based VOIs using the Akaike and Schwartz criteria (29,30). The quantitative accuracy of parametric images was validated by comparing (unweighted) average VOI perfusion and distribution volume values directly extracted from the parametric images to tumor perfusion and distribution volume obtained by NLR of the corresponding tumor time–activity curve.
Correlations were explored using the Pearson correlation coefficient. Level of agreement between test and retest values was determined using an intraclass correlation coefficient (ICC) with a 2-way random model. The Bland and Altman method (31) was used to analyze the difference between the 2 measurements and to test the repeatability of each measurement. The repeatability coefficient was calculated as 1.96 times the SD of the differences. For comparison, the repeatability coefficient is also given as a percentage of the average value of the 2 measurements. For correlation and test–retest analyses, only the primary tumor in each patient was used, whereas only IDIF-based values were entered into test–retest analyses.
RESULTS
Delineation of Tumors
Eleven primary tumors and 7 mediastinal metastases were in the field of view of the dynamic scan. Ten of 11 primary tumors could be delineated on the LD-CT scan (Supplemental Table 1; supplemental materials are available online only at http://jnm.snmjournals.org), whereas 1 could not be defined because of postobstruction atelectasis, which could not be distinguished from the primary tumor. In addition, 3 of 7 mediastinal metastases could be delineated on the LD-CT scan. On the parametric perfusion images, fewer lesions could be defined than on the LD-CT scan (11 vs. 13 VOIs; Supplemental Table 2).
IDIF Versus Arterial Sampling
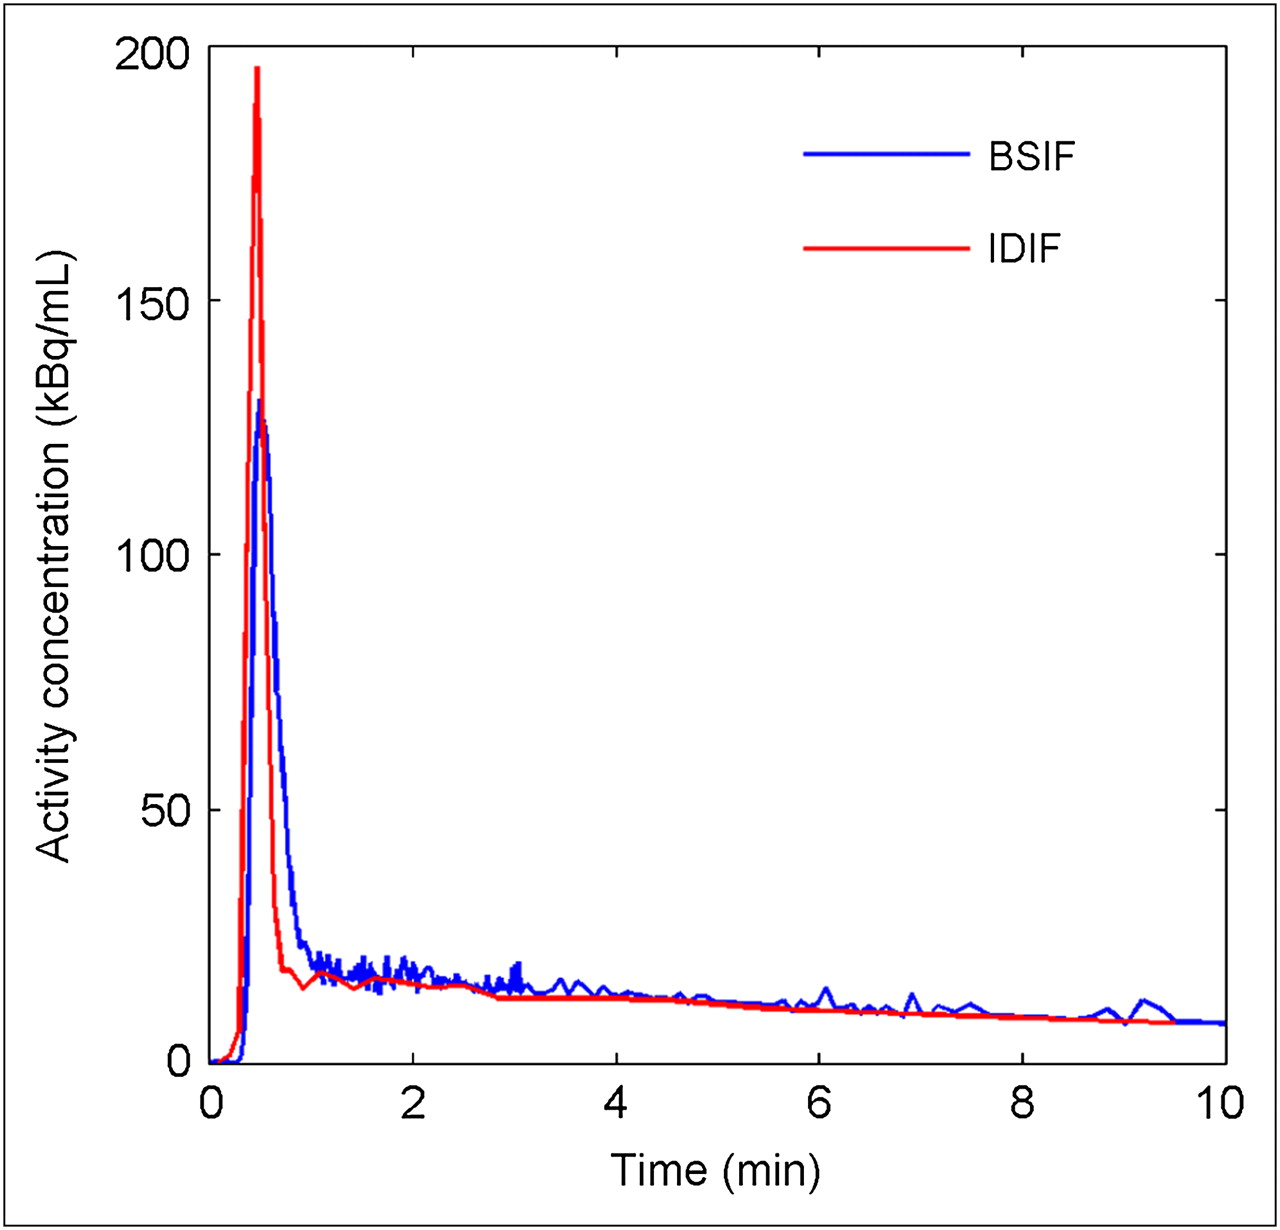
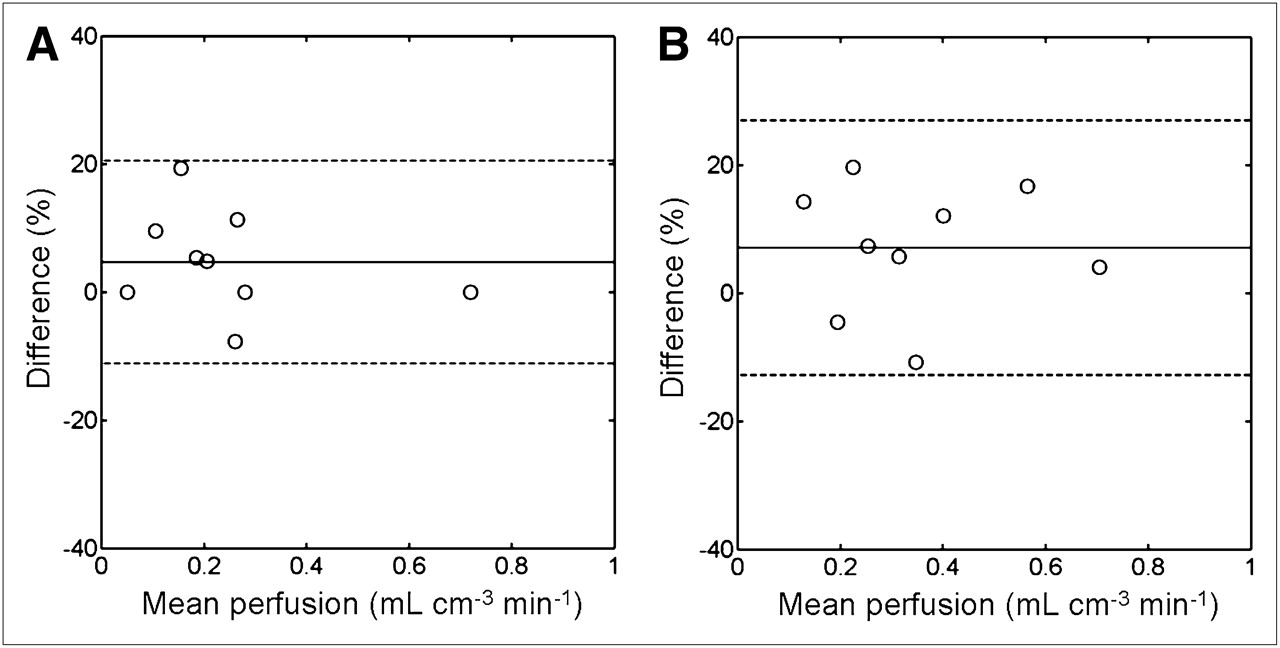
Arterial sampling was successfully performed, except for 1 patient in whom online sampling was difficult because of formation of a thrombus in the line of the detection system. Therefore, this patient was excluded from BSIF analyses. The IDIF curve was isomorphic to the BSIF curve (Fig. 1). However, the IDIF peak was sharper because of dispersion in the blood-sampling system. A high correlation between IDIF and blood sample activity concentrations was found (r = 0.954; P < 0.001). Tumor perfusion and VT based on the ascending aorta IDIF showed high correlations with corresponding values based on arterial sampling (r = 0.964 and 0.835, respectively; P < 0.001). In addition, agreement between BSIF- and IDIF-based tumor perfusion and distribution volume values was high, with ICCs of 0.956 (95% confidence interval [CI], 0.819–0.990) and 0.850 (95% CI, 0.491–0.964), respectively. Figure 2 presents scatter and Bland–Altman plots of tumor perfusion derived using ascending aorta IDIF vs. BSIF.

Typical example of IDIF based on ascending aorta and corresponding BSIF (not corrected for dispersion) derived from same dynamic dataset.
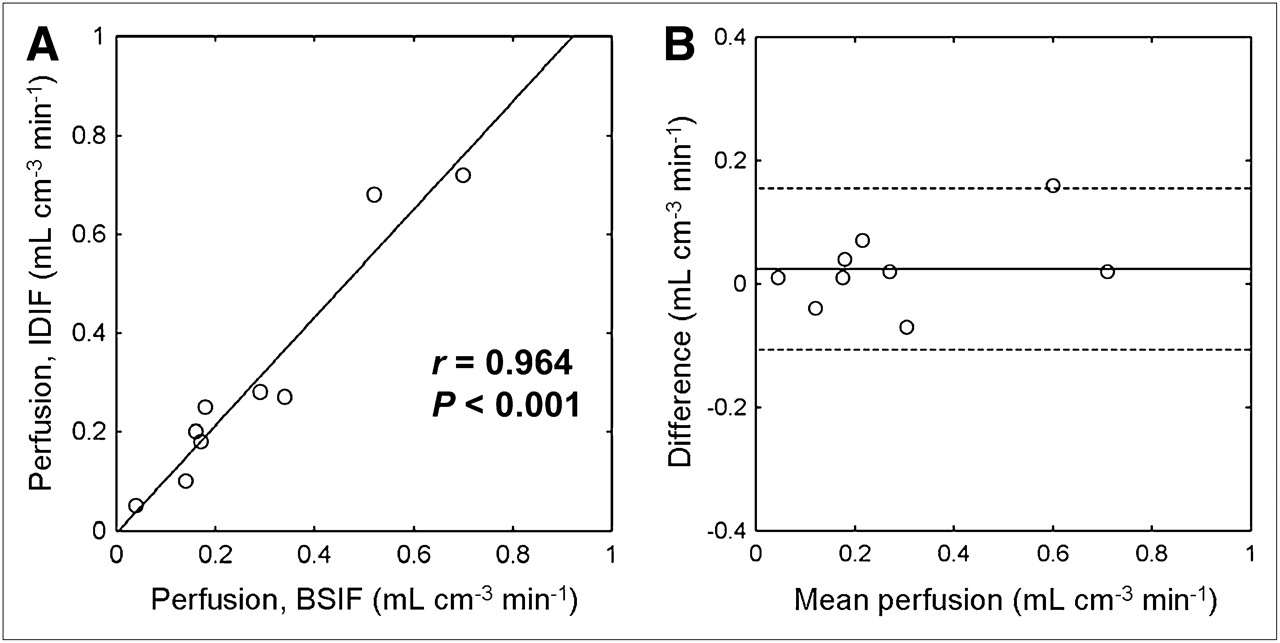
Scatter (A) and Bland–Altman (B) plots of tumor perfusion derived using ascending aorta IDIF vs. BSIF. Solid line (A) represents linear fit through data points. Dotted lines (B) represent ± 1.96 × SD values. Difference was absolute change between test and retest scans, and mean perfusion was mean tumor perfusion of test and retest scans.
Pulmonary Blood Volume Correction
In 9 of 11 patients, VOIs for pulmonary blood volume correction were defined in both the pulmonary artery and the right ventricular cavity. In 1 patient, VOIs could be defined only in the pulmonary artery because the right ventricular cavity was not in the field of view. In another patient, both the pulmonary artery and the right ventricle were outside the field of view, and the superior caval vein was used instead. In all delineated lesions (n = 24), Akaike and Schwarz analyses showed better fits when a pulmonary blood volume parameter was included, but its inclusion did not affect absolute values of tumor perfusion (correlation between tumor perfusion with and without pulmonary blood volume parameter: r = 1.000; P < 0.001).
Validation of Parametric Images
Perfusion and distribution volumes as determined directly from the parametric images, using an ascending aorta IDIF, were compared with those obtained using the NLR of Equation 1 to the VOI time–activity curve. Correlation (F: r = 0.979; VT: r = 0.950; P < 0.001) and agreement (F: ICC, 0.979; 95% CI, 0.917–0.995; VT: ICC, 0.949; 95% CI, 0.791–0.988) between parametric images and NLR were excellent. Figure 3 shows scatter and Bland–Altman plots of tumor perfusion values as determined directly from the parametric images versus values determined by NLR of tumor time–activity curves. Furthermore, parametric images clearly showed increased perfusion in the tumor (Fig. 4).
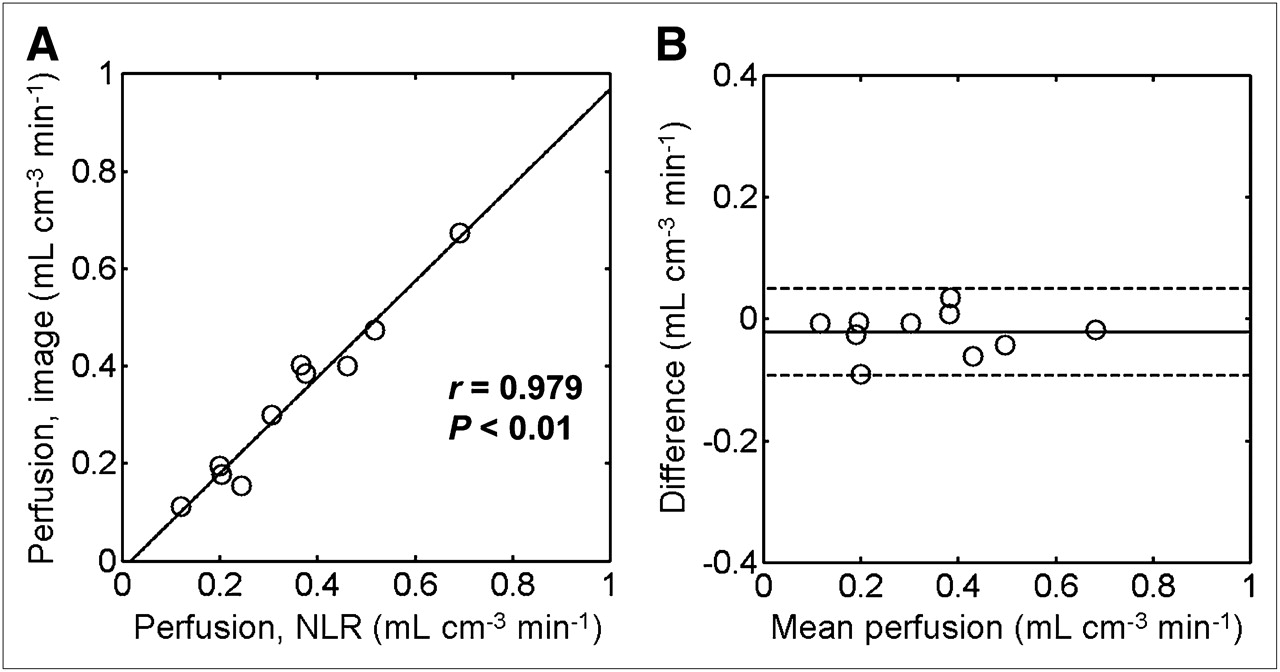
Scatter (A) and Bland–Altman (B) plots of tumor perfusion values directly from parametric images vs. perfusion values determined by NLR of tumor time–activity curves, using 50% isocontour VOIs defined on parametric perfusion images. Parametric images were generated using IDIFs. Solid line (A) represents linear fit through data points. Dotted lines (B) represent ± 1.96 × SD values. Difference was absolute change between test and retest scans, and mean perfusion was mean tumor perfusion of test and retest scans.
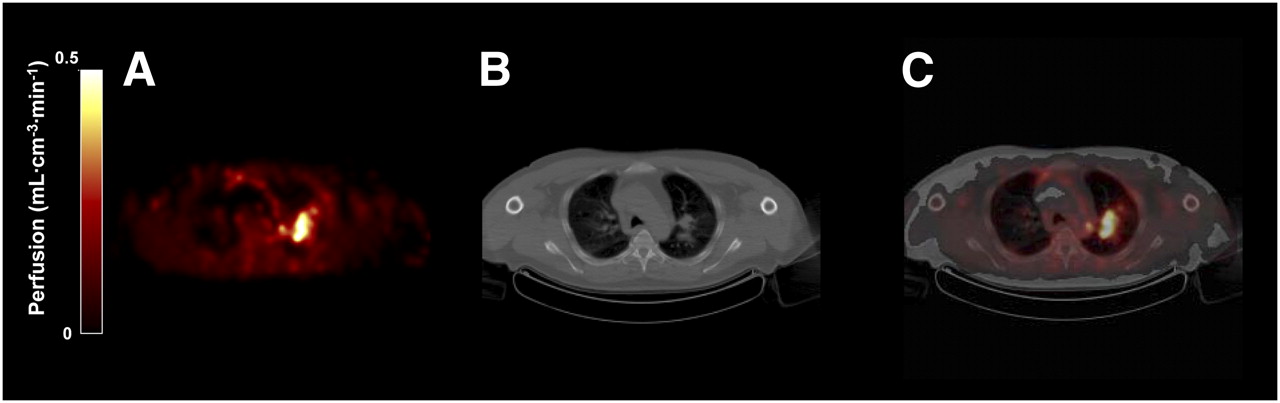
PET/CT images of primary tumor in 54-y-old man (patient 6) with metastatic NSCLC. Parametric perfusion image (A; 10 mm in full width at half maximum filter) shows increased perfusion in primary tumor in left upper lobe. B and C represent corresponding CT and PET/CT fusion images, respectively.
Test–Retest Reproducibility
When VOIs were defined on the LD-CT scan, tumor perfusion, distribution volume, and tumor size showed good reproducibility, with ICCs of 0.997 (95% CI, 0.986–0.999), 0.880 (95% CI, 0.560–0.972), and 0.998 (95% CI, 0.993–1.000), respectively (Table 1). When VOIs were defined on parametric perfusion images, reproducibility of tumor perfusion was comparable (ICC, 0.980; 95% CI, 0.915–0.996). For parametric-based VOIs, the ICCs for tumor size and distribution volume were 0.811 (95% CI, 0.367–0.954) and 0.871 (95% CI, 0.532–0.969), respectively. In addition, perfusion values directly taken from parametric perfusion images showed good reproducibility, with an ICC of 0.977 (95% CI, 0.901–0.995). Distribution volumes taken directly from parametric VT images, using VOIs defined on perfusion images, showed slightly better reproducibility (ICC, 0.908; 95% CI, 0.649–0.979) than VT values calculated using NLR. Figure 5 shows Bland–Altman plots of tumor perfusion values for CT- and parametric-based VOIs. The repeatability coefficient of tumor perfusion was 16% and 20% when delineated on LD-CT and parametric perfusion images, respectively (Table 1).
Reproducibility of Tumor Measurements Using Dynamic H215O PET/CT Scans

Bland–Altman plots of tumor perfusion based on delineation on LD-CT scan (A) and parametric perfusion images (B). Dotted lines represent ± 1.96 × SD values. Difference was percentage change between test and retest scans, calculated by subtracting values of morning scans from those of afternoon scans; mean perfusion was mean tumor perfusion of test and retest scans.
Correlation Between CT- and Parametric-Based VOIs
In 8 of 10 primary tumors, tumor perfusion was higher for parametric-based VOIs than for CT-based VOIs (0.29 ± 0.23 mL·cm−3·min−1 vs. 0.35 ± 0.17 mL·cm−3·min−1; mean ± SD). Nevertheless, correlation between both sets of perfusion data was high (r = 0.835; P = 0.003).
DISCUSSION
In this study, the use of low-dose dynamic H215O scans for assessment of tumor blood flow using a clinical, fully 3D PET/CT scanner was evaluated. In NSCLC patients, the LD-CT scan enabled delineation of appropriate VOIs, which makes additional PET scans with 18F-FDG or 18F-FLT for delineation of VOIs obsolete, resulting in decreased radiation burden and scanning time. In addition, quantitative H215O PET/CT tumor perfusion measurements had excellent reproducibility. Image quality obtained with the relatively low dose of 370 MBq of H215O (compared with the usual dose of 1,100 MBq for 2D scanners) was such that accurate parametric perfusion images with good statistics could be produced. On the basis of the present results, changes in tumor perfusion of more than 16% in CT-based VOIs or 20% in parametric-based VOIs are likely to reflect treatment effects.
For quantification of perfusion, an arterial input function is needed. This can be obtained using either arterial sampling or an IDIF. Arterial sampling is invasive and limits clinical applicability. On the other hand, IDIFs are prone to partial-volume effects and can be used only when a large structure containing arterial blood is visible in the field of view. In the present study, noninvasive IDIFs of the ascending aorta were compared with arterial concentrations obtained using invasive BSIFs. Resulting tumor perfusion values agreed well with each other (Fig. 2), indicating that use of ascending aorta IDIFs is a valid noninvasive alternative to arterial blood sampling. Although manual IDIF definition is time-consuming, automated IDIF definition has recently been shown to be feasible for myocardial perfusion imaging with H215O (32) and may similarly be applied for quantification of tumor perfusion in the thorax.
Inclusion of a pulmonary blood volume parameter in Equation 1 resulted in improved fits, whereas tumor perfusion values were not affected significantly. Because blood vessels of the pulmonary circulation are erroneously depicted as areas with high perfusion in parametric images when no pulmonary blood volume parameter is applied, inclusion of a pulmonary blood volume parameter also improves the quality of parametric images. Consequently, the application of this parameter facilitates delineation of tumors that are close to large blood vessels on parametric images.
In contrast to a stand-alone 2D PET scanner (20), the present 3D PET/CT scanner did produce parametric perfusion images of good quality. This can be explained by differences in noise-equivalent count rates. During the first pass of 370 MBq of H215O, the observed noise-equivalent count rate was 5 times higher than that during the first pass of 1,100 MBq of H215O on the stand-alone 2D PET scanner used previously (20). This difference is mainly due to the much lower random coincidence rate on the 3D PET/CT scanner, because of its narrower coincidence time window (6 vs. 12 ns) and the use of lutetium yttrium orthosilicate instead of bismuth germinate crystals.
As can be seen from Figure 3, measured perfusion was variable between different tumors, as is in line with previous studies investigating perfusion in lung cancer (19,20). In addition, reproducibility of perfusion measurements using the present 3D PET/CT scanner was comparable to the results of a previous study in NSCLC patients on a stand-alone 2D PET scanner (20). In that study, an additional 18F-FLT PET scan was used for delineation of lesions, and changes of more than 18% in tumor perfusion and 32% in distribution volume were likely to represent biologic effects (20). The reproducibility of distribution volume, however, was better using a 2D PET scanner than using CT-based values of the PET/CT scanner, which had a reproducibility of 47%. However, the reproducibility of distribution volume was better than for CT-based VOIs and more comparable to the previous study for VOIs defined on parametric perfusion images.
When compared with parametric-based VOIs, application of CT-based VOIs resulted in larger tumor volumes with lower perfusion values. Delineation of lesions on the LD-CT scan results in average perfusion values over the whole CT volume, which may include nonvital necrotic tissue (Fig. 6). Parametric perfusion images, on the other hand, preserve spatial information and enable visual assessment of a perfusion image, allowing selective delineation of well-perfused parts in heterogeneous tumors. In addition, delineation on a PET scan with a second tracer such as 18F-FDG or 18F-FLT (20) may facilitate the identification of vital tumor tissue, giving perfusion only in metabolically active or only in highly proliferative tumor tissue, respectively.

PET/CT images of primary tumor in 73-y-old man (patient 3) with metastatic NSCLC. Parametric perfusion image (10 mm in full width at half maximum filter) shows high perfusion in peripheral zone of tumor (A; arrow) but low perfusion in central region. B and C represent corresponding CT and PET/CT fusion images, respectively. Because of dispersion, high perfusion is erroneously shown in descending aorta (*).
Although dynamic H215O PET/CT measurements are feasible, there are 2 practical limitations to use in NSCLC patients. First, the image quality of an LD-CT scan may be too low to adequately distinguish tumor from mediastinal structures. In addition, high (physiologic) perfusion in postobstruction atelectasis may even mirror tumor perfusion on parametric perfusion images. In such cases, a diagnostic CT scan with a higher radiation dose or an additional 18F-FDG PET scan may be required to define lesions accurately. Second, quantification of tumor perfusion within the thorax may be affected by respiration, resulting in respiration-averaged images with lower perfusion values. Pulmonary gating might overcome this issue but remains a challenge when used in combination with dynamic scans.
Several methods are available to delineate VOIs on H215O PET/CT scans, including LD-CT, parametric perfusion images, and even PET scans with a second tracer. However, it is currently not clear which delineation method best characterizes treatment-induced changes in tumor perfusion, especially in the case of spatially varying heterogeneous responses. Therefore, studies are warranted that compare the predictive value of these different delineation methods in patients treated with antiangiogenic agents.
CONCLUSION
In NSCLC patients, it is feasible to assess tumor perfusion using dynamic H215O PET on a clinical PET/CT scanner. In this case, the use of an ascending aorta time–activity curve as the input function is an accurate alternative to arterial blood sampling. The high image quality allows generation of parametric perfusion images with good statistics. Tumors can conveniently be delineated on both LD-CT and parametric perfusion images, but CT-based VOIs result in the highest reproducibility of tumor perfusion.
Acknowledgments
We thank Suzette van Balen, Amina Elouahmani, Judith van Es, Femke Jongsma, Rob Koopmans, Nasserah Sais, and Annemiek Stiekema for assistance with scanning; Natasja Kok, Ilona Pomstra, and Atie van Wijk for help with logistic planning and patient care; Dennis Boersma, Arthur van Lingen, and Maqsood Yaqub for technical assistance; Otto Hoekstra for critical reading of the manuscript; Sebastiaan Kleijn for assistance with the figures; and Henri Greuter, Gert Luurtsema, Kevin Takkenkamp, and Robert Schuit for production of H215O and analysis of blood samples.
- © 2010 by Society of Nuclear Medicine
REFERENCES
- Received for publication May 16, 2010.
- Accepted for publication August 3, 2010.


Jump to section
Related Articles
Cited By...
- Quantitative Perfusion Imaging with Total-Body PET
- Assessment of Simplified Methods for Quantification of 18F-FDHT Uptake in Patients with Metastatic Castration-Resistant Prostate Cancer
- Photoacoustic imaging as a tool to probe the tumour microenvironment
- Sympathetic Innervation of Cold-Activated Brown and White Fat in Lean Young Adults
- Multiparametric Analysis of the Relationship Between Tumor Hypoxia and Perfusion with 18F-Fluoroazomycin Arabinoside and 15O-H2O PET
- 15O-Water PET Study of the Effect of Imatinib, a Selective Platelet-Derived Growth Factor Receptor Inhibitor, Versus Anakinra, an IL-1R Antagonist, on Water-Perfusable Tissue Fraction in Colorectal Cancer Metastases
- Assessment of Simplified Methods to Measure 18F-FLT Uptake Changes in EGFR-Mutated Non-Small Cell Lung Cancer Patients Undergoing EGFR Tyrosine Kinase Inhibitor Treatment
- In Vivo Imaging as a Pharmacodynamic Marker
- Toward Prediction of Efficacy of Chemotherapy: A Proof of Concept Study in Lung Cancer Patients Using [11C]docetaxel and Positron Emission Tomography
- 15O PET Measurement of Blood Flow and Oxygen Consumption in Cold-Activated Human Brown Fat
- Development of [11C]erlotinib Positron Emission Tomography for In Vivo Evaluation of EGF Receptor Mutational Status
- Absolute Quantification of [11C]docetaxel Kinetics in Lung Cancer Patients Using Positron Emission Tomography
- Myocardial Oxygen Extraction Fraction Measured Using Bolus Inhalation of 15O-Oxygen Gas and Dynamic PET