


Abstract
The response of cancer to chemotherapy can be quantified using 18F-FDG to indicate changes in tumor metabolism. Quantification using the standardized uptake value (SUV) is more feasible for clinical practice than is the metabolic rate of 18F-FDG (MRFDG), which requires longer, dynamic scanning. The relationship between MRFDG and SUV depends in part on how each accounts for blood clearance of tracer. We tested whether chemotherapy and treatment with granulocyte colony-stimulating factor (CSF) changed the blood clearance curves and therefore affected the relationship between MRFDG and SUV. Methods: Thirty-nine patients with locally advanced breast cancer underwent 18F-FDG PET before and after chemotherapy, including granulocyte CSF. The area under the curve (AUC) for blood clearance was determined before and after therapy. MRFDGs were determined by graphical analyses, whereas SUVs were calculated using the standard formula normalized by body weight. MRFDG and SUVs were compared with each other and with tumor response. Paired percentage changes in MRFDG and SUV were also divided into tertiles based on pretherapy SUV to investigate differences in the relative sensitivity of SUV changes to MRFDG changes due to baseline tumor uptake. Results: Despite a small but statistically significant 6% decrease in blood AUCs after therapy (P = 0.02), SUV and MRFDG did not differ significantly in slope (P = 0.53) or in correlation before and after therapy (r = 0.95 for both). Percentage changes in MRFDG and SUV between serial scans correlated with each other (r = 0.84) and with patient response (P ≤ 0.06). The maximum detectable percentage change in SUV and the slope of percentage changes in MRFDG versus SUV for the patient tertile with the lowest baseline SUVs (65% ± 5% [±SE], slope (m) = 0.40 ± 0.12, n = 13) were significantly lower than for the other patients (86% ± 3%, m = 0.85 ± 0.10, n = 26, P = 0.01 for both). Conclusion: Chemotherapy and granulocyte CSF treatment resulted in a lower 18F-FDG blood AUC. The maximum detectable percentage change in 18F-FDG uptake is less when quantifying via static SUV than via dynamic MRFDG. This effect is small in most patients but may have clinical significance for measuring the response of patients with a low pretherapy 18F-FDG uptake.
The response of a tumor to therapy can be quantified by measuring changes in tumor glucose metabolism via serial PET scans of the glucose analog 18F-FDG (1–3). Clinicians most frequently quantify tumor glucose metabolism from static images using the standardized uptake value (SUV) despite known limitations (4–6), including the inability to separate background from tumor activity. Tumor metabolism can also be quantified from dynamic scans using a 2-compartment model (7,8) that allows calculation of the metabolic rate of 18F-FDG (MRFDG) from the tumor 18F-FDG flux constant, Ki, estimated via either nonlinear regression or graphical analysis (9,10). The merits of full kinetic analysis of dynamic scans versus static imaging have been extensively discussed in the literature (2,4–6,11–13).
Neoadjuvant treatment of locally advanced breast cancer at our institution often includes granulocyte colony-stimulating factor (CSF), a hematopoietic cytokine that helps support adequate concentrations of neutrophils and in the process alters the biodistribution of 18F-FDG (14,15). Granulocyte CSF therapy has been reported to significantly reduce blood levels of 18F-FDG in rats (15). The effect of granulocyte CSF on 18F-FDG uptake values has been reported for 18 patients with either primary locally advanced breast cancer or breast cancer metastasized to the lymph nodes, liver, lung, or bone. The study reported a high correlation between MRFDG, lean body mass, and glucose-normalized SUV before therapy and a significant decrease from a baseline r value of 0.96 to 0.84 after 3 cycles of chemotherapy (63 d) that included either granulocyte CSF or granulocyte–macrophage CSF (16).
The goal of our analysis was to use a larger, more uniform patient population to determine the impact of applying either dynamic or static 18F-FDG scans to quantify the response to chemotherapy regimes that could alter the biodistribution of PET tracers. Our hypothesis was that a change in tracer biodistribution between serial scans caused by factors such as granulocyte CSF may affect the relationship between MRFDGs and SUVs, because only quantification of the dynamic images (MRFDG) can directly compensate for the change in tracer dose available to the tumor. To this end, we studied the impact of granulocyte CSF–containing chemotherapy on the amount of tracer available to tumors and the linear relationship between MRFDG and SUV before and after therapy, and we examined the relationships between the percentage changes in MRFDG and SUVs and patient response.
MATERIALS AND METHODS
Patient Characteristics
We retrospectively analyzed 39 patients with ductal locally advanced breast cancer who underwent serial 18F-FDG PET before and after approximately 10 wk of neoadjuvant chemotherapy that included granulocyte CSF (filgrastim [Neupogen]; Amgen). The patients were participants in an ongoing prospective study whose selection criteria, treatment, and response assessment were previously described (17–19). Most patients (n = 37) received dose-dense weekly anthracycline (doxorubicin), with 35 also receiving daily cyclophosphamide and 2 receiving both cyclophosphamide and fluorouracil. The 2 remaining patients underwent weekly taxane-containing regimens. The typical granulocyte CSF dose of 5 μg/kg/d was administered every day except on the day of weekly intravenous chemotherapy. The granulocyte CSF dose was reduced by 25%–50% if the patient experienced bone pain and had a neutrophil count above 20,000/mL (20).
Tumor response was assessed through surgical pathologic examination of posttherapy tumors excised via lumpectomy or mastectomy. A complete response required absence of macroscopic tumor by histopathologic examination. A partial response indicated a greater than 50% reduction in residual tumor from baseline mass as measured via ultrasound, mammography, or physical examination. All other tumor responses were recorded as no response. The patients provided signed informed consent for the PET studies according to the guidelines of the University of Washington Human Subjects Committee.
PET
Our PET acquisition parameters and 18F-FDG production methods were previously described (17–19), and a brief summary follows. Patients were scanned using an Advance tomograph (GE Healthcare) for 60 min after infusion of 216–391 MBq of 18F-FDG. Regions of interest (ROIs) consisting of 1.5-cm-diameter circles were drawn over the breast tumor and the left ventricle of the heart to determine the tumor and blood time–activity curves. The same tumor ROI data were used for both the MRFDG and the SUV algorithms to avoid any comparison error due to the ROI placement (11).
Data Analysis
Areas under the curve (AUCs) for the blood time–activity curves from 0 to 60 min were calculated using trapezoidal integration to quantify the total amount of tracer available to tumors. The resulting AUCs in units of (Bq/mL) × min were converted into (SUV units) × min for individual patient scans.
Standard Patlak-Gjedde graphical analysis (10) was used to estimate the tracer flux constant, Ki (mL/min/g), using the tumor and blood time–activity curves from 30 to 60 min after injection. The MRFDG value (μmol/min/100 g) was calculated by multiplying Ki by the patient plasma glucose concentration (μmol/mL). The resulting MRFDG values served as the basis for interpreting 18F-FDG tissue uptake, because the dynamic algorithm can account for changes in the available tracer due to chemotherapy and granulocyte CSF treatment (11,21).
SUV was calculated using the standard weight-based formula. We determined the static tumor uptake by averaging the 3 time bins taken from 45 to 60 min. We also calculated average SUVs from 30 to 60 min and using glucose, lean body mass, and body surface area formulas and found similar or lower correlation results when compared with MRFDG or Ki values.
Statistics
The difference between the AUC for the blood time–activity curves was examined using a 2-tailed, paired Student t test. Linear relationships between MRFDG and SUV were modeled using generalized estimating equations to account for correlations between serial measurements. To investigate the role of higher uncertainty in percentage change in MRFDG and SUV at lower initial values (12,22), additional regression models fitted separate intercepts (percentage change in SUV for a 100% reduction in MRFDG) and slopes for patient tertiles grouped by pretherapy SUV. Percentage changes in MRFDG and SUVs were related to patient response using Wilcoxon and Kruskal–Wallis tests. The areas of receiver-operating-characteristic curves for discrimination of no response from response using percentage changes in MRFDG and SUV were also compared nonparametrically (23). Statistical analyses were conducted using a combination of Excel spreadsheets (Microsoft); JMP 5.0 and SAS 9.1 (SAS Institute); and R, version 2.2.1 (R Foundation for Statistical Computing). P values less than 0.05 were considered significant.
RESULTS
Patient Characteristics
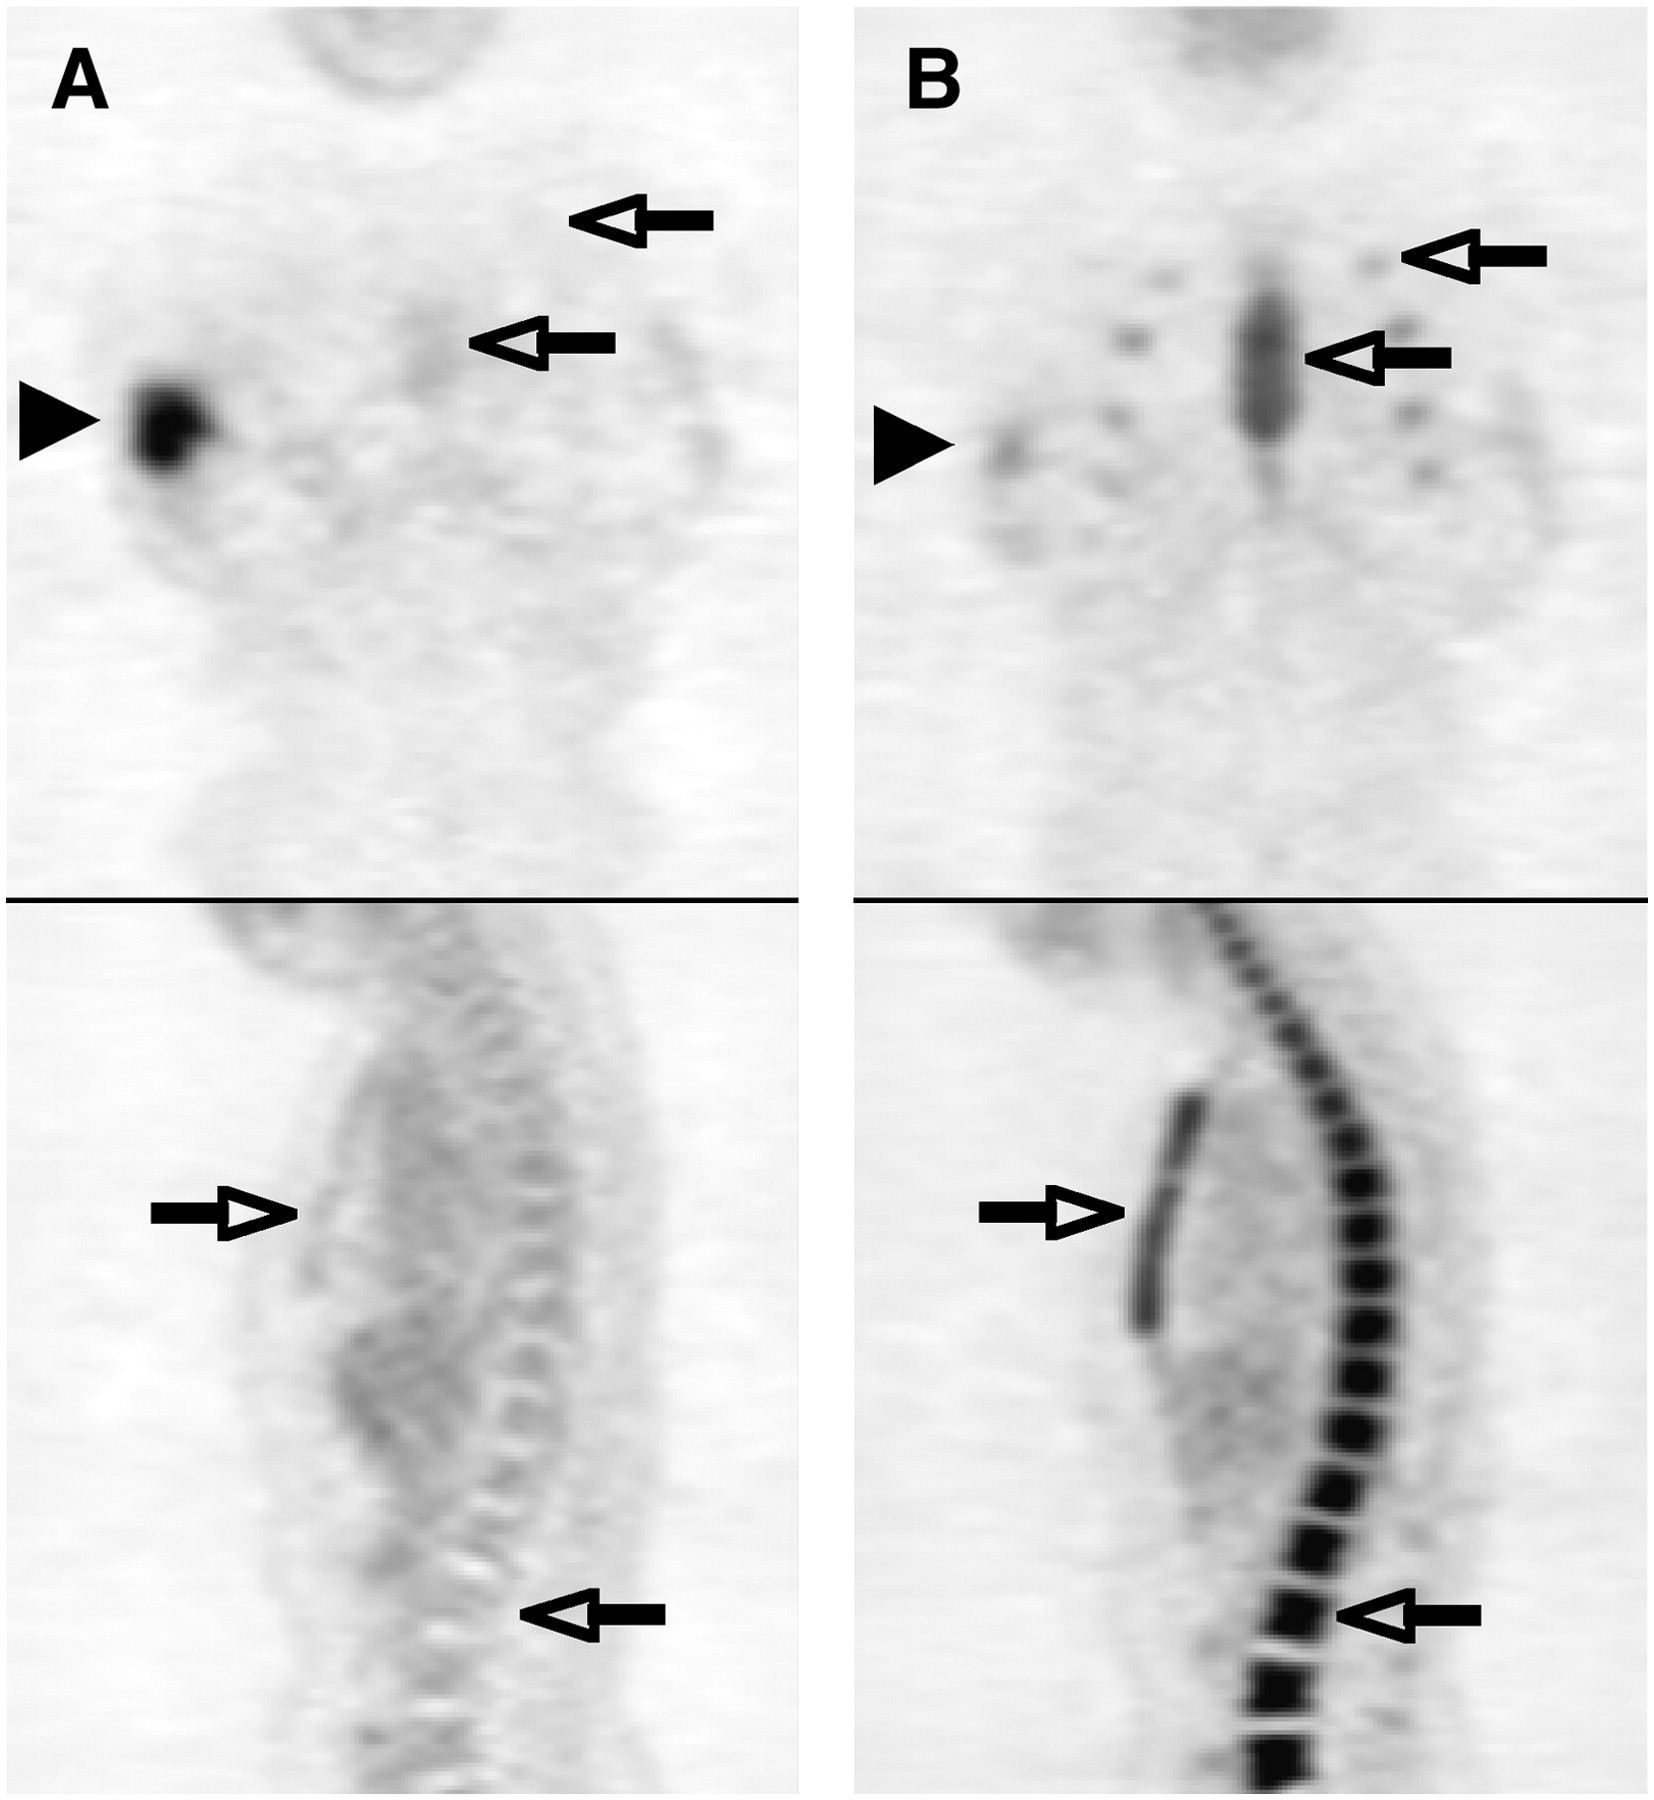
General patient characteristics have previously been reported (17–19) and are summarized below. Thirty-nine patients with ductal locally advanced breast cancer underwent serial 18F-FDG PET before and after a mean of 72 d (±18 d, SD) of neoadjuvant chemotherapy that included granulocyte CSF. The mean patient age was 47 y, mean baseline tumor size was 5.5 cm (range, 1.1–11.0 cm), and clinical TN stage ranged from T1 N1 to T4 N2 disease, with 10% diagnosed with inflammatory T4 carcinomas. Seventeen of the patients had a complete macroscopic pathologic response, 17 had a partial response, and 5 had no response. Serial PET images of a patient who achieved a complete response are shown in Figure 1.

Coronal and sagittal 18F-FDG PET images of same patient before treatment (A) and after neoadjuvant chemotherapy including granulocyte CSF (B). Right breast cancer decreased in 18F-FDG activity after treatment (arrowheads), whereas 18F-FDG activity increased in marrow in spine, sternum, and ribs (open arrows).
AUCs for Blood Time–Activity Curves
AUCs for blood time–activity curves were calculated to test our hypothesis that the total amount of tracer available to tumors would decrease after granulocyte CSF–containing chemotherapy. The mean blood clearance curves for the 39 patients before and after therapy are shown in Figure 2. The small 6% decrease in average blood AUCs after chemotherapy and granulocyte CSF treatment was statistically significant (10.7 ± 4.4 SUV units × min [±SE], P = 0.02).
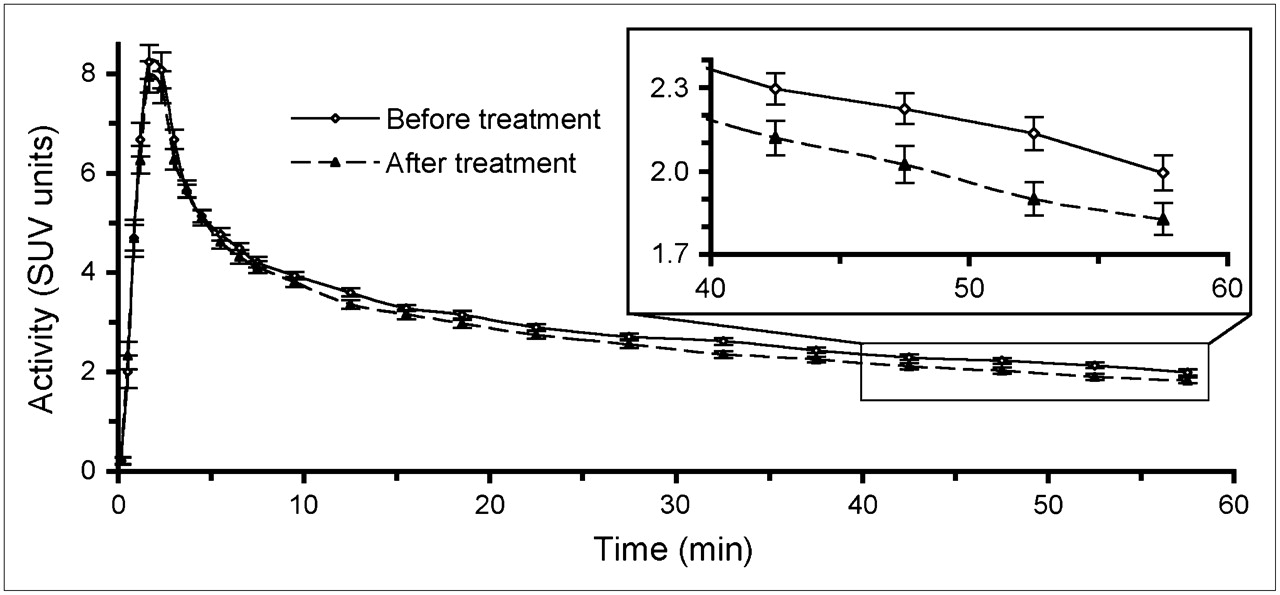
Mean 18F-FDG blood clearance time–activity curves for patients (n = 39) before treatment and after chemotherapy including granulocyte CSF, with close-up of last 4 time bins with SE bars on middle time points (inset). Area under curve significantly decreased after treatment (P = 0.02).
MRFDG and SUV Relationship Before and After Therapy
SUVs were plotted versus MRFDGs before and after therapy in Figure 3 to assess any impacts that the reduced total amount of available tracer due to therapy had on their correlation. The pretreatment slope of 0.33 SUV units per MRFDG units did not differ (P = 0.53) from the posttreatment slope of 0.32 SUV units per MRFDG units. The pretreatment intercept of 1.22 significantly differed (P = 0.04) from the posttreatment intercept of 0.87. When linear regression models were fitted for pre- and posttherapy values separately, the correlation coefficient was 0.95 for each.

SUV vs. MRFDG for all patients before treatment (+ and dashed line) and after granulocyte CSF–containing chemotherapy regimes (○ and solid line).
Relationships Between Percentage Changes in MRFDG and SUV
The linear relationship between percentage changes in MRFDG and in SUV after chemotherapy and granulocyte CSF treatment (r = 0.84, slope [m] = 0.75 ± 0.08, n = 39) is seen in Figure 4A. To investigate the impact of pretherapy 18F-FDG uptake on response quantification, we also examined changes in SUV versus MRFDG grouped by baseline SUV (Fig. 4 and Table 1). The slope for the percentage changes in SUV versus MRFDG in the tertile of patients with the lowest baseline SUV (m = 0.40 ± 12, n = 13) was significantly different (P = 0.01) from the slope calculated with the other patients (m = 0.85 ± 0.10, n = 26).

Percentage change in SUV vs. percentage change in MRFDG for all (n = 39) patients (A), first patient tertile (○, n = 13) with lowest baseline SUVs (B), and second and third patient tertiles (+, n = 26) with higher baseline SUVs (C). Maximum detectable percentage change in SUV (*) is mean percentage alteration in tumor metabolism that can be detected using SUV algorithm assuming that MRFDG model can detect 100% decrease in tumor metabolic activity.
Linear Regression Parameters for Changes in SUVs Versus MRFDGs from Before to After Therapy
The absolute value of the y-intercept at MRFDG = −100% for plots of percentage changes in SUV versus MRFDG estimates the absolute maximum detectable percentage change in SUV when glucose metabolism has been completely shut down. This estimation indicates the potential impact of the background of nonphosphorylated 18F-FDG on the static SUV measurement of response for patient populations with different ranges of baseline SUVs. The 65% maximum detectable percentage change in SUV for the patient tertile with the lowest initial SUV (SUVpre ≤ 3.0, 65% ± 5%, r = 0.71, n = 13) in Figure 4B was significantly lower (P = 0.01) than the 86% maximum detectable percentage change in SUV for patients with higher pretherapy SUVs (SUVpre > 3.0, 86% ± 3%, r = 0.89, n = 26) in Figure 4C.
Percentage Changes in MRFDG and SUV Relationships with Patient Response
Nonparametric tests found the percentage changes in MRFDG and SUV to differ by response category. Percentage changes in both MRFDG and SUV significantly correlated with pathology response and no response (P = 0.005 and 0.02, respectively). Percentage changes in MRFDG were related (P = 0.02) to no response, partial response, or complete response, whereas percentage changes in SUV demonstrated a trend toward association (P = 0.06) with the 3 response categories. The areas under receiver-operating-characteristic curves for discrimination of no response from response using percentage changes in MRFDG and SUV (areas of 0.89 and 0.82, respectively) did not differ significantly (P = 0.14).
DISCUSSION
This study examined the relationship between MRFDG and SUV methods used to quantify tumor 18F-FDG uptake and the relationship to patient response during therapy. We report a small but statistically significant decrease in the amount of 18F-FDG tracer available to patient tumors after chemotherapy that includes granulocyte CSF treatment, as measured by the blood clearance AUC. This decrease is likely the result of the change in the biodistribution of 18F-FDG tracer after therapy that is apparent in Figure 1 as increased uptake by the marrow. The 6% decrease in available tracer in our study was small and may not be clinically important; the SD of the mean percentage differences between blood AUCs was 8% in a previous 18F-FDG PET test–retest study of 11 men and 5 women with metastatic cancer using ROIs drawn either in the left ventricular cavity (n = 11) or the aorta (n = 5) (12). However, our result is consistent with a previously reported trend (P = 0.08) toward lower blood 18F-FDG activity in 16 breast cancer patients treated with chemotherapy regimes containing granulocyte CSF (15). The same report found that rats injected with granulocyte CSF had significantly lower blood levels of 18F-FDG than rats injected with saline (15). This finding suggests that our observed decrease in blood 18F-FDG uptake was due primarily to granulocyte CSF, though our study was not designed to separate the effects of individual chemotherapy components.
The comparable relationships between dynamic MRFDG and static SUVs found before and after therapy using 39 locally advanced breast cancer patients is consistent with previous studies that examined smaller, less uniform patient populations. Our findings of high correlations between MRFDG and SUV agree with prior studies performed on patients with gastroesophageal, breast, and non–small cell lung cancer (16,21,24)—studies that reported high correlations between values calculated for 18F-FDG tumor uptake by dynamic nonlinear or graphic models and several static SUV algorithms.
We also investigated the range of maximum detectable percentage changes in SUV with therapy versus changes in MRFDG based on the range of pretherapy SUVs. We observed lower maximum detectable percentage changes in SUV associated with low pretherapy SUVs, as was expected and is likely due to a background of unmetabolized 18F-FDG included in SUV measurements. This observation agrees with a recent breast cancer study that reported serial 18F-FDG PET to be less accurate in response assessment for patients with low 18F-FDG uptake on pretherapy scans (with a tumor-to-background ratio of less than 5) (22). A tumor-to-background ratio of 5 is comparable to an SUV of 2.5, assuming a typical normal breast tissue SUV of 0.5 (25), and agrees with our results for the patient tertile with the lowest baseline SUV average, 2.5. Both analyses suggest that caution should be taken when using percentage change in SUV to quantify response in patients with low pretherapy tracer uptake (SUV < 3). The dependence of the maximum detectable percentage change in SUV on pretherapy uptake illustrates the benefit of using dynamic kinetic analyses to measure response, especially for tumors with low 18F-FDG uptake. We noted a small, statistically insignificant improvement in response classification for MRFDG versus SUV.
CONCLUSION
Chemotherapy and granulocyte CSF treatment resulted in a statistically significant lower amount of 18F-FDG tracer in the blood AUC. The small decrease in mean concentration of 18F-FDG in the blood did not have a large impact on the ability of changes in SUV to predict patient pathologic response to granulocyte CSF–containing chemotherapy regimens. The maximum detectable percentage change in 18F-FDG uptake was lower when quantification was via static SUV versus dynamic MRFDG. This effect is small but may have clinical significance for measuring the response of patients with low pretherapy 18F-FDG uptake (SUV < 3).
Acknowledgments
This work was supported by grants CA42045, CA72064, CA74135, and RR17229 from the National Institutes of Health. We thank the radiochemists of the University of Washington for isotope production, the physicists and technicians for assistance with imaging, and Dr. Thomas J. Lawton for pathology interpretations. We also acknowledge the referring oncologists and staff of the Seattle Cancer Care Alliance.
Footnotes
-
COPYRIGHT © 2007 by the Society of Nuclear Medicine, Inc.
References
- Received for publication October 18, 2006.
- Accepted for publication March 16, 2007.


Jump to section
Related Articles
Cited By...
- Principles of Tracer Kinetic Analysis in Oncology, Part II: Examples and Future Directions
- Principles of Tracer Kinetic Analysis in Oncology, Part I: Principles and Overview of Methodology
- Getting the Most out of 18F-FDG PET Scans: The Predictive Value of 18F-FDG PET-Derived Blood Flow Estimates for Breast Cancer
- Comparison of Tumor Uptake Heterogeneity Characterization Between Static and Parametric 18F-FDG PET Images in Non-Small Cell Lung Cancer
- Role of Positron Emission Tomography for the Monitoring of Response to Therapy in Breast Cancer
- PET Tumor Metabolism in Locally Advanced Breast Cancer Patients Undergoing Neoadjuvant Chemotherapy: Value of Static versus Kinetic Measures of Fluorodeoxyglucose Uptake
- Response to Therapy in Breast Cancer
- Monitoring Primary Systemic Therapy of Large and Locally Advanced Breast Cancer by Using Sequential Positron Emission Tomography Imaging With [18F]Fluorodeoxyglucose
- Tumor Metabolism and Blood Flow Changes by Positron Emission Tomography: Relation to Survival in Patients Treated With Neoadjuvant Chemotherapy for Locally Advanced Breast Cancer